Goldman Sachs Research
Re-imagining Big Oils: How Energy Companies can successfully adapt to climate change (redacted)
The following is a redacted version of GS Research’s report “Re-imagining Big Oils: How Energy Companies can successfully adapt to climate change” originally published Oct. 8, 2018 (51pgs). All company references in this note are for illustrative purposes only and should not be interpreted as investment recommendations.
Big Oils have shown tremendous ability to adapt to technological change in their 100+ years of history. We believe it is now strategic that they drive a low carbon transition consistent with the global ambition to contain global warming within 2° C. Big Oils have many tools to achieve this transition towards Big Energy and become broader, cleaner energy providers: a deeper presence in the global gas and power chains, including retail, EV charging and renewables; biofuels; petrochemicals; improved upstream and industrial operations; and carbon capture. In this report, we discuss the options available and argue that the strategic objective can be delivered with improving corporate returns and renewed value for scale and integration. This transition will require deep cultural and corporate changes and may leave the higher carbon parts of the value chain financially stranded and underinvested, such as oil production (particularly oil sands and older fields) and refining, leading to potentially higher oil prices and refining margins in the coming decade and to a bigger role for private capital in those areas.

Big Oils can lead a profitable path towards Big Energy and a 2° C scenario

Low carbon: Some context around climate change and greenhouse gas (GHG) emissions

Climate change is a widely debated topic, with ongoing diversity of views. However, there is growing consensus among policy makers and scientists that global surface temperatures are rising and that the main cause is human-induced emissions of greenhouse gases (GHGs), which include carbon dioxide (CO2), methane (CH4), water vapour (H2O) and nitrous oxide (N2O). Carbon dioxide and methane are the major GHG components, representing 76% and c.16% of the overall emissions mix, respectively. According to the International Energy Agency (IEA), over two-thirds of these GHG emissions can be attributed to the energy sector (c.32 GtCO2 in 2015), with coal, oil and gas representing 45%, 35% and 20% of the global energy-related emissions, respectively. Of note, power generation accounts for 42% of those CO2 emissions (c.13.4 GtCO2), dominated by coal (72%).

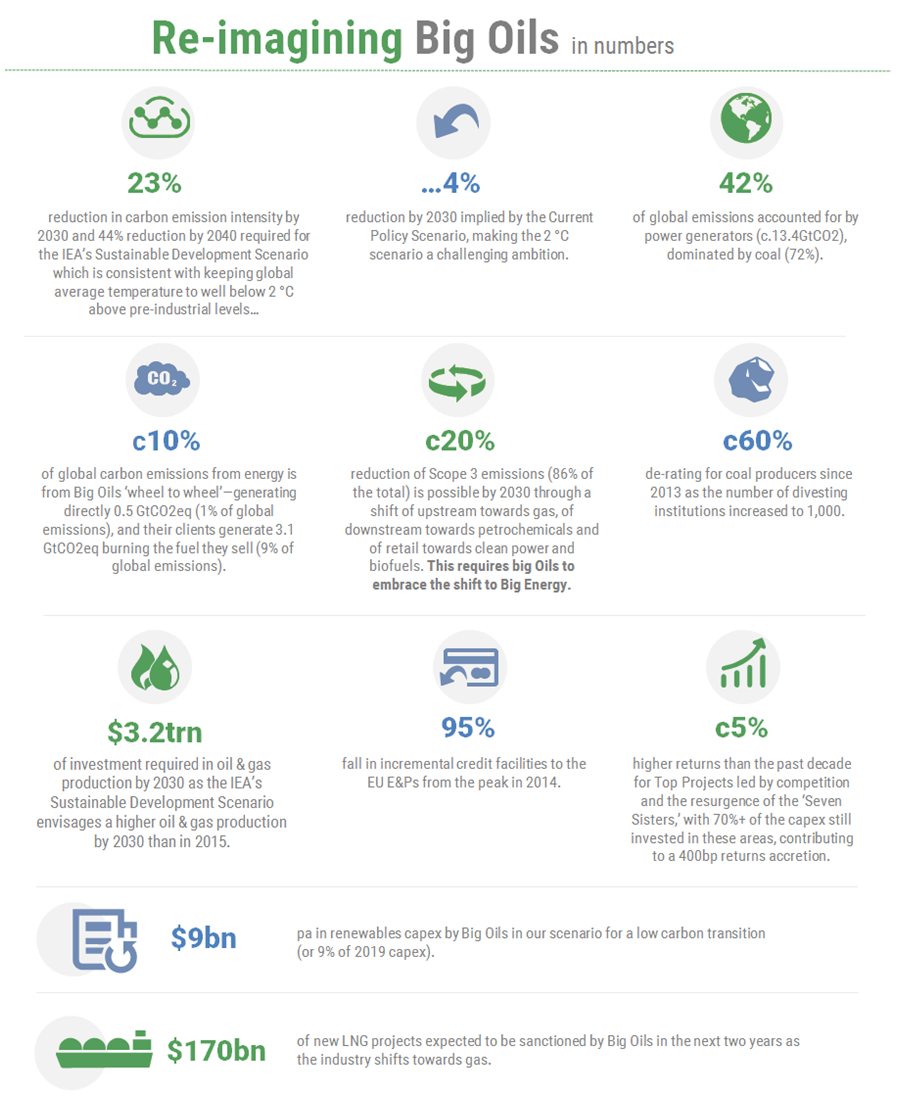
Big Oils directly generate only 1% of the world's GHG emissions, but influence 10% of 'well-to-wheel' and 'well-to-wire' emissions

In this report, we do not enter into the scientific debate about global warming and how best to contain it. We take the International Energy Agency (IEA)'s scenarios as a reference point and analyse Big Oils' strategic options to deliver carbon emission reductions in line with society's (here referring to the world) ambitions to remain within 2° C of global warming, while achieving universal access to modern energy by 2030, as laid out in the IEA's ambitious Sustainable Development Scenario (SDS). Big Oils are key to the global carbon debate, as they produce and market energy products that account for c.10% of the global energy sector carbon emissions. In 2017, on a scope 1 and 2 basis (i.e. the emissions directly generated in their operations and those indirectly generated by the power and heat consumed), Big Oils reported an aggregated GHG emissions of 523 MtCO2eq (c.1% of global energy-related GHG emissions), while scope 3 (the emissions generated at the point of consumption by the products sold) amounted to 3.1 GtCO2eq (c.9% of global energy-related GHG emissions).

Big Oils have a major role to play in de-carbonization, as 'Big Energy', in an evolving competitive landscape

We believe that the low carbon transition is changing the competitive landscape in global energy, with tightening financial conditions for all hydrocarbon investments (coal, oil production - particularly oil sands and mature fields, oil refining and - to a lesser extent - gas) creating a better industry structure and higher returns for Big Oils in their traditional oil & gas business. We analyse this industry structure change in detail in our Age of Restraint report. The higher returns from the traditional oil & gas businesses will provide Big Oils the funding to re-imagine their business, showing renewed value and strategic importance to scale and vertical integration. They can build on their competitive advantages in global supply chain management, recognised brands, technological expertise, risk management and global footprint to become Big Energy, replicating their century-old vertical integration in oil (well-to-wheel) to the gas and power value chains (well-to-wire), but also to petrochemicals (well-to-high performance material), biofuels (waste-to-wheel), renewables (sun & wind-to-wire), with carbon capture and natural sinks (such as re-forestation) opportunities to offset their carbon emissions.
We estimate that this transition, if fully embraced and executed, can lead to a 20%+ 'well to wheel' (and 'well to wire') carbon emission reduction that is consistent with society's 2° C ambition. We estimate that the blended returns on new investments, leveraging our Top Projects database, could be materially higher than over the past 10 years, through a mix of a c.400 bp enhancement of returns in hydrocarbon investments and a c.100 bp dilution from low carbon investments.

Key parts of the oil value chain may end up financially stranded and under-invested, leading to higher prices at the pump in the 2020s

The push for de-carbonization is impacting long-term oil & gas investment: banks are reducing financing for new hydrocarbon projects; Big Oils are committing to lower carbon intensity, implying a shift away from oil production and refining; US E&Ps are focusing entirely on short-cycle developments; NOCs are focusing more on gas. We estimate that this may lead to structural underinvestment in key parts of the oil & gas supply chain, particularly in refining, oil sands, mature oil fields and broader long-life oil production assets. This is consistent with our Top Projects 2018 analysis, where we show that the pace of long-cycle oil mega-projects' ramp-up is likely to slow down from 1.2-1.4 mn bls/d at present to 0.6-0.8 mn bls/d from 2021, potentially laying the foundations to a very tight oil market in the 2020s.

Exhibit 1: The pace of non-OPEC mega-projects (Top Projects) growth is likely to halve after 2020

YoY oil production growth (kboe/d) from non-OPEC, excluding shale projects
1. The pace of non-OPEC mega-projects (Top Projects) growth is likely to halve after 2020. Data available on request.
Source: Goldman Sachs Global Investment Research

From Big Oils to Big Energy in 10 charts

Exhibit 2: The IEA lays out an aggressive 23% carbon intensity reduction by 2030 (SDS) consistent with a 2° C ambition

CO2 emissions intensity under three scenarios (CPS, NPS, SDS)
2. The IEA lays out an aggressive 23% carbon intensity reduction by 2030 (SDS) consistent with a 2° C ambition. Data available on request.
Source: OECD/IEA 2017 World Energy Outlook, IEA publishing

Exhibit 3: We estimate that Big Oils can deliver an equivalent 20%+ reduction in GHG by 2030 in their direct operations...

Big Oils scope 1/2 GHG emissions intensity 2017-30 bridge
3. We estimate that Big Oils can deliver an equivalent 20%+ reduction in GHG by 2030 in their direct operations.... Data available on request.
Source: Goldman Sachs Global Investment Research

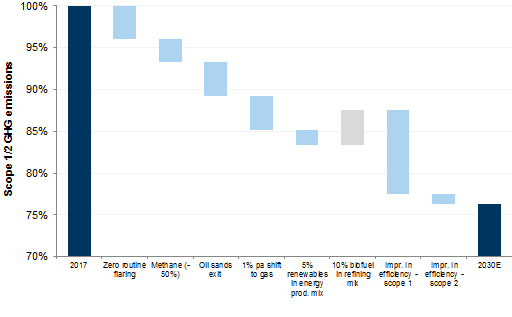
Exhibit 4: ...and on a ‘well to wheel’ basis, transforming themselves into ‘Big Energy’

Big Oils scope 3 GHG emissions 2017-30 bridge
4. ...and on a ‘well to wheel’ basis, transforming themselves into ‘Big Energy’. Data available on request.
Source: Goldman Sachs Global Investment Research

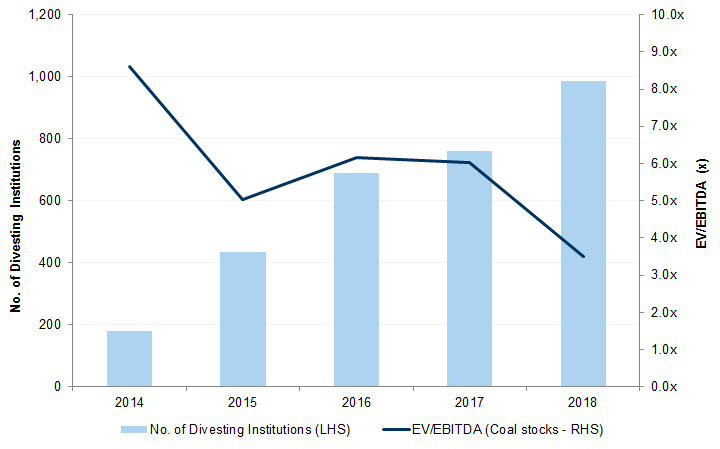
Exhibit 5: This strategic shift will be important to avoid investor divestments, as suffered by the coal industry...

# of divesting institutions (LHS) vs Coal stocks EV/EBITDA
5. This strategic shift will be important to avoid investor divestments, as suffered by the coal industry.... Data available on request.
Source: FactSet, DivestInvest, 350.org

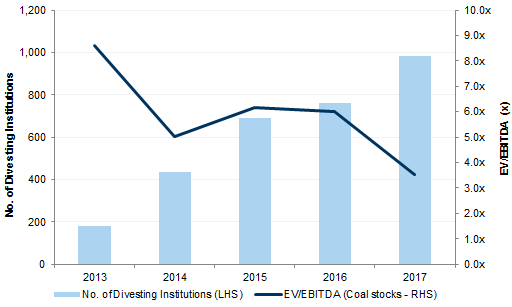
Exhibit 6: ...and may leave the higher carbon parts of the energy chain financially stranded and under-invested...

Lifecycle GHG intensity by provenance/product in kgCO2eq/boe
6. ...and may leave the higher carbon parts of the energy chain financially stranded and under-invested.... Data available on request.
Source: IPCC, Company data, Goldman Sachs Global Investment Research

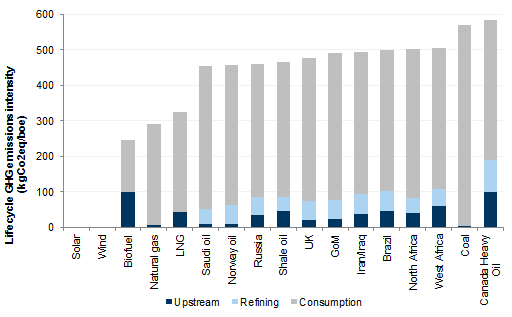
Exhibit 7: ...as financing for independent long-cycle oil & gas developers dries up

EU E&Ps total amount raised through credit facilities/bank loans US$bn
7. ...as financing for independent long-cycle oil & gas developers dries up. Data available on request.
Source: Bloomberg

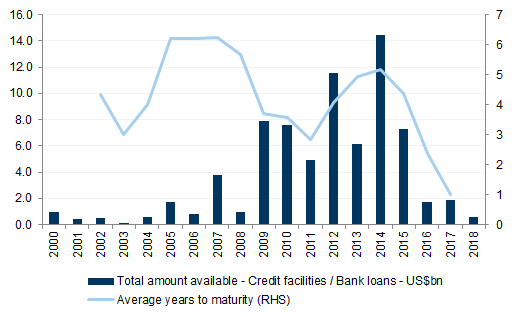
Exhibit 8: Even the IEA’s most ambitious low-carbon scenario requires more oil & gas production by 2030...

SDS Energy demand in 2015 and 2030
8. Even the IEA’s most ambitious low-carbon scenario requires more oil & gas production by 2030.... Data available on request.
Source: OECD/IEA 2017 World Energy Outlook, IEA Publishing

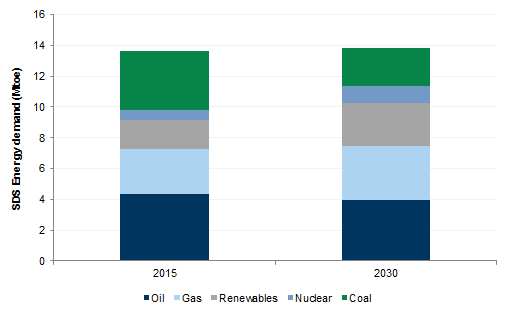
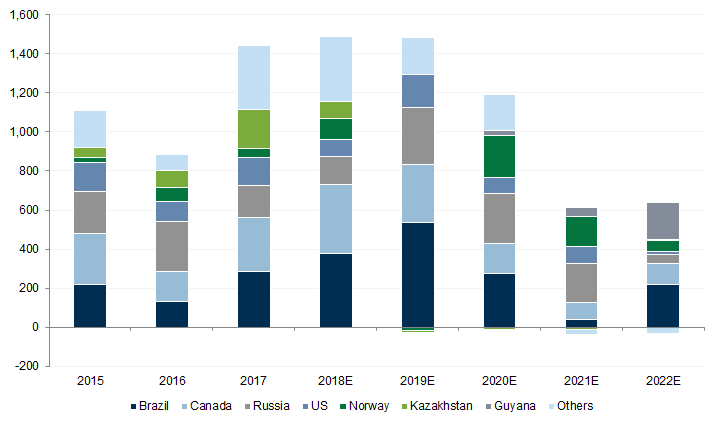
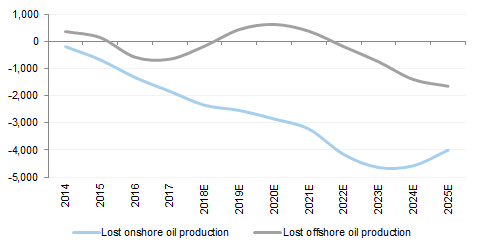
Exhibit 9: ...but the industry’s shift of capital away from oil is already creating a 6 mn bls/d gap in the 2020s...

Top Projects 2018 lost offshore and onshore oil production from long-cycle developments; 2018 vs 2014 expectations.
9. ...but the industry’s shift of capital away from oil is already creating a 6 mn bls/d gap in the 2020s.... Data available on request.
Source: Goldman Sachs Global Investment Research

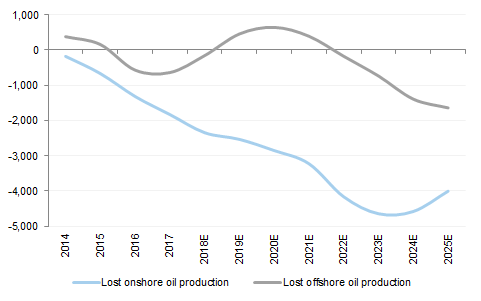
Exhibit 10: ...while creating an upcoming LNG construction boom...

Top Projects reserves sanctioned by the 'Seven Sisters' (RDShell, BP, TOTAL, ENI, Equinor, ExxonMobil, Chevron)
10. ...while creating an upcoming LNG construction boom.... Data available on request.
Source: Company data, Goldman Sachs Global Investment Research

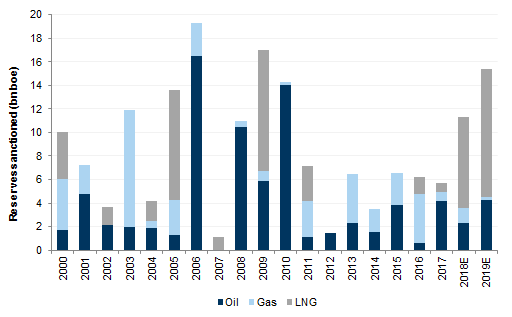
Exhibit 11: ...led by Big Oils, as they shift hydrocarbon production towards global gas

LNG production capacity (producing, under dev.) and as % 2017 total oil & gas production by company
11. ...led by Big Oils, as they shift hydrocarbon production towards global gas. Data available on request.
Source: Company data, Goldman Sachs Global Investment Research

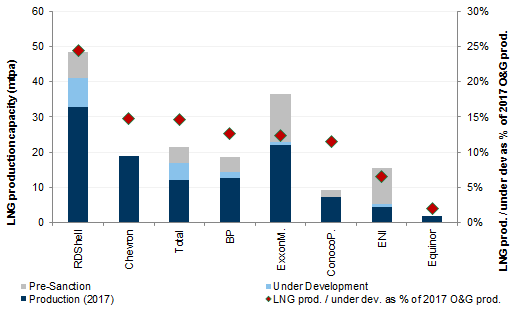
Exhibit 12: A more concentrated, under-financed oil & gas industry provides Big Oils with improving corporate returns, including the dilution from low carbon investments

Big Energy % energy portfolio mix and IRR in 2003-14 and in the 'Future'
12. A more concentrated, under-financed oil & gas industry provides Big Oils with improving corporate returns, including the dilution from low carbon investments. Data available on request.
Source: Company data, Goldman Sachs Global Investment Research

Data available on request.
Source: OECD, IEA, Company data, Goldman Sachs Global Investment Research
The IEA Sustainable Development Scenario requires a 23% reduction in carbon emission intensity by 2030 and 44% by 2040
The Paris Agreement (even before the US exited) was an important step towards global coordination in curbing carbon emissions, but the policies in place are not sufficient to achieve the 2° C goal. The IEA forecasts emissions under the current policies (CPS) and the expected new, tighter policies that are likely to be implemented in the future (NPS). Neither of these scenarios comes close to reducing carbon emissions in line with the 2° C scenario. Only the ambitious sustainable development scenario is consistent with achieving the 2° C goal. The three scenarios, named Current Policies (CPS), New Policies (NPS), and Sustainable Development (SDS) highlight the discrepancy between the proposed policies and those required to contain global warming. In this report, we hold Big Oils to the highest ambitions (SDS) and look at how they can achieve a reduction in the well-to-wheel carbon emissions (scope 1/2/3) of 20%+ by 2030. Below as per 'OECD/IEA 2017 World Energy Outlook, IEA Publishing'.
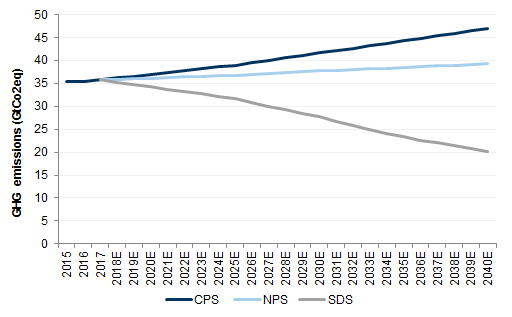
  • Current Policies (CPS): The Current Policies Scenario excludes the realisation of announced, new policy targets and considers only the impact of those policies and measures that are firmly enshrined in legislation as of mid-2017. In addition, where existing policies target a range of outcomes, the assumption in the Current Policies Scenario is that the least ambitious end of this range is achieved. In this way, the scenario provides a cautious assessment of where momentum from existing policies might lead the energy sector in the absence of any additional impetus from governments.

  • New Policies (NPS): The New Policies Scenario aims to provide a sense of where today’s policy ambitions seem likely to take the energy sector. It incorporates not just the policies and measures that governments around the world have already put in place, but also the likely effects of announced policies, as expressed in official targets or plans.

  • Sustainable Development (SDS): The Sustainable Development Scenario takes a fundamentally different approach from those discussed above. While the Current Policies and New Policies scenarios start with certain assumptions about policies and see where they lead the energy sector, the Sustainable Development Scenario starts with a certain vision of where the energy sector needs to go and then works back to the present.

Exhibit 13: Carbon intensity is expected to fall by 23% by 2030 (vs 2017)...

CO2 emissions intensity under three scenarios (CPS, NPS, SDS)
13. Carbon intensity is expected to fall by 23% by 2030 (vs 2017).... Data available on request.
Source: OECD/IEA 2017 World Energy Outlook, IEA Publishing

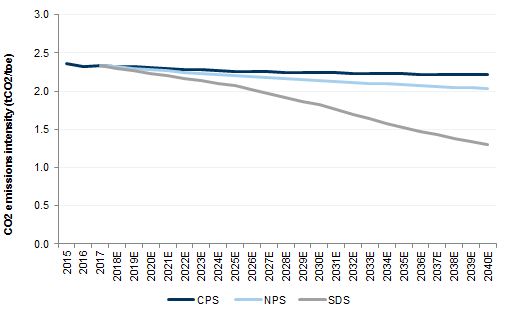
Exhibit 14: ...and by 44% by 2040 under the IEA's most ambitious scenario (SDS)

GHG emissions under three scenarios (CPS, NPS, SDS)
14. ...and by 44% by 2040 under the IEA's most ambitious scenario (SDS). Data available on request.
Source: OECD/IEA 2017 World Energy Outlook, IEA Publishing

Energy mix: Big Oils have a major part to play in the global low carbon transition

The aim to stay within 2° C of global warming requires a strong focus and investment in all carbon reduction initiatives: energy efficiency across the oil & gas chains, cleaner power generation, cleaner transportation fuels, lower methane emissions and flaring, carbon capture and natural sinks. We believe that Big Energy has a major role to play in all of these initiatives. The most important initiative by 2030 will be to transition away from coal in power generation and industrial uses. The IEA's Sustainable Development Scenario (SDS) assumes that the share of coal in energy production declines from 28% (2015) to 18% (2030) of the energy mix. This shift is driven by gas demand growth of +19% (SDS) by 2030, and renewable energy demand by 50% (SDS). The IEA Sustainable Development Scenario envisages higher oil & gas production by 2030 than in 2015. If we assume an industry average 5% pa decline rate in oil & gas production from 2017 until 2030, this implies that the industry will need to replace c.50% of today's production, equivalent to almost 80 mn boe/d of oil & gas production. At the industry's current average replacement cost of c.$40k/boepd, this equates to $3.2 tn of investment required in oil & gas production by 2030.

Exhibit 15: Under the SDS scenario, demand for coal is expected to decline by 36% by 2030

SDS Energy demand in 2015 and 2030
15. Under the SDS scenario, demand for coal is expected to decline by 36% by 2030. Data available on request.
Source: OECD/IEA 2017 World Energy Outlook, IEA Publishing

Exhibit 16: Oil & gas is expected to be broadly flat as part of the energy mix

SDS Energy mix in 2015 and 2030
16. Oil & gas is expected to be broadly flat as part of the energy mix. Data available on request.
Source: OECD/IEA 2017 World Energy Outlook, IEA Publishing

From Big Oils to Big Energy, a de-carbonization path compliant with a 2° C scenario

In this report, we analyse how Big Oils can utilize their areas of technical expertise, competitive advantage and brands/customer relationships to evolve into Big Energy and deliver a carbon reduction in their portfolio consistent with the most ambitious of the IEA carbon reduction paths: the Sustainable Development Scenario. To better analyse the 'well-to-wheel' carbon reduction opportunity, we analyse separately what the industry can deliver in each of scope 1, scope 2 and scope 3 carbon emissions. For an explanation of the different scopes, see Appendix A. In this analysis, we look at the % change in Big Oils' emission intensity (MtCO2eq/Mtoe), and compare it to the IEA intensity reduction path. We do not analyse the absolute amount of emissions, in order not to penalize companies that are growing their business vs. shrinking corporates. We look out to 2030 in this analysis (rather than to 2030 and 2040, as the IEA does), as we believe that technological advancements in the coming decade will materially re-shape the carbon strategy beyond 2030, making today's analysis obsolete.

A deep dive into the GHG reduction initiatives on scope 1, 2 and 3

We analyse first the emissions that Big Oils generate directly through their operations, including methane emissions (scope 1) and the indirect generation through their power and heat consumption (scope 2). These are the carbon emissions that are directly attributable to Big Oils. Although they make up only 10%-15% of 'well to wheel' emissions, Big Oils have strong control over this set of emissions and are driving several key strategic initiatives to curb them. The reporting of this set of emissions is broadly consistent throughout the industry, with operated scope vs. equity production being the key difference. Then we analyse the emissions generated through consumption of the products sold by Big Oils (scope 3). These represent the vast majority of the 'well to wheel' emissions, but are generated outside the control of the oil companies. Therefore the key drivers of emission reductions lie in shifts in the sales and production mix. Scope 3 also shows large discrepancies in the reporting methodology, as it can be calculated using upstream production, refining throughput or final sales (whichever the larger).
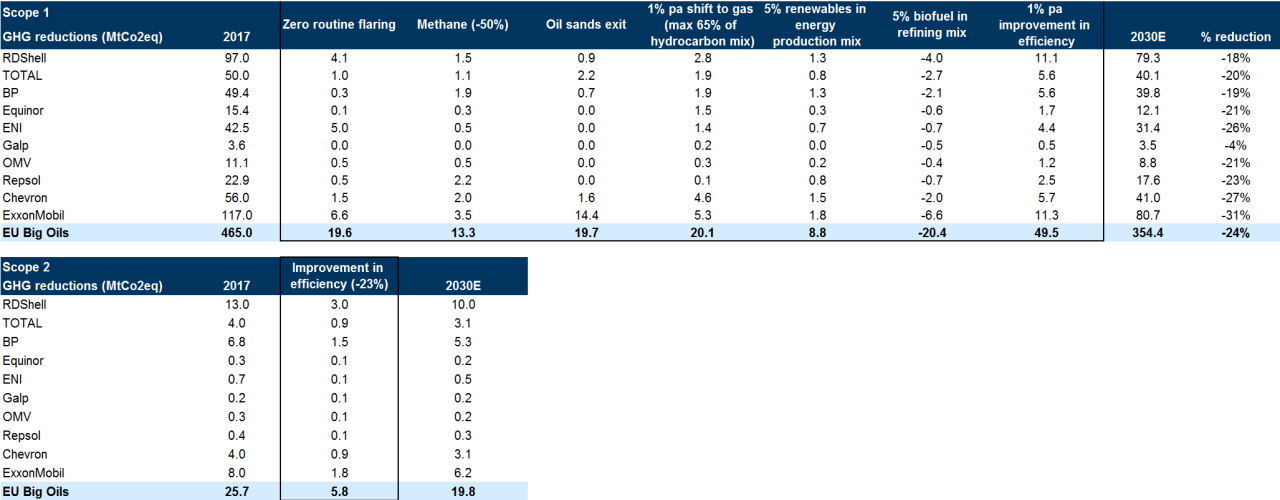
  • Scope 1 emission reduction (13% of total) depends on both process and mix changes and we see six main areas of action: (1) reduction in flaring; (2) reduction of methane emissions; (3) exit from highly carbon-intensive extraction processes (such as Canadian oil sands); (4) improvement in overall production efficiency (helped by disposing of older fields and refineries); (5) production shift towards gas (although LNG does not have materially lower scope 1 CO2 emissions than conventional oil); (6) an expansion in renewable production capacity. An increase in biofuel production would actually increase the scope 1 CO2 intensity, although it has lower well-to-wheel emissions. Overall we believe that scope 1 and 2 GHG emissions could be lowered by c.24% by 2030 following the adoption of all these initiatives, achieving a reduction in carbon intensity in line with the IEA's SDS.

  • Scope 2 emission reduction (1% of total): we assume that the carbon intensity of third-party power and heat acquired to run the operations improves in line with the average improvement in power generation laid out by the IEA's SDS. It could actually improve faster if Big Oils used only renewables and gas to power their own operations (for instance Shell's decision to source hydro power for its Canada LNG development).

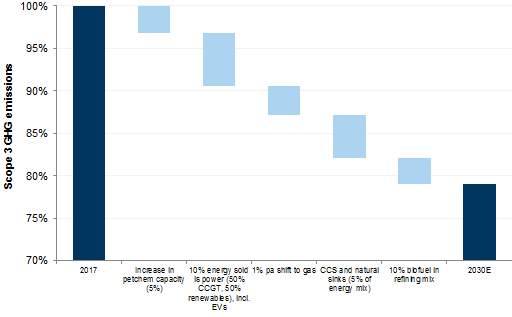
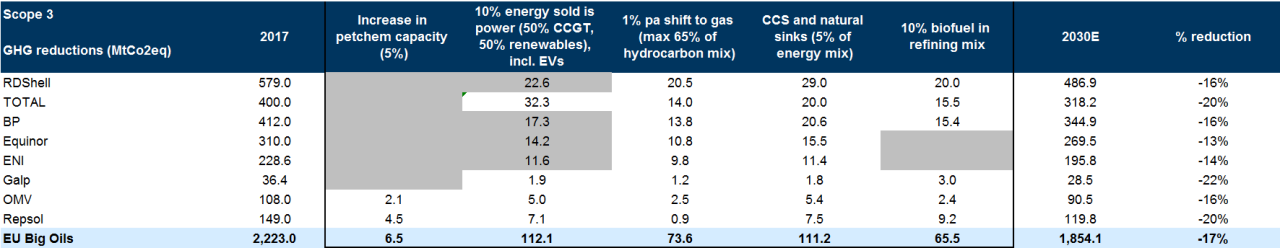
  • Scope 3 emission reduction (86% of total): these emissions are the most important, as they constitute 80%+ of well-to-wheel emissions, but Big Oils have the least control over them, as they are generated by their customers and not directly. The accounting of scope 3 matters, as the levers available to reduce the GHG intensity change according to whether it is calculated at production, refining throughput or final sales. Final sales offer more options of lower-carbon product diversification, especially if the intensity is calculated including the petrochemical output (where carbon is not burned, but sequestered in the materials produced). In Exhibit 18, we take the broadest definition, although we do discuss the company-specific reporting and commitments in the section below 'Big Oils and GHG reduction'. We see five main areas of action that can drive scope 3 carbon intensity reduction and the move of Big Oils towards Big Energy: (1) the shift of production from oil towards gas (including LNG); (2) the shift of downstream oil from refining to petrochemicals; (3) an expansion downstream in gas (similar to what Big Oils have always had in oil, with production/refining/retail marketing) to gas & power retail, including power supplied through CCGTs and renewables; (4) increased sales of biofuels; (5) carbon capture and natural sinks (re-forestation), to reduce net emissions. If Big Oils use all these levers, on our estimates they can achieve a c.21% reduction in scope 3 carbon intensity, allowing an overall 'well-to-wheel' reduction in line with the IEA SDS ambitions.

Exhibit 17: Scope 1/2 GHG emissions intensity can be reduced by c.24% by 2030...

Scope 1/2 GHG emissions intensity 2017-30 bridge
17. Scope 1/2 GHG emissions intensity can be reduced by c.24% by 2030.... Data available on request.
Source: Goldman Sachs Global Investment Research

Exhibit 18: ...while scope 3 can be cut by c.21%, through a mix change of the energy products produced and sold

Scope 3 GHG emissions 2017-30 bridge
18. ...while scope 3 can be cut by c.21%, through a mix change of the energy products produced and sold. Data available on request.
Source: Goldman Sachs Global Investment Research

While Big Oils can show emission reductions in line with the SDS, the intensity is likely to remain above society

Exhibit 19 shows the companies' scope 1+2+3 carbon intensity (calculated dividing their total emissions by their scope 3 energy volumes), which is the best approximation available of their well-to-wheel carbon intensity, in our view. Exhibit 20 shows the carbon intensity that the companies could achieve by 2030, including all the low-carbon initiatives that we estimate they may implement in the coming decade. We calculate these according to the scope 3 disclosure that each company utilises, although this may change in the future. The calculation based on product sales gives many more potential strategic levers to reduce carbon intensity than the disclosures based on production or refining throughput. This is why companies like Repsol, BP, Equinor and ENI (that use the production and refining outturn method) end up at the top of the scale in Exhibit 20. A second observation is that although Big Oils can achieve a percentage reduction in intensity in line with society's aim to stay within 2°C of global warming, the intensity is likely to remain above the average for society, due to the different energy mix (no hydro/nuclear, business mix gearing towards oil).

Exhibit 19: Big Oils product mix implies that they have a higher well-to-wheel carbon intensity than the broader economy...

Scope 1+2+3 GHG intensity by company (2017), vs IEA scenarios (2017 CPS, 2030E CPS/NPS/2DS).
19. Big Oils product mix implies that they have a higher well-to-wheel carbon intensity than the broader economy.... Data available on request.
Source: Company data, Goldman Sachs Global Investment Research, OECD/IEA 2017 World Energy Outlook, IEA Publishing

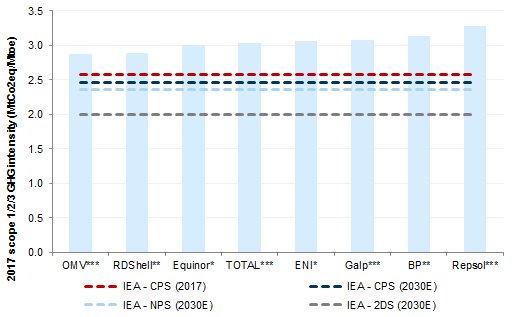
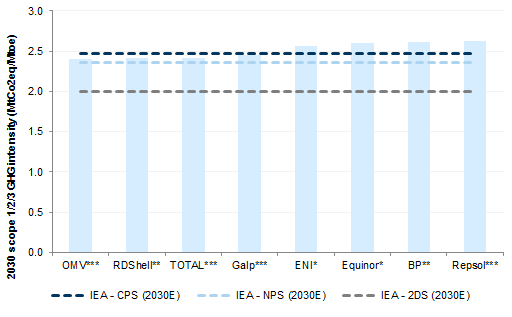
Exhibit 20: ...while the bigger improvements are likely to be achieved by companies with a large marketing business

Scope 1+2+3 GHG intensity by company (2030), vs IEA scenarios (2030E CPS/NPS/2DS).
20. ...while the bigger improvements are likely to be achieved by companies with a large marketing business. Data available on request.
Source: Company data, IEA, Goldman Sachs Global Investment Research, OECD/IEA 2017 World Energy Outlook, IEA Publishing

High GHG emissions in the oil & gas industry are driven by oil exposure, especially in oil sands, mature fields and West Africa

Exhibit 22 shows the carbon emission intensity of different fuels. As Big Oils become Big Energy, they are likely to reduce investment in the products that fall on the right, and increase those on the left. Coal (already fully exited by Big Oils in 2015), Canadian Oils Sands (partially exited), mature fields and parts of the West African business with unreliable gas infrastructure are likely to fall under heavy scrutiny and be potentially divested in the coming years. On the other side, LNG, pipeline gas, petrochemicals, biofuels and renewables are likely to see an increase in the share of investments.
Exhibit 21 shows the average scope 1 carbon emissions of the key production areas: Saudi oil stands out for the lowest carbon emission of any oil production worldwide, while Canadian heavy oil and West Africa show a high level of carbon emissions. LNG and Biofuels are also quite carbon intensive on a scope 1/2 basis, but score well on a well-to-wheel basis owing to low scope 3 emissions.

Exhibit 21: Saudi Oil stands out for the lowest carbon intensity in oil ...

Scope 1 GHG emissions intensity for different development types
21. Saudi Oil stands out for the lowest carbon intensity in oil .... Data available on request.
Source: Goldman Sachs Global Investment Research

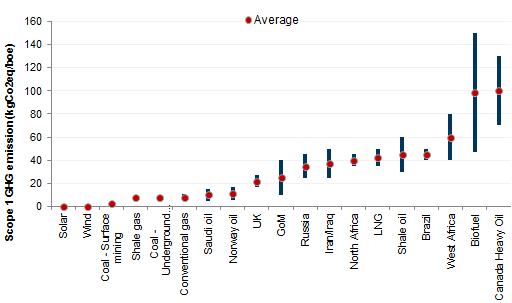
Exhibit 22: ...while gas has the lowest intensity at consumption

Scope 3 GHG emissions intensity for different product type
22. ...while gas has the lowest intensity at consumption. Data available on request.
Source: IPCC, Goldman Sachs Global Investment Research
In Exhibit 23 below, we show the average lifecycle GHG intensity (from extraction to consumption) for renewables, coal and the main oil & gas development types. Upstream GHG intensity is based on the analysis shown in Exhibit 21. For the refining GHG intensity, emissions will vary depending on various parameters including the crude API of the specific oil development type; the heavier the crude (lower API), the higher the GHG emission intensity to refine it. Finally, consumption GHG intensity was calculated based on refined products produced from the crude, and the GHG emissions associated with their respective combustion (Exhibit 22).

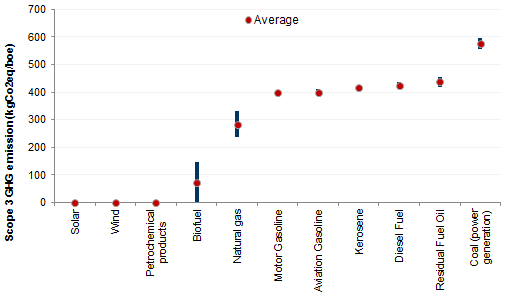
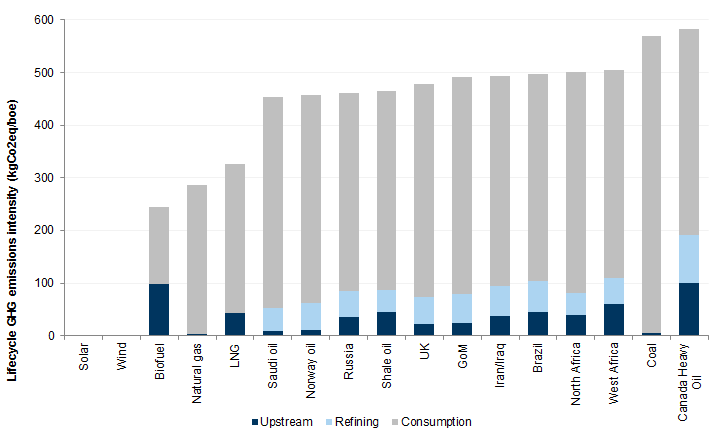
Exhibit 23: Coal and Heavy Oil are the most carbon-intensive products on a lifecycle basis, generating c.2x more GHG emissions than natural gas and LNG

Lifecycle GHG emissions intensity by winzone/product type in kgCO2eq/boe
23. Coal and Heavy Oil are the most carbon-intensive products on a lifecycle basis, generating c.2x more GHG emissions than natural gas and LNG. Data available on request.
Source: IPCC, Company data, Goldman Sachs Global Investment Research

The path to de-carbonization can yield higher returns

Tight financing, financially stranded assets and a more concentrated industry structure to lift Big Oils returns in the low carbon age

The initial reaction of investors when they think about the low carbon transition for Big Oils is that it will entail lower corporate returns and higher capex. We believe that this conclusion ignores some key dynamics of the low carbon transition (tighter financing for hydrocarbon projects, a more concentrated group of developers for mega-projects, financially stranded assets) and we come to the opposite conclusions: Big Oils will see improving returns in their path to become Big Energy.
We agree that the investments in renewables will have lower unlevered returns than Big Oils' core businesses. We make the conservative assumption that Big Oils will consolidate all the low carbon capex (unconsolidated project finance being an alternative) and that the unlevered returns will be 5% (in renewables, CCS and natural sinks). This will dilute Big Oils' corporate returns by c.100 bp in the coming decade. However, this returns dilution is more than counterbalanced by the improved competitive environment in the core businesses of oil, gas, LNG and refining. As we argue in the last section of the report, the low carbon drive of investors and financial institutions is drying up financing for major long-cycle oil & gas projects and is leading to the re-emergence of the 'Seven Sisters' oligopoly in new hydrocarbon mega-project developments. We have looked into our Top Projects database at the returns on new projects in the 2003-14 period (an age of expansion for the sector, characterised by fierce competition, cost inflation and project delays) vs. the returns available today on pre-sanction projects (with a more consolidated group of developers, better tax terms and strong supply chain management). On our estimates, returns available today are c.5% higher than in the past decade. As 70%+ of the capex is still invested in these areas, this contributes a c.400 bp corporate returns accretion, which more than balances the lower returns in renewables and other emerging low carbon technologies.

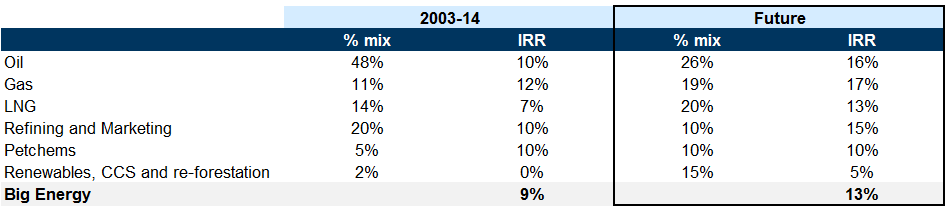
Exhibit 24: The path to de-carbonization can yield higher returns, once we take into account the market structure changes

Big Energy % energy portfolio mix and IRR in 2003-14 and in the 'Future'
24. The path to de-carbonization can yield higher returns, once we take into account the market structure changes. Data available on request.
Source: Company data, Goldman Sachs Global Investment Research

Big Oils rise again as the industry consolidates

Capital availability has changed materially over the past 10 years, with credit facilities available to E&Ps and NOCs substantially curtailed, as financial institutions reduce their exposure to long lead time oil & gas projects. With shrinking funding availability, most companies have stopped developing giant complex projects since 2014, allowing the new Seven Sisters to regain industry leadership as consolidation unlocks better fiscal terms, cheaper access to undeveloped resources, a more reliable global oil services supply chain and higher returns, as argued in our Top Projects 2018 report.

Exhibit 25: Capital availability for independent oil & gas producers has shrunk materially...

EU E&Ps total amount raised through credit facilities / bank loans, $ bn
25. Capital availability for independent oil & gas producers has shrunk materially.... Data available on request.
Source: Bloomberg

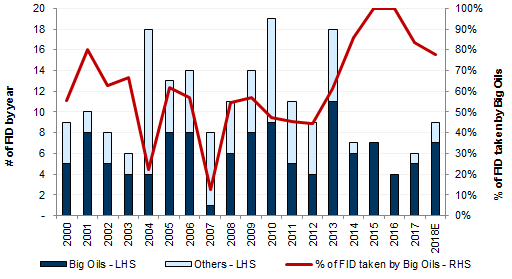
Exhibit 26: ...pushing the industry to consolidate, with FIDs taken back into the hands of the 'Seven Sisters'

FIDs taken by year (Top Projects)
26. ...pushing the industry to consolidate, with FIDs taken back into the hands of the 'Seven Sisters'. Data available on request.
Source: Company data, Goldman Sachs Global Investment Research

Underinvestment in oil mega-projects is likely to be structural and will impact production after 2020

Since 2014, NOCs have retreated to their domestic basins and are more focused on gas, while E&Ps globally are focusing on short-cycle projects or struggle to find financing for long-cycle projects. As a result, a number of project FIDs have been delayed, translating into 5.6 mb/d of lost oil production by 2025 (Exhibit 28). This change in the industry's financing is likely to become structural in this new Age of Restraint and lead to a material deceleration in non-OPEC oil production growth (Exhibit 27).

Exhibit 27: Projects sanctioned in 2011-14 currently deliver steady production growth through 2020...

YoY oil production growth (kboe/d) from non-OPEC, excluding shale projects
27. Projects sanctioned in 2011-14 currently deliver steady production growth through 2020.... Data available on request.
Source: Goldman Sachs Global Investment Research

Exhibit 28: ...but FIDs postponements leave a 5.6 mn b/d oil production shortfall by 2025

Top Projects 2018 lost offshore and onshore oil production from long-cycle developments; 2018 vs 2014 expectations in mn b/d
28. ...but FIDs postponements leave a 5.6 mn b/d oil production shortfall by 2025. Data available on request.
Source: Goldman Sachs Global Investment Research

The key levers of lower reported carbon emissions in more detail

Scope 1/2: Improvement in efficiency in operated assets will drive most of the GHG emissions reduction

Scope 1 GHG emissions are associated with Big Oils' operations across divisions, from upstream to downstream, based either on an equity or operated basis. As previously highlighted, we have assessed six main initiatives that can lower carbon footprint, which on aggregate could lead to a 24% GHG emissions reduction. Improvement in operational efficiency on operated assets represents the largest driver (helped by the sale of higher carbon mature assets), closely followed by the potential exit from carbon-intensive oil sands operations, reduction in flaring and methane emissions, and a broader shift from oil towards gas production.

Exhibit 29: We believe scope 1 and 2 emissions can be lowered on aggregate by 24% by 2030

GHG reduction initiatives on scope 1 and 2 by company (MtCo2eq)
29. We believe scope 1 and 2 emissions can be lowered on aggregate by 24% by 2030. Data available on request.
Source: Company data, Goldman Sachs Global Investment Research
Oil and Gas Climate Initiative (OGCI): a Big Oils-led initiative leading coordinated action on CCUS technologies, flaring and methane emission reductions
The Oil and Gas Climate Initiative (OGCI) is a voluntary Big Oils-led initiative, launched at the September 2014 UN Climate Summit, committed to the direction set out by the Paris Agreement on climate change. The OGCI aims to act as a catalyst for wider investment by individual companies, by (1) collaborating and sharing knowledge on climate change, (2) investing in technologies to combat it, and (3) setting emissions targets for members to follow. Members include BP, ENI, Equinor, Pemex, Petrobras, Repsol, Saudi Aramco, RDShell and TOTAL. ExxonMobil, Chevron, Occidental Petroleum and CNPC recently joined the organisation. All members contribute $100mn to the OGCI investment fund, and pledge to abide by all targets set.
In 2016, a $1bn+ investment fund (OGCI Climate Investments) was initiated to invest in technologies, projects and business solutions with the ambition to deliver >1GtCO2eq avoidance per annum by the end of the fund's 10-year life, with investments focusing on three main objectives: (1) reducing methane leakage, (2) reducing carbon dioxide, and (3) recycling carbon dioxide (CCUS). Since it became operational, eight investments have been made including investment into three emerging CCUS technologies, in which OGCI aspires to become a major contributor.
A recent initiative was to set its first collective methane target. Signing members have committed to reduce methane intensity (upstream methane emissions over gas sold) to below 0.25% by 2025, with an ultimate ambition to reduce this intensity to 0.20%. From a baseline of 0.32% in 2017, reaching the target would translate into a collective methane emissions reduction of >30%, equivalent to 600mn t of methane annually by 2025.

Scope 3: A broad range of initiatives available, from renewables to natural sinks

Scope 3 GHG emissions are predominantly related to the fuel combustion by end users, after Big Oils have sold them the products. Therefore, the main initiatives available to lower carbon intensity relate to product shifts and carbon sequestration/natural sinks. In particular, we have assumed that Big Oils can deliver the following:
  1. Increase petrochemical capacity by 5% vs. refining output.

  2. Build an integrated value chain in power, with power sales equivalent to 10% of energy sold, assuming 50% is fuelled by CCGT plants (gas-fired) and 50% by renewables (wind, solar).

  3. 1% per annum production shift to gas from oil, with max 65% gas in the hydrocarbon mix.

  4. Carbon capture & natural sinks, assuming they can offset 5% of total CO2 emitted.

  5. Increase the share of biofuels in the refined products sale mix by 10%.

We note that the GHG accounting benefit from the full set of initiatives could only be enjoyed by companies that follow the final product sold methodology for scope 3 GHG emissions calculation, and even then not all of them include petrochemical products in the calculation. The companies that calculate scope 3 on refined product sales or on upstream production can only benefit from some of these initiatives, as signalled by the grey area in the table below. For RDShell, BP, Equinor and ENI (highlighted in grey below), we have assumed 5% of renewable built as part of the energy production mix, while for the companies that calculate scope 3 on product sales, we have given them the benefit of selling 10% of power as a % of total final sales (of which we assume half is sourced from third party).

Exhibit 30: Accounting for the current scope 3 methodologies adopted by EU Big Oils, we believe GHG emissions could be lowered by 17% by 2030 on aggregate

GHG reduction initiatives on scope 3 by company (MtCo2eq)
30. Accounting for the current scope 3 methodologies adopted by EU Big Oils, we believe GHG emissions could be lowered by 17% by 2030 on aggregate. Data available on request.
Source: Company data, Goldman Sachs Global Investment Research

The five key levers of scope 3 emission reduction

1. Petrochemicals (-3% in GHG scope 3 emissions by 2030): Petrochemicals is a low carbon product of oil & gas and generates zero scope 3 emissions, as the carbon is sequestered in the material produced and does not get released into the atmosphere through a combustion process. It is not clear whether or not it should be considered in the calculation of the carbon intensity for Big Oils, given that it is not an energy product used for combustion. RDShell and TOTAL, for instance, have so far decided to exclude petrochemicals from their GHG emissions and carbon intensity calculations, given its non-energy usage. Whether or not petrochemical output is considered in the carbon intensity calculations, we believe that it will be an important part of Big Oils' low carbon strategy as a low carbon output of oil & gas feedstock. In this analysis, we assume that a 5% increase in petrochemical capacity (as % of refining outturn) for the group could lead to a c.3% reduction in scope 3 carbon intensity by 2030 (from 2017).
We list below global petrochemical players within our global coverage that could potentially provide a strategic fit with Big Oils, if they planned to pursue inorganic expansion, although this hasn't happened for the past decade, with the exception of the announced acquisition of a control stake in Sabic by Saudi Aramco. Instead, Big Oils have invested organically to grow their petrochemicals business, with material organic expansion plans for Exxon, TOTAL and Shell.

Exhibit 31: List of petrochemical companies and details on activities

Market cap as of 03/10/2018
31. List of petrochemical companies and details on activities. Data available on request.
Source: Bloomberg, Company data
2. Build an integrated power business (-6% in GHG scope 3 emissions by 2030)
Big Oils have always been vertically integrated in oil, from production to retail. We believe the coming decade will see them integrating vertically in gas and power, leveraging their brand and trading capabilities to acquire gas and power customers. We believe that this will entail the acquisition of low-cost utility 'challengers' in OECD countries where Big Oils have a material retail presence (Exhibit 33). We assume that power sales will end up constituting 10% of their energy sales by 2030, sourced 50/50 from gas-fired power plants and renewables. We also assume that half of the power generation will be in-house and half will be sourced from third parties. We estimate that the renewables build-up will absorb c.10% of Big Oils' capex in the coming years, assuming a load factor of 25%/35% for solar/wind, and costs reduction of 45%/27% by 2030 (from the 2017 base).

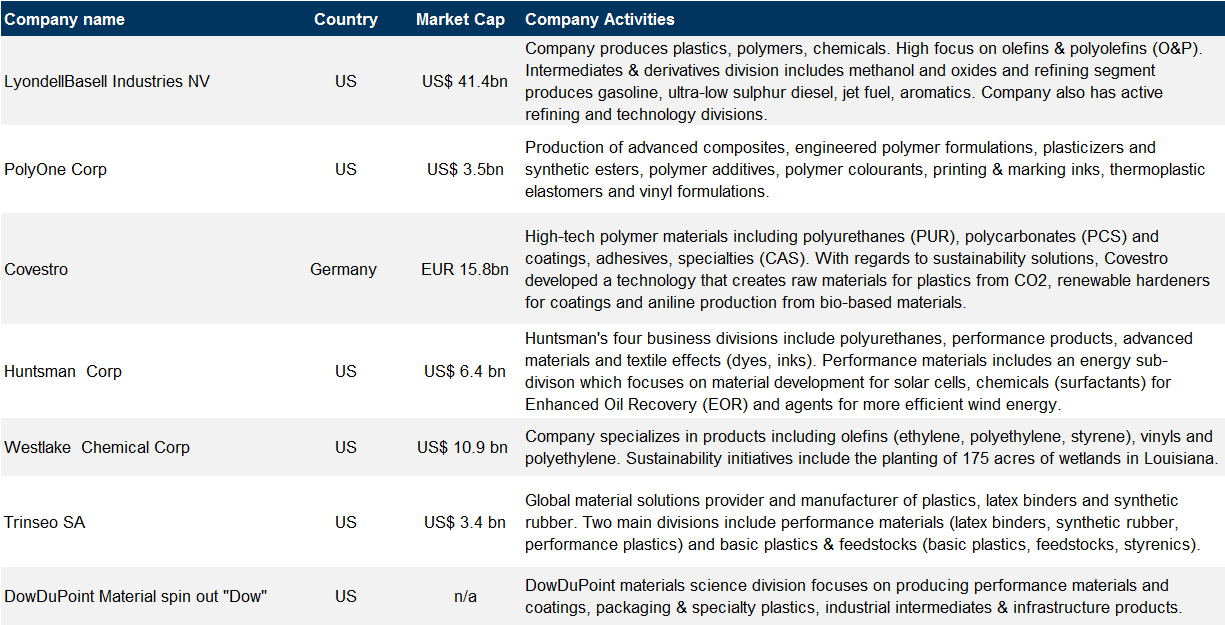
Exhibit 32: We believe EU Big Oils will allocate c.10% of their capex budget to renewables by 2030

Analysis on renewable capex needed for EU Big Oils
32. We believe EU Big Oils will allocate c.10% of their capex budget to renewables by 2030. Data available on request.
Source: Company data, Goldman Sachs Global Investment Research
Big Oils could opt for inorganic options to broaden their customer base, and progressively become more vertically integrated in gas and power. As highlighted above, building an integrated power business could help Big Oils lower GHG scope 3 emissions by 6% (from 2017). As of today, the most significant transaction was TOTAL's acquisition of Direct Energie (the third largest player in France after EDF and ENGIE), boosting its customer base from 1.5m to c.4m with the aim to reach 6-7m by 2022 (c.15% of market share). Below, we have compiled a list of independent electricity suppliers by country.

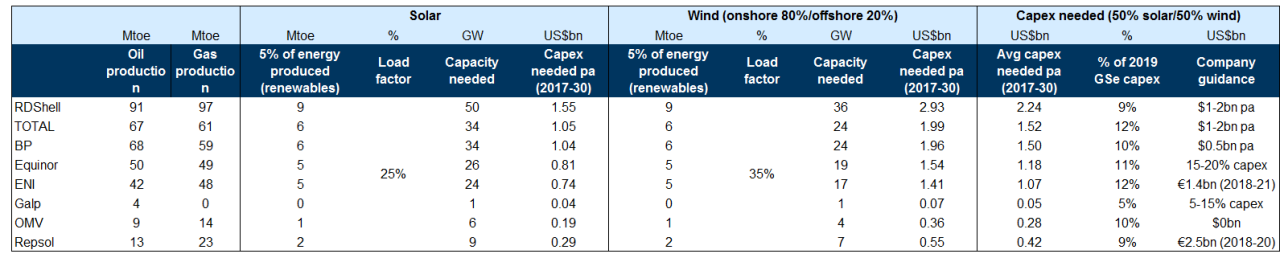
Exhibit 33: List of emerging 'challenger' electricity suppliers and market share in country, based on reported volumes of electricity supplied

*Based on 2016 data with the rest based on 2017
33. List of emerging 'challenger' electricity suppliers and market share in country, based on reported volumes of electricity supplied. Data available on request.
Source: ARERA, Selectra, Statistica, CMNC, Company data
Renewable energy: Wind and solar
Solar Photovoltaic (PV) uses solar panels (modules) to convert sunlight into electricity. These panels are made up of two back-to-back oppositely charged silicon solar cells. Since 2010, levelised costs of energy (LCOE) for large-scale solar PV have fallen by c.80%, and our Utilities team believes this will continue due to cheaper equipment costs, lower opex and better module efficiency (i.e. higher load factors). Cost reductions have resulted in vast discounts between solar PV LCOE and forward power curves across some regions in Europe (mainly Spain and Italy), suggesting compelling short-term economics for investment. Longer term, the team believes these trends in Europe are likely to continue, estimating 10%-25% reduction by 2023 and 30%-50% by 2030. Cheaper economics would in turn fuel sustained capacity growth.
Wind energy uses turbines to convert the kinetic energy of wind into electricity. The wind turns two or three propeller-like blades around a rotor (connected to a shaft) which spins a generator to create electricity. As highlighted by our Utilities analysts, Europe is seeing a fundamental shift in its power generation mix at a much faster pace than they previously expected. Beyond wind onshore and solar PV, wind offshore is expected to play a key role in this transition. They expect the decrease in costs for offshore (c.50% on average by 2030) to accelerate global installations to levels above previous expectations, with installed capacity increasing nine-fold through 2017-30E. As costs of wind offshore continue to decline – below the wholesale power price by 2028E - annual installations are expected to continue accelerating as dependency on subsidies fall. This, along with political support/subsidies, will, in their view, encourage an acceleration of offshore growth, with 2021-30E annual installations c.70% higher than through 2017-20E, focused in Europe (55%), with Asia (33% of installations) and the US (12% of installations) gaining market share.

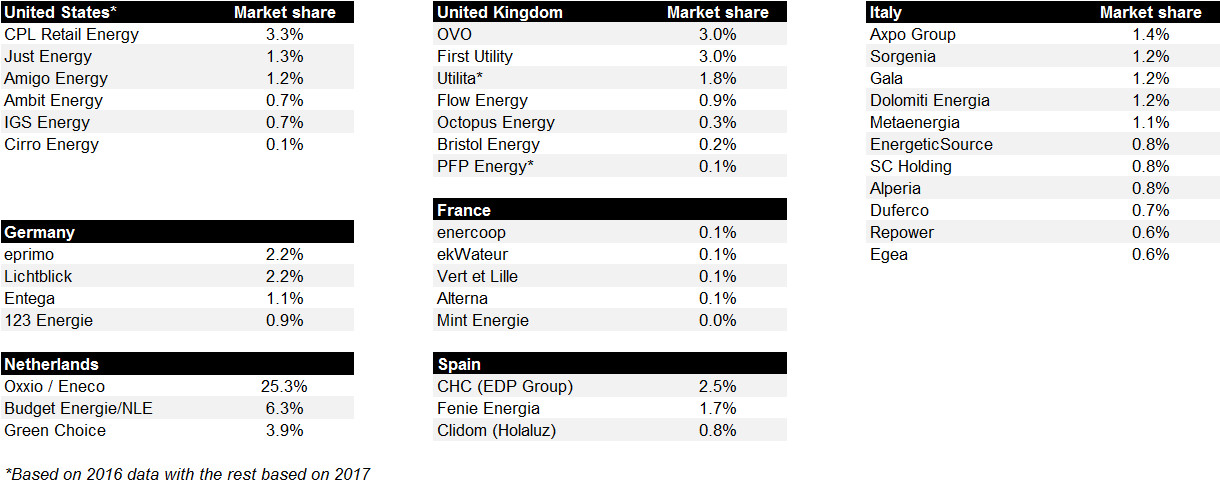
Exhibit 34: Spain's solar LCOE is c.45% below forwards and will keep declining

Spain: Solar PV LCOE evolution vs 2019 power forward, €/MWh
34. Spain's solar LCOE is c.45% below forwards and will keep declining. Data available on request.
Source: Bloomberg, IRENA, Goldman Sachs Global Investment Research

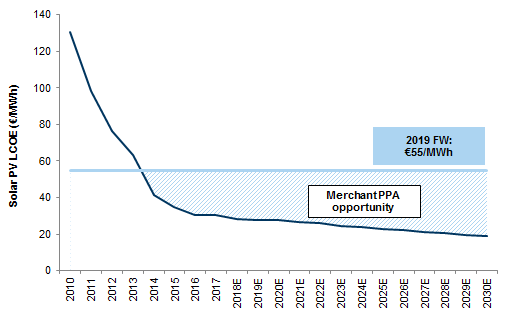
Exhibit 35: We expect costs for offshore wind to decrease by 80% by 2030E vs. 2016

LCOE – wind offshore and onshore vs. wholesale power prices
35. We expect costs for offshore wind to decrease by 80% by 2030E vs. 2016. Data available on request.
Source: Bloomberg, Goldman Sachs Global Investment Research
3. Shift in production from oil to gas (-3% in GHG emissions by 2030)
Big Oils' shift towards gas production started in 2000, as shown in Exhibit 36, driven by the growing importance of gas for industrial use and power generation and by the birth of a global LNG gas market. The recent policy shift in China towards a more environmentally friendly energy mix, with gas moving from c.6% to a targeted c.15% of the energy mix, is providing a further push to global gas, and specifically LNG demand. Big Oils have a major role to play in LNG, due to the complexity and capital intensity of the plants and economies of scale on both production and marketing. We expect Big Oils to accelerate the pace of LNG project FIDs in the coming years, with gas and LNG projects set to represent >70% of their Top Projects reserves sanctioned in 2018/19.
Gas projects have the advantage of being less carbon intensive than oil (c.300 vs. c.490 kgCO2eq/boe) and we believe that Big Oils will facilitate the shift from coal to gas globally, with a larger presence in LNG production, transportation and marketing. Big Oils' global scale and risk management provides them with a clear competitive advantage at a time when utilities customers are more reluctant to sign long-term contracts and project financing becomes more difficult for smaller players to obtain.

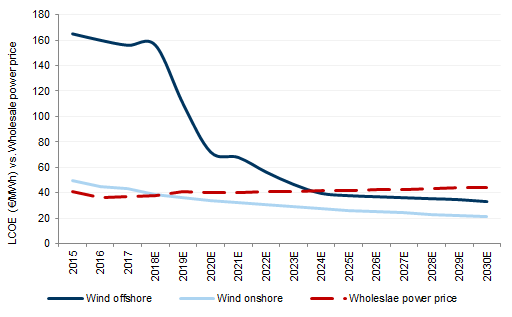
Exhibit 36: Gas has been a growing part of Big Oils' energy mix, now at c.45% of total production

Seven Sisters gas exposure (as % of total oil and gas production)
36. Gas has been a growing part of Big Oils' energy mix, now at c.45% of total production. Data available on request.
Source: Company data, Goldman Sachs Global Investment Research

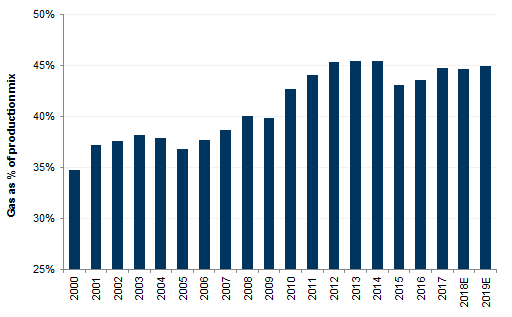
Exhibit 37: After 4 years of under-investments, we are entering a new LNG construction phase

Top Projects reserves sanctioned by the 'Seven Sisters' (RDShell, BP, TOTAL, ENI, Equinor, ExxonMobil, Chevron)
37. After 4 years of under-investments, we are entering a new LNG construction phase. Data available on request.
Source: Company data, Goldman Sachs Global Investment Research

There is a gap in LNG supply growth in 2020-23, signalling an incoming tight market

We are coming towards the end of the delivery of the record number of LNG FIDs in 2011-14, with the final wave of LNG projects set to come on-stream in 2018-19. Although this record wave of LNG supply was a concern, the shift in Chinese environmental policy from coal towards gas is having a comparable impact on global LNG demand as the Fukushima nuclear incident had in 2011. We believe that the LNG market will become increasingly tight until a new wave of LNG projects start to come onstream in 2023.

Exhibit 38: We are coming towards the end of this wave of LNG supply growth...

LNG volume additions in mtpa by country
38. We are coming towards the end of this wave of LNG supply growth.... Data available on request.
Source: Goldman Sachs Global Investment Research

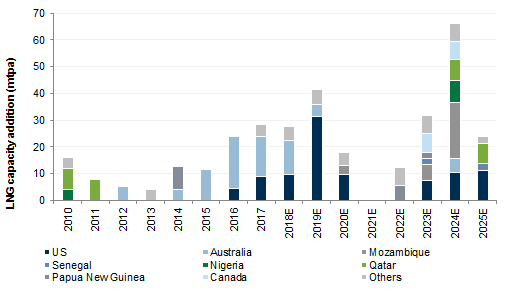
Exhibit 39: ...with the second wave to add capacity from 2023, although still largely uncommitted

LNG volume additions in mtpa by development status
39. ...with the second wave to add capacity from 2023, although still largely uncommitted. Data available on request.
Source: Company data, Goldman Sachs Global Investment Research
Within EU Big Oils, we see RDShell as best positioned to benefit from increasing LNG demand: it has the largest share of LNG production capacity to total group production (>15% of 2017 reported figures, with twice that level of LNG marketed). Equinor and ENI have the smallest exposure within the group. All the companies have a material pipeline of new LNG projects to sanction, with the exception of Chevron and Equinor.

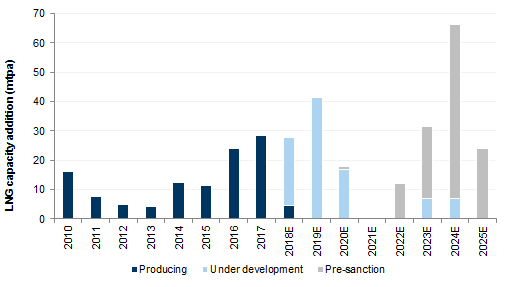
Exhibit 40: RDShell is the most exposed to LNG both in absolute terms and as a % of its total production

LNG production capacity (producing, under dev.) and as % of 2017 total oil & gas production by company
40. RDShell is the most exposed to LNG both in absolute terms and as a % of its total production. Data available on request.
Source: Company data, Goldman Sachs Global Investment Research
Companies exposed to the LNG supply chain, as we enter a new LNG construction bull market
Below is a simplified overview of the LNG supply chain. We have split the Processing & Liquefaction and the Regasification & Storage phases between onshore and offshore given that the infrastructure requirements differ. The companies which have exposure to the different phases included in the below chart are both GS covered and uncovered public or private.

Exhibit 41: GS covered and non covered companies (both public and private)

41. GS covered and non covered companies (both public and private). Data available on request.
Source: Goldman Sachs Global Investment Research
4. Carbon capture and storage (CCS) and natural sinks (-5% in GHG emissions by 2030)
So far we have looked at initiatives to reduce gross carbon emissions, but another important element to reduce net carbon emissions will be carbon capture & storage and natural sinks, such as reforestation. Among Big Oils, RDShell and TOTAL highlight the important role that natural sinks could have in reducing their long-term net carbon emissions.
RDShell has a 10% stake in the Quest CCS project in Canada, which has captured and stored >1mtCO2 in 2017. Equinor captured and stored 1.35mtCO2 in 2017 at its Sleipner and Snøhvit fields in Norway, with c.22mtCO2 to date. TOTAL is targeting to spend up to 10% of its overall R&D budget ($0.9bn in 2017) to research into the CCUS technology. ExxonMobil is conducting proprietary research and captured in 2016 around 6.3MtCO2 for storage.
CCS at this point in time still appears expensive relative to other low carbon technologies, at around $100 per ton of CO2 avoided. This compares with an estimated cost of c.US$10-20 per ton of CO2 avoided through natural sinks (i.e. reforestation, aforestation); this is calculated using an average CO2 sequestration by tree factor (EPA), across the life of the tree life. We note that the re-forestation carbon capture impact starts to be material as we approach the second half of a tree's life and is minimal in the first years.
The estimated cost of employing CCS depends on the type of plant where the technology is adopted, with natural gas processing, ammonia and bio-ethanol production plants being the lowest cost applications and iron, steel and cement the highest. The main differentiation in costs arises from the capture of CO2 emissions, with the cost of transport and storage costs being substantially lower and more consistent across applications.
Carbon Capture and Storage (CCS)
Carbon dioxide capture and storage (CCS) underlines the utilization of a vast range of technologies and processes designed to capture the majority of CO2 emissions from large industrial point sources and store it. CCS is commonly also referred to as CCUS (Carbon Capture, Use and Storage), indicating further utilization in addition to the capture of CO2. Although the technology remains as of today at a pre-commercial stage, CCS technologies provide some of the most promising solutions to the global climate change and global warming problem.
The CCS chain constitutes processes that can be broadly categorized into three major parts:
  1. The separation and capture of CO2, from gaseous emissions to achieve a high purity stream, achievable through industrial techniques typically classified as pre-combustion, post-combustion and oxy-fuel capture.

  2. The subsequent transport of captured CO2, from its production site to suitable geological formations for storage. Typically transport occurs through pipelines.

  3. The storage of CO2 through various forms, primarily in deep geological formations which may be former oil & gas fields, saline formations or depleting oil fields. When CO2 is injected into an oil field to recover oil reserves, the method is known as Enhanced Oil Recovery (EOR). Ocean and mineral storage options also exist.

The major concern associated with CCS is the potential leakage and its subsequent resurfacing which would impair the overall effectiveness of its confinement while potentially damaging aquatic ecosystems. As a result, risk assessments of potential leakage sources should be conducted for all major projects.
Currently, there are 16 large-scale CCS projects operating globally with a combined capture capacity of 36 MtCO2eq per annum. Given the potential effectiveness of CCS in capturing CO2 emissions that would have otherwise been added to the atmosphere, companies can utilise the technology to meet their targets and the SDS.
5. Biofuels (-3% in GHG emissions by 2030)
Big Oils' exposure to biofuels includes both production and purchase of biodiesel and bioethanol. Regulation plays an important role in the biofuel industry, with legislation such as the US Renewable Fuel Standard (RFS) providing a market for an otherwise costly product - the RFS has set a target c.11% blend as % of total fuel sold (c.20bn gallons of biofuels blended in products) for 2019, while the EU legislation has set a 14% target by 2030.
RDShell has the largest exposure to biofuel with 0.76mn t of biofuel produced in its Raizen site, and additional purchases leading to a total of c.6mn t of biofuel blended in fuel sold in 2017 (c.3% of refining outturn). TOTAL similarly has relatively high biofuel exposure, with c.2.3mn t incorporated into diesel and gasoline fuels sold in 2017 (c.2% of refining outturn). Galp and OMV are similarly positioned (2%), with OMV purchasing c.0.6mn t of biofuels in 2017, and Galp leveraging purchases and its palm oil project in Brazil to incorporate a total of c.0.36mn t in 2017.
Future biofuel targets involve a focus on increasing production capacity. ENI is delivering on an ambitious expansion plan to reach 1+ mn t of biofuel production by 2021, helped by the ramp-up of the Venice and the start-up of Gela (0.75mn t) green refineries. TOTAL's start-up of la Mede adds 500kt of capacity in 2018. Galp, on the other hand, sets a target of incorporating 10% biofuels in gasoline and diesel by 2020. We assume that the group can increase its share of biofuels in the oil product mix by 10% by 2030, through a mix of third-party sourcing and equity production. 'NA' in the table below refers to companies that do not disclose both volumes.

Exhibit 42: On average, Big Oils' exposure to biofuels (2% of refining outturn) is still relatively small

Global Big Oils' exposure to biofuels, and as % of refining outturn/capacity when available
42. On average, Big Oils' exposure to biofuels (2% of refining outturn) is still relatively small. Data available on request.
Source: Company data, Goldman Sachs Global Investment Research
Biofuels
Biofuels are fuels produced from organic feedstock, in which CO2 emitted from fuel consumption is offset by that sequestered during feedstock growth, and are as a result considered to be low carbon emitters on a lifecycle basis. The wide range of available organic feedstocks gives rise to many different biofuels, and so emissions savings are also variable - we adopt the EU legislative definition for biofuel, in which at least 50% of emissions savings must be achieved when compared to conventional fuels.
Biofuels are categorised into three different classes: 1st, 2nd, and 3rd generation, with 1st generation referring to biofuels manufactured from food feedstocks, 2nd from agricultural residues or non-food feedstock, and 3rd from algae. 1st generation biofuels currently represent >75% of biofuels blended in transport fuels in the EU, with the main risk related to food supply. Recent technology advancements allowed for the development of 2nd generation biofuels, which use agricultural residues or non-food feedstocks. The EU legislation (RED II) has capped 1st generation fuel blend to 7% of the 2030 14% blend target (2017 blend at c.4.2%), leaving the bulk of demand growth for 2nd generation biofuels (2017 blend c.1.2%). 3rd generation biofuels (derived from algae) are not yet seen as a direct competitor, since the production methods are not yet scalable. ExxonMobil is currently working on this issue, and partnered with Synthetic Genomics with the goal of producing 10k barrels of algae biofuels a day by 2025.
Hydrotreated Vegetable Oil (HVO)
Hydrotreated Vegetable Oil (HVO) is a form of 2nd generation renewable diesel produced from treating vegetable oil and animal fat, and has lower emissions and better engine properties than traditional biodiesel. Neste is as of today the world's largest producer of renewable diesel (HVO) with c.60% of market share. HVO renewable diesel is chemically near identical to fossil diesel, and there is therefore no limit to how much can be blended - previous biofuels had a 'blend wall', where additional biofuel blend would negatively affect engine performance. One of the key differentiator is that, as opposed to previous esterification produced biofuels, HVO uses hydrogen as a catalyst in much the same way as traditional fuel - the refinery infrastructure costs are therefore highly reduced, with existing refining units being feasibly adapted.

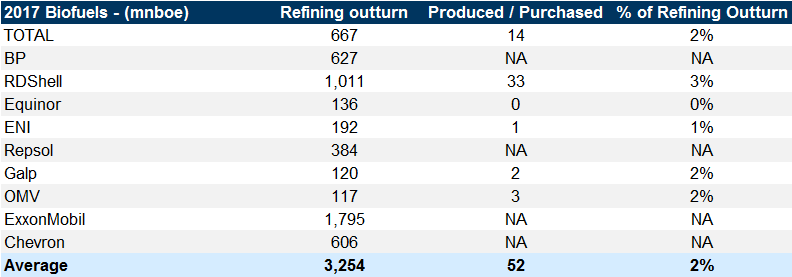
Exhibit 43: HVO is growing fast...

EU HVO production (LHS) and as % of 1st and 2nd generation biodiesel production
43. HVO is growing fast.... Data available on request.
Source: United States Department of Agriculture

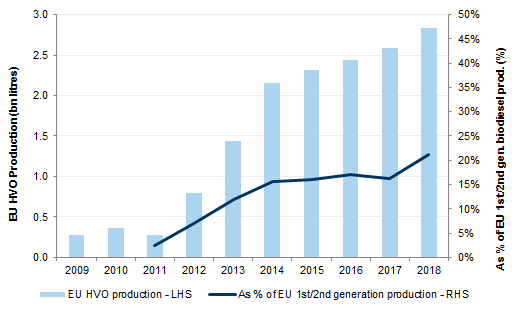
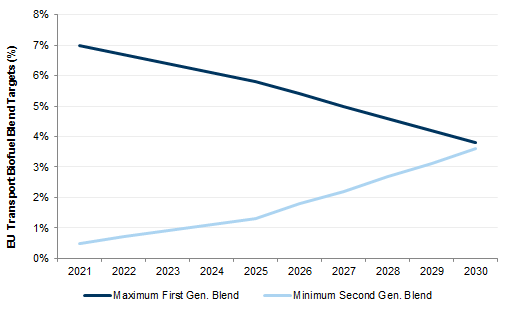
Exhibit 44: ...supported by favourable legislation in the EU

EU transport biofuel target on the blending of conventional biofuels (RED II)
44. ...supported by favourable legislation in the EU. Data available on request.
Source: European Commission

A clear de-carbonization strategy should help Big Oils address the concerns of the fossil fuel divestment movement

Big Oils can meet the IEA 2DS, with a cleaner and more profitable portfolio

The fossil fuel divestment movement is gathering pace, with the number of institutions divesting coal investments up five-fold over the past four years. We believe that it is very important for Big Oils to lay out a strategy towards becoming Big Energy, with a carbon intention path consistent with a 2° C scenario, in order to avoid the divestments and de-rating that the coal sector has experienced over the past five years. Launched in November 2017 by the Canadian and UK governments, the Powering Past Coal Alliance aims to 'advance the transition away from unabated coal power generation'. The organization now counts 74 members, including 28 national governments, 18 subnational governments and 28 companies. In addition to this, we've noticed that a growing number of investors and financial institutions have announced bans or restrictions on coal investments, particularly from 2013, which have in our view been a driver of the sector de-rating over the past five years.

Exhibit 45: As a growing number of institutions pledge to exit coal investments, the EV/EBITDA multiple for coal stocks contracted

Number of divesting institutions (LHS) vs Coal stock EV/EBITDA (c.20% of global coal production)
45. As a growing number of institutions pledge to exit coal investments, the EV/EBITDA multiple for coal stocks contracted. Data available on request.
Source: FactSet, DivestInvest, 350.org
The quotes that follow are taken from press releases issued by the respective institutions over the past two years.
Norges: "The Ministry of Finance introduced a product related criterion under the Guidelines for observation and exclusion from the Government Pension Fund [...] The criterion states that coal power companies and mining companies who themselves, or through other operations they control, base 30 percent or more of their activities on coal, and/or derive 30 percent of their revenues from coal, may be excluded from the GPFG. Coal in this case refers to thermal coal."
Zurich Insurance Group: "The company will divest from equity holdings in companies that derive more than half of their revenues from mining thermal coal, or utility companies that generate more than half of their energy from coal. It will not invest in new debt issued by such companies and will run off existing holdings."
AXA: "AXA decided two years ago to divest Euro 500 million from the coal industry by targeting companies which derive over 50% of their revenues from coal. Today, the Group decided to increase its divestment fivefold to reach Euro 2.4 billion, by divesting from companies which derive more than 30% of their revenues from coal, have a coal-based energy mix that exceeds 30%, actively build new coal plants, or produce more than 20 million tonnes of coal per year."
ING: "ING has decided to accelerate the reduction of our financing to coal power generation, reducing our exposure to close to zero by 2025.", "By the end of 2025, we’ll no longer finance clients in the utilities sector that are over 5% reliant on coal fired power in their energy mix. We will however continue to finance non-coal energy projects for these clients in support of their energy transition."
Deutsche Bank: "The bank has revised its approach to coal financing and amended its guidelines governing coal power and mining. Deutsche Bank and its subsidiaries will not grant new financing for greenfield thermal coal mining and new coal-fired power plant construction. Moreover, the bank will gradually reduce its existing exposure to the thermal coal mining sector."
JP Morgan: "We will not finance transactions that involve asset-specific financing where the proceeds will be used to develop a new greenfield coal mine or a new coal-fired power plant in a high income OECD country."
HSBC: "HSBC will stop providing financing for new coal-fired power plants as part of its efforts to support a transition to a low-carbon economy."
Standard Chartered: "The Group is today announcing that, save where there is an existing commitment, it will cease providing financing for new coal-fired power plants anywhere in the world, following detailed consultation with a range of stakeholders."

Tight financing conditions create high barriers to entry; markets conditions favour the 'Seven Sisters'

Reserve-based lending (RBL) has historically been the financing option of choice for E&Ps and NOCs looking for finance for new long-cycle mega-projects. The largest providers of RBL in the 2004-09 period were the European banks, including French banks BNP Paribas/Credit Agricole, UK banks RBS/HSBC, and the Norwegian DNB. These banks have all substantially reduced their exposure to oil & gas over the past years and aim to further curtail exposure. Since 2014, Credit Agricole and RBS have reduced their lending exposure to the oil & gas industry from c.16% to c.5% and from c.6% to c.0.5%, respectively. ING, another major provider of reserve-based lending during the previous oil price upcycle, has lowered its oil & gas exposure since 2014 by c.5% to c.16% of its total lending credit.
BNP Paribas: "The BNP Paribas Group will no longer do business with companies whose principal business activity is the exploration, production, distribution, marketing or trading of oil and gas from shale and/or oil from tar sands."; "The Group will not finance any oil or gas exploration or production projects in the Arctic region."
Credit Agricole: "Crédit Agricole announced a review of its oil and gas sector policy. This review aims to exclude the financing of the least energy efficient and most environmentally hazardous hydrocarbons. This covers in particular all tar sands and extra heavy oil projects. The exclusion of offshore oil projects in the Arctic was also extended to onshore projects. Infrastructure primarily relating to such projects is also covered."
RBS: "If we’re going to support our customers in the long run, then it means addressing the challenge of climate change and the risks and opportunities it presents."
DNB: "There has been an intended reduction in corporate lending, particularly in "cyclical" areas such as oil and offshore."; "The structure of the market for large corporate lending was changing, with an "Americanized trend" toward greater use of bond financing rather than bank loans."
World Bank: “As a global multilateral development institution, the World Bank Group is continuing to transform its own operations in recognition of a rapidly changing world [...] The World Bank Group will no longer finance upstream oil and gas, after 2019.”

Appendix

This work is partially based on the carbon emission scenarios developed by the International Energy Agency, © OECD/IEA 2017 but the resulting work has been prepared by Goldman Sachs International and does not necessarily reflect the views of the International Energy Agency.

Appendix A

GHG emissions: direct or indirect?
GHG emissions are often categorised by companies under three main buckets:
  • Scope 1 (direct emissions) occurs from the companies' owned or operated assets, including flaring, venting and fugitive emissions from oil & gas production facilities.

  • Scope 2 (indirect emissions) refers to emissions from purchased and consumed energy including electricity to run companies' operations.

  • Scope 3 (indirect emissions), for the oil & gas industry, would refer to GHG emissions arising from the combustion of refined products; i.e. diesel, gasoline, kerosene among the most common fuel burned for transportation purposes.

Exhibit 46: Scope 1, 2 and 3 emissions segmented by business activities

46. Scope 1, 2 and 3 emissions segmented by business activities. Data available on request.
Source: World Resources Institute
Scope 3 calculation methodology:
* Based on E&P oil & gas production (Equinor, ENI)
** Based on refining outturn/capacity and gas volumes sold (RDShell, BP)
*** Based on oil & gas volumes sold to final customers (TOTAL, Galp, OMV, Repsol)

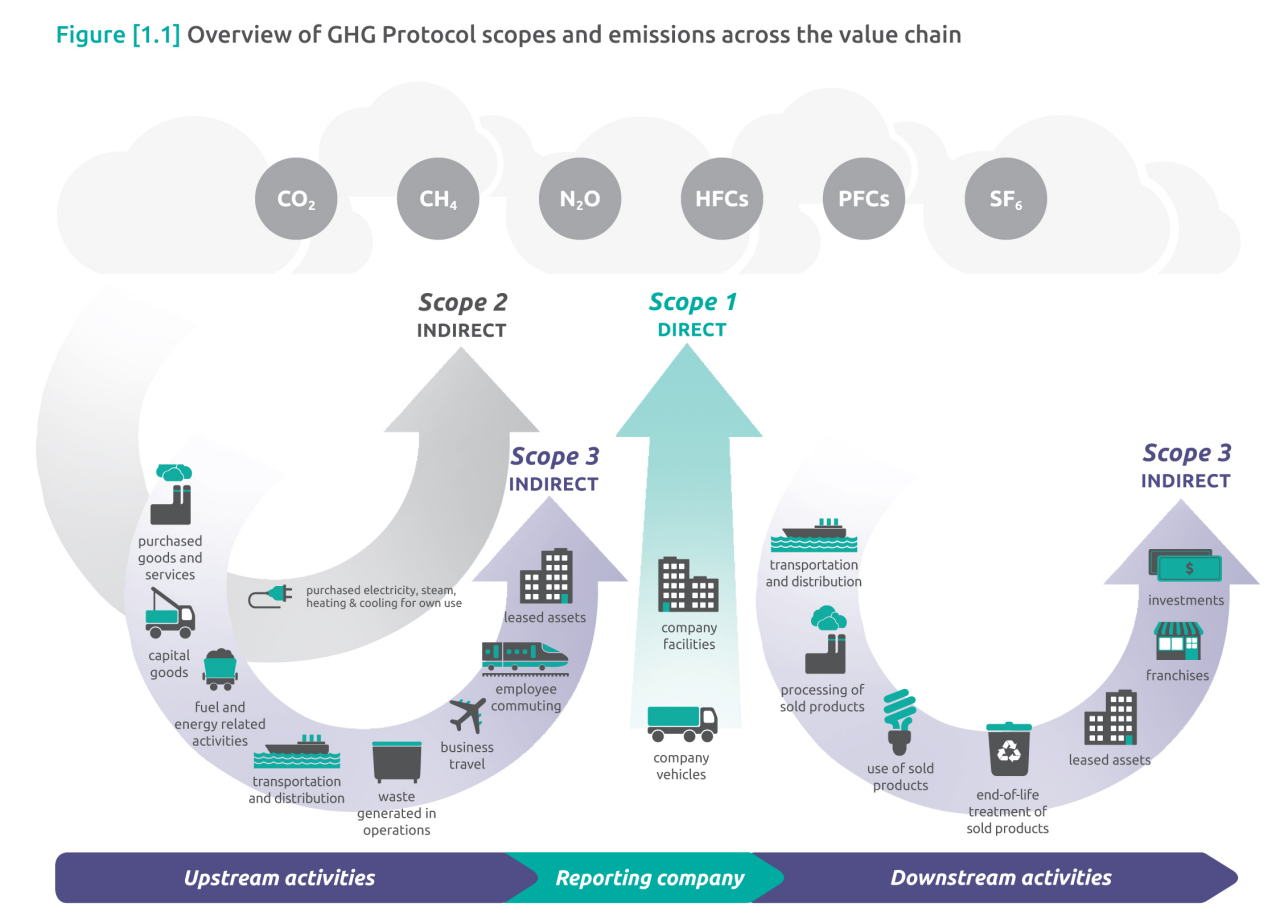
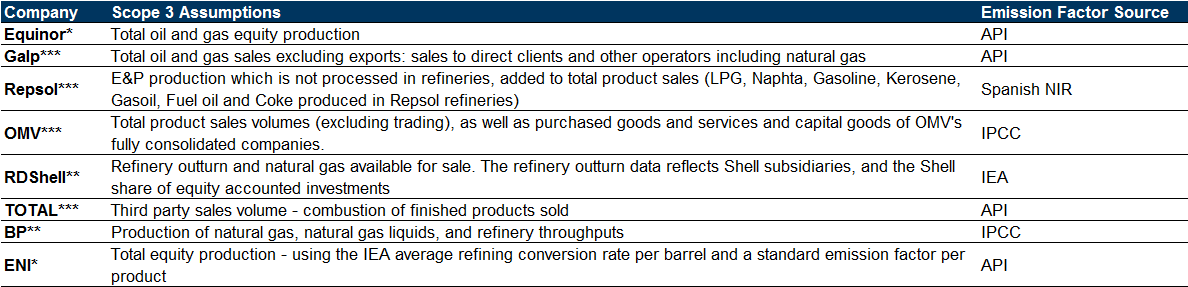
Exhibit 47: Scope 3 methodology by company

47. Scope 3 methodology by company. Data available on request.
Source: Company data, Goldman Sachs Global Investment Research

Appendix B

Carbon emission factors for Scope 3 refer to the carbon intensity of combustion for each product assuming complete oxidation. These were compiled from the two main sources referred to by companies when disclosing their Scope 3 emissions:
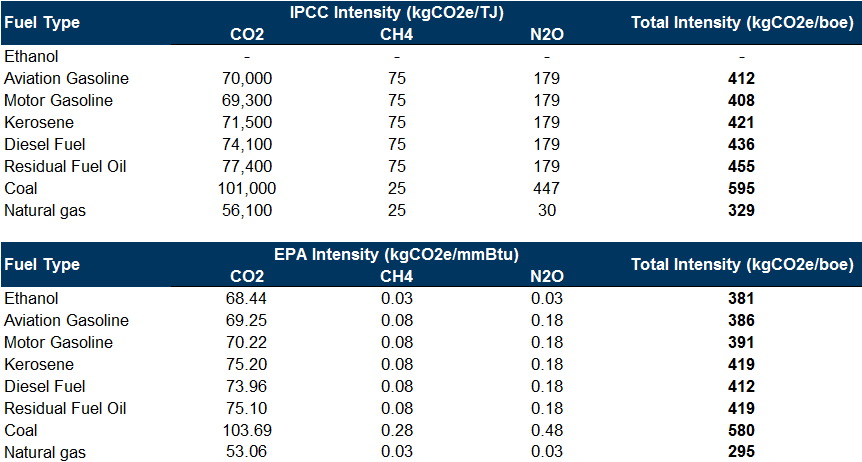
  • IPCC: The Intergovernmental Panel on Climate Change is a body set up under the guidance of the United Nations with the sole purpose of providing the world with a scientific view of climate change and its potential impacts. It provides a detailed library of emission factors both at an aggregate product level, and on a per activity basis.

  • EPA: The US Environmental Protection Agency is a federal government agency with the mission to protect human and environmental health. Under the AP-42 the agency discloses a compilation of accurate, up to date emission factors.

Exhibit 48: Carbon intensity by fuel type (from combustion)

48. Carbon intensity by fuel type (from combustion). Data available on request.
Source: IPCC, EPA

Appendix C

To define biofuel lifecycle (LCC) emissions, we followed EU sustainability criteria in which GHG savings vs. conventional fuels range from 50% in 2017 to 60% in 2018 (only for new production plants) – we remain conservative on our estimates, and define LCC savings as 50%. As a result, scope 3 emissions are provided as a range, with the floor value set to zero as specified in the 'International GHG inventory' methodology (see UK Department for Business, Energy & Industrial Strategy). Independent analysis on LCC emissions were contrasted with specifications from biofuel producer Neste, which confirmed a LCC carbon intensity range of 8 to 50 gCo2eq/MJ (47 to 293 kgCo2eq/boe), depending on the feedstock. In our report, we focus on the low end of the range given the improving carbon emissions benefits of biofuels.

Goldman Sachs does and seeks to do business with companies covered in its research reports. As a result, investors should be aware that the firm may have a conflict of interest that could affect the objectivity of this report. Investors should consider this report as only a single factor in making their investment decision. For Reg AC certification and other important disclosures, see the Disclosure Appendix, or go to www.gs.com/research/hedge.html. Analysts employed by non-US affiliates are not registered/qualified as research analysts with FINRA in the U.S.