Preface
Part 1: Enabling Disruption
The accelerating pace of disruption: the high-level theory
Exhibit 1: The new corporate production stack

Exhibit 2: How disentanglement reshapes industries and has resulted in the Everything-as-a-Service economy
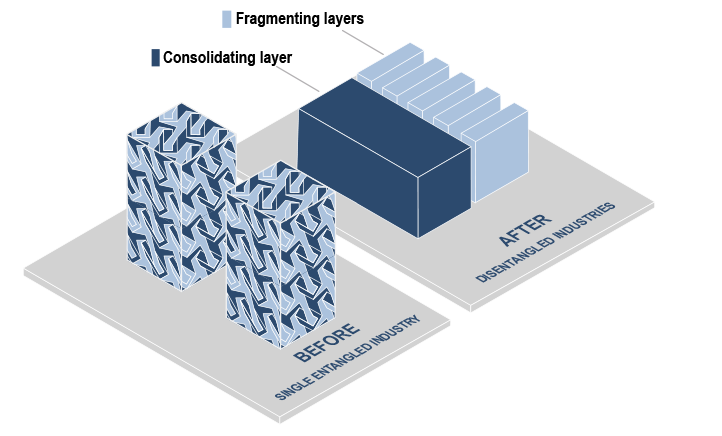
Five key observations about disentanglement
First, disruption is now more likely to result in the displacement of specific functions within a firm – rather than the displacement of a well-positioned firm as a whole. This is because well-positioned firms can rent what’s new to enhance their existing areas of strength or to expand into new areas. These dynamics help to explain why, despite the pick-up in the rate of disruption, the Everything-as-a-Service economy has not ushered in significant changes in terms of market leadership positions across many sectors. In other words, companies that have historically held top market share positions may still do just that – across many parts of the broader economy. Another contributing factor to this dynamic is that the firms that have emerged over the last two decades have largely entered market niches that did not exist before. To illustrate this point, consider which established companies Google, Facebook, or Stripe have disrupted, other than a few early entrants?
Second, from an economic standpoint, fragmentation is just as important as consolidation. The creation of finely-tuned products is typically done by specialty firms on a narrow basis, which largely exist in fragmenting layers. In comparison, the activities that gain efficiencies from being done at scale tend to exist in consolidating layers. In our view, neither one can exist without the other. Instead, they interact in mutually reinforcing ways.
Third, specialization is the new norm and many firms are likely to continue to refine their focus, though the nature of specialization may look quite different relative to the past. In the new business environment, successful firms often do less (not more) than their predecessors. Again, this is because in an environment where third-party services are used more often, firms can narrow their focus quickly. From the outside, many larger successful firms today do appear to have numerous business lines. But, when these firms are examined more closely – with an eye toward the areas where they are uniquely successful – a different story emerges: their differentiated business lines tend to be quite limited. Furthermore, by examining what is outsourced versus what is done in-house, it’s easier to see that successful firms often have relatively narrow areas of focus. Consider Amazon’s e-commerce business as an example of narrow specialization: Amazon covers an astronomical number of SKUs, but it is important only in categories of items that can be shipped in a box and delivered in a day or two.
Fourth, a firm’s area of competitive advantage may not necessarily be apparent or even linked directly to the products or services it sells or to its overall structure, and competitors can also be customers; this is a fundamental feature of the Everything-as-a-Service economy. Unlike in the past, businesses that seem to compete with each other today may in fact have little to no overlap in terms of their actual areas of competitive advantage; they may also rely on each other as customers. The Samsung, Apple and Google smartphone example that we touched on at the outset of this publication underscores this dynamic. What’s more, many firms are likely to have hybrid business models – meaning more than one area of focus or expertise. Such hybrid models are neither better nor worse than pure-play business models, as long as the combination is mutually reinforcing and beneficial.
Fifth, existing regulatory and competition policies and frameworks are likely to miss the mark in the new economy. As we will discuss, consolidating layers collect capital and shed jobs, while fragmenting layers shed capital and collect jobs. As a result, in the new Everything-as-a-Service economy, financial and labor policy that favors physically large organizational structures over smaller ones is unlikely to help promote business growth and formation. And, since what a company does may not be obviously tied to what it sells, to be effective, regulation should focus more on types of activities rather than on types of organizations. Lastly, given the rise and importance of smaller, narrowly-focused businesses, competition policy may fail to achieve its aim. These are topics we explore in greater detail at the end of this section.
Disentanglement and disruption: a deeper dive
The decline of traditional competitive barriers
Case study 1: Ford
Exhibit 3: Ford's use of the assembly line was an early form of disentanglement

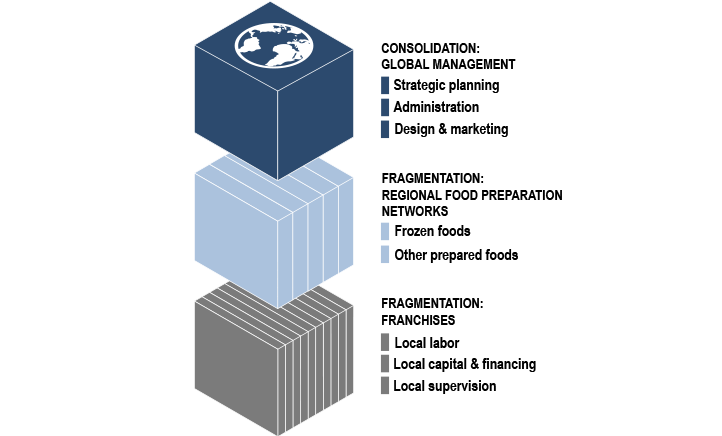
Case study 2: McDonald’s
Exhibit 4: The McDonald's production stack is characteristic of the Everything-as-a-Service economy
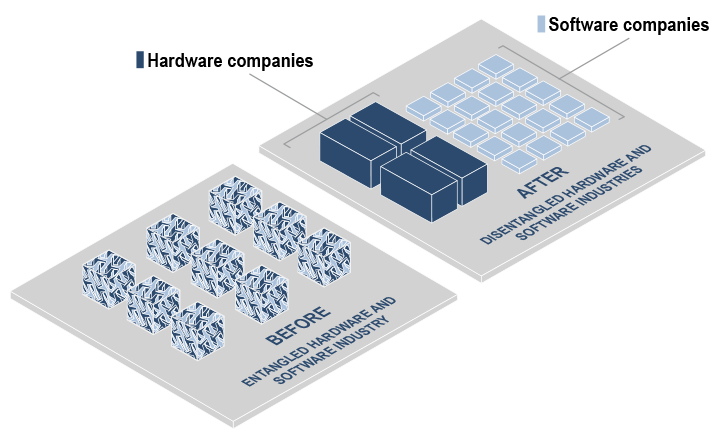
Case study 3: firmware (IBM)
Exhibit 5: IBM: the computer industry before and after firmware
Case study 4: user standards – Windows and iOS
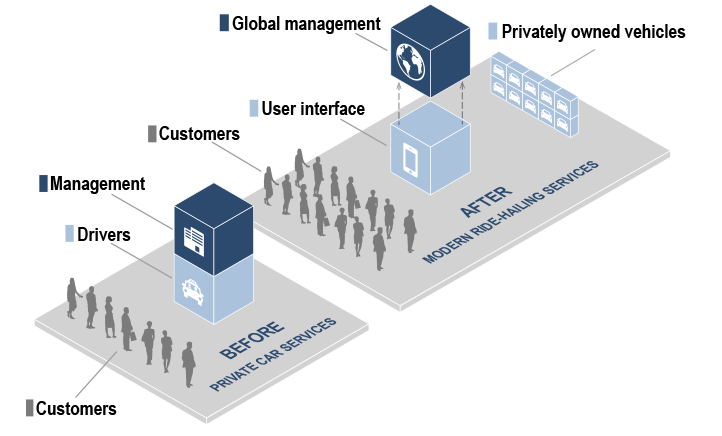
Case study 5: ride-hailing services
Exhibit 6: Ride-hailing players
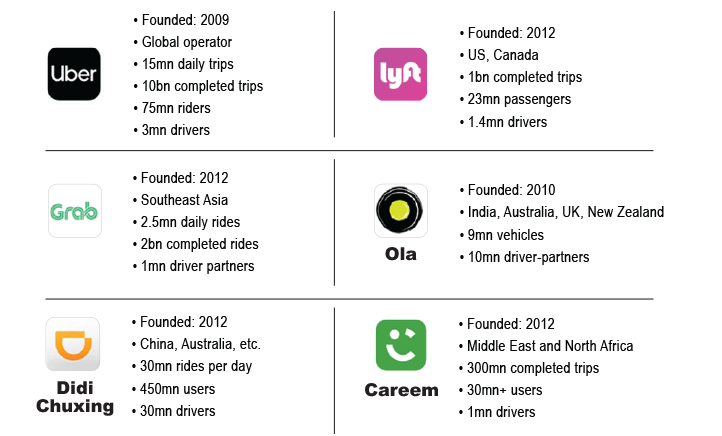
Exhibit 7: The ride-hailing model - before and after disentanglement
Case study 6: ISO 9000
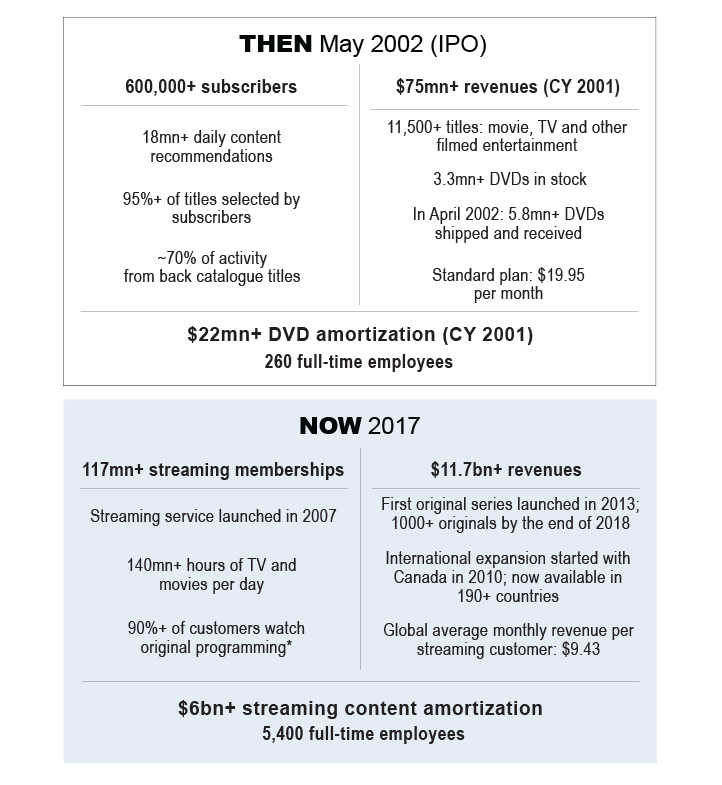
Case study 7: Netflix
Exhibit 8: Netflix is an example of a nearly virtual company
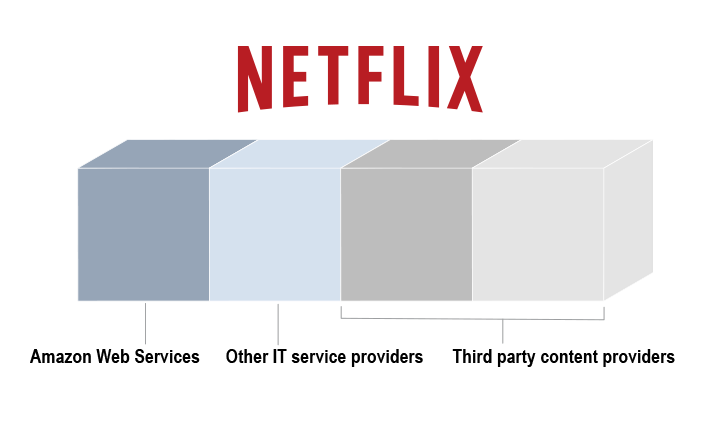
Exhibit 9: The evolution of Netflix
Regulatory disentanglement
Competition policy
Part 2: New Rules for New Business Models
Focus on core areas of strength
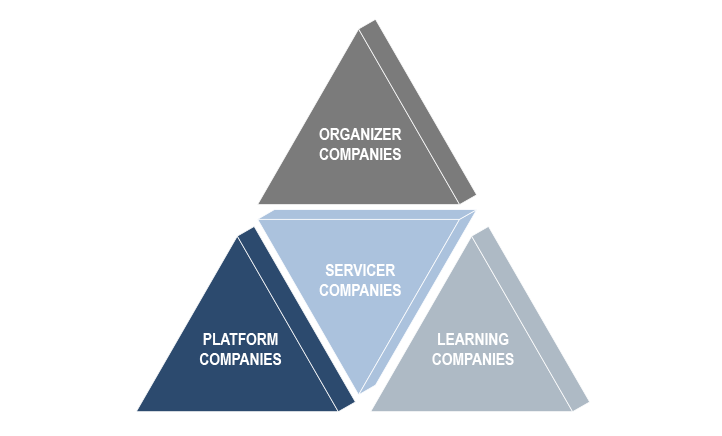
New business models
Exhibit 10: Business models that should prevail in the Everything-as-a-Service economy
Platform companies: exploiting economies of scale
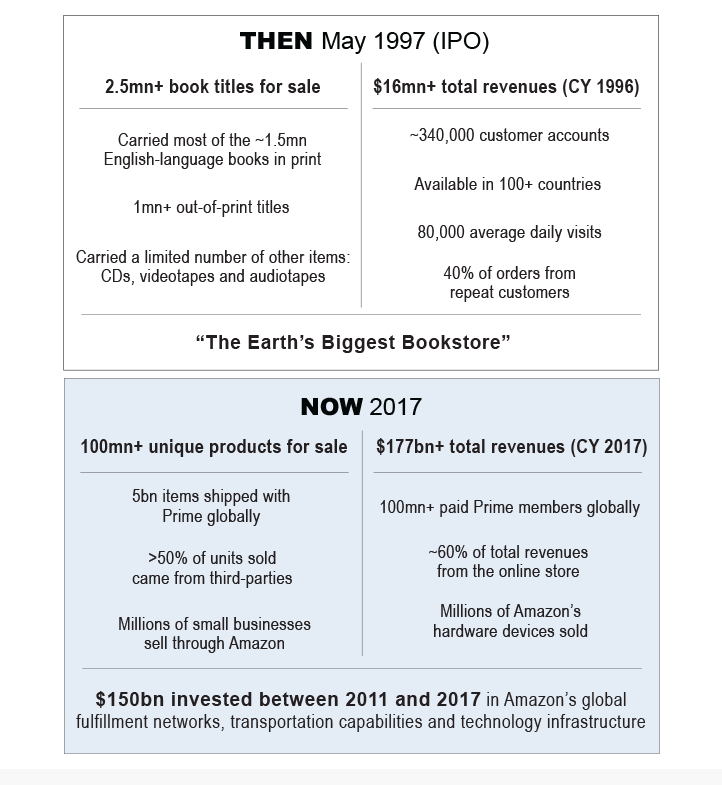
Case study 8: Amazon’s retail services business
Exhibit 11: Amazon's e-commerce business, then and now
Case study 9: Berkshire Hathaway
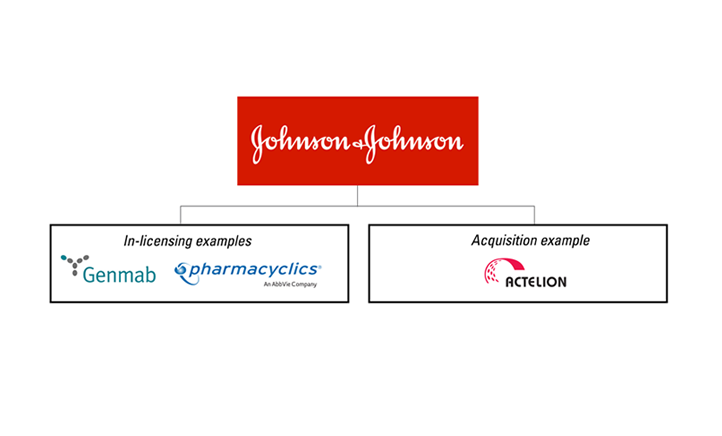
Case study 10: biopharma
Exhibit 12: Johnson & Johnson is an example of a platform holding company
Servicer companies: exploiting economies of scope
Case study 11: ADP in payrolls
Exhibit 13: Payroll providers like ADP are examples of modern servicer companies

Case study 12: payment processors
Exhibit 14: Payment processors - servicer company examples

Case study 13: Qualcomm
Organizer companies: exploiting economies of fit
Organizers and the role of communities
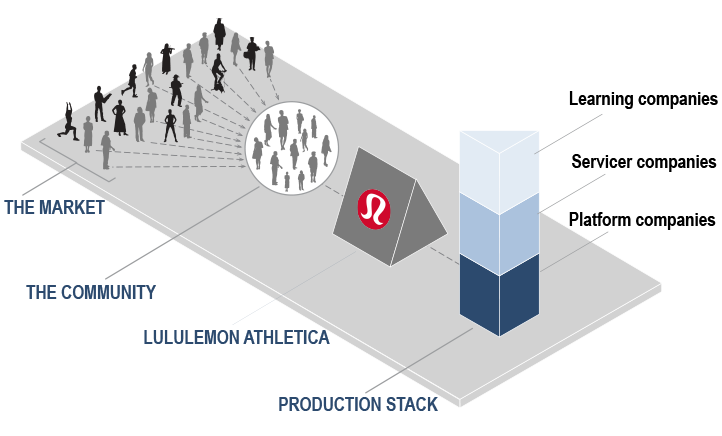
Case study 14: lululemon athletica
Exhibit 15: As an organizer, lululemon's community focus is key

Exhibit 16: In many ways, lululemon's business model reflects the modern economy
Learning companies: the benefits of information
Learning companies and “the learning curve”
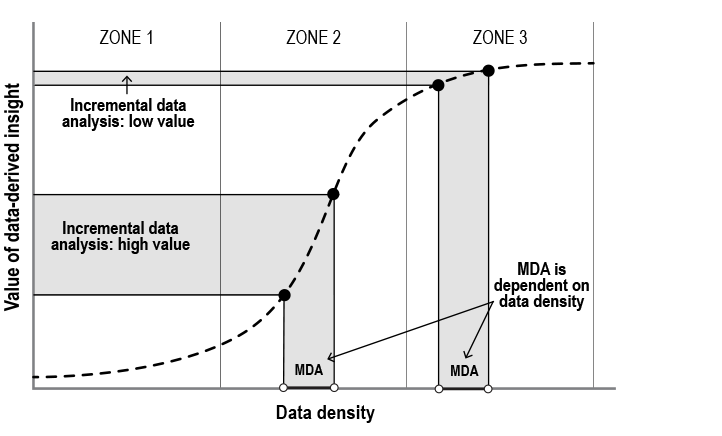
Exhibit 17: The learning curve: the potential value of data (PVD) as a function of the amount of usable data a firm possesses
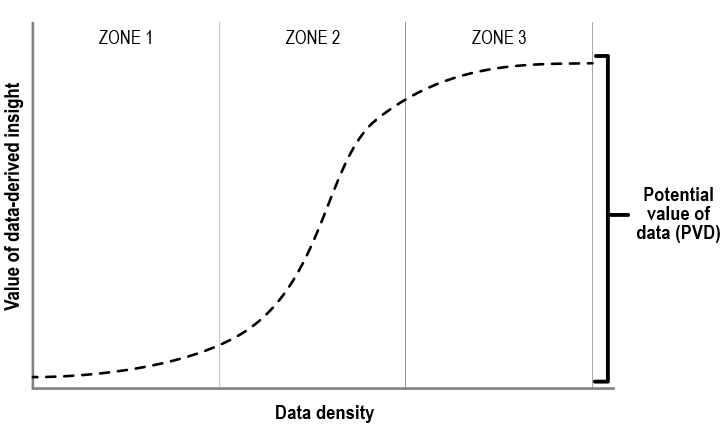
In zone 1, the learning curve is flat and the incremental value associated with data analysis is low. This means the gains associated with additional data analysis and data density are limited. The slow learning is due to the fact that a certain amount of data must be collected before it can be effectively modeled.
In zone 2, the curve begins to slope upward and becomes steeper, typically very steep. At this point, the nature of the data model has become clearer and is better defined, so the incremental value of data-derived information is high. As a result, in this zone, accumulating more data – particularly relative to competitors – can result in a maintainable data advantage or MDA and can generate significant incremental value, as Exhibit 18 shows.
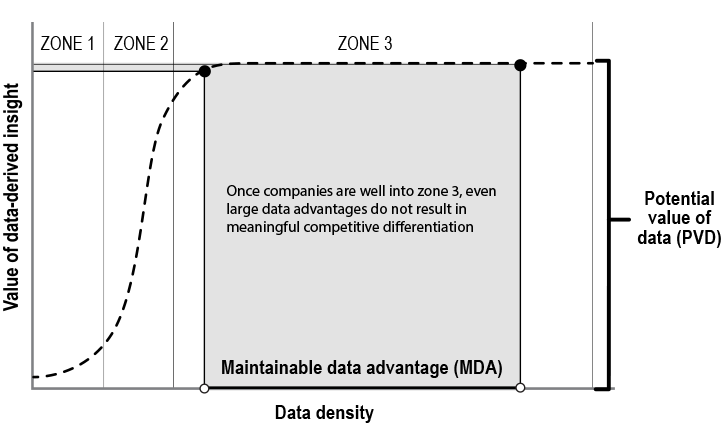
In zone 3, the learning curve flattens since additional data accumulation and analysis no longer result in significant incremental value. In this zone, the learning process is nearly complete since most of what can be learned from data to address a specific question or problem has already been learned. Firms in the same market segment that reach zone 3 are in essentially the same competitive position.
Exhibit 18: The learning curve – when data density is sufficient and there is a maintainable data advantage (MDA)
Data-smart companies
Data-asset companies
Data-feedback companies
Data density and decay
Exhibit 19: In zone 3, there is little competitive differentiation between firms regardless of the MDA
Data-network companies
First, are there sufficient data to analyze?
Second, are the insights gained from such data analysis novel enough to create significant value?
Third, is the implementation of those insights complex enough to prevent competitors from simply copying the approach?
Fourth, are the data scarce enough that a competitor cannot repeat the same analysis?
Concluding Thoughts
Bibliography
- 1 ^ The ideas contained within this publication benefited from extensive conversations with Goldman Sachs research analysts about disruption in their industries.
- 2 ^ Historically, economies of fit were referred to as monopolistic competition (see Chamberlin, The Theory of Monopolistic Competition).
- 3 ^ The learning curve can be derived a number of ways. In network theory (perhaps the most interesting derivation in the current context), the learning curve is the probability of being able to connect any two randomly chosen individuals in a large fixed population, where the x-axis is the number of individuals that have been linked randomly and pairwise to each other prior to the calculation. Another derivation of the learning curve comes from finance: it is the hedge ratio that provides optimal protection for an option against an increase in price (the market’s summation of information). Perhaps the most general derivation of the learning curve is the central limit theorem from statistics, where the curve is the asymptotic distribution of the mean of any data-generating process, regardless of the underlying statistical distribution. The precise functional form describing cumulative probability in all of these derivatives is the cumulative normal probability curve. The key requirement for the learning curve to function as described is that the data generating function needs to be stable (although the precise notion of stability differs by application). In the context contained herein, data decay serves this purpose. You cannot learn from data if each new piece arises from a different random process; thus, data decay permeates our discussion.
The Global Markets Institute is the public-policy and corporate advisory research unit of Goldman Sachs Global Investment Research. For other important disclosures, see the Disclosure Appendix.