Chapter 1: Survivor's guide - the short form
The EaaS transformation – from integrated producers to Platforms…
…and the transformation from boutiques to Organizers
The competitive value of data
Is there sufficient data to analyze?
Are the insights gained from the data novel and valuable enough to be of competitive benefit?
Is the data-derived strategy difficult to copy without the data?
Is the data sufficiently scarce or hard enough to collect that competitors cannot replicate the analysis in normal course?
Final thoughts
Chapter 2: Disruption's evolutionary roots
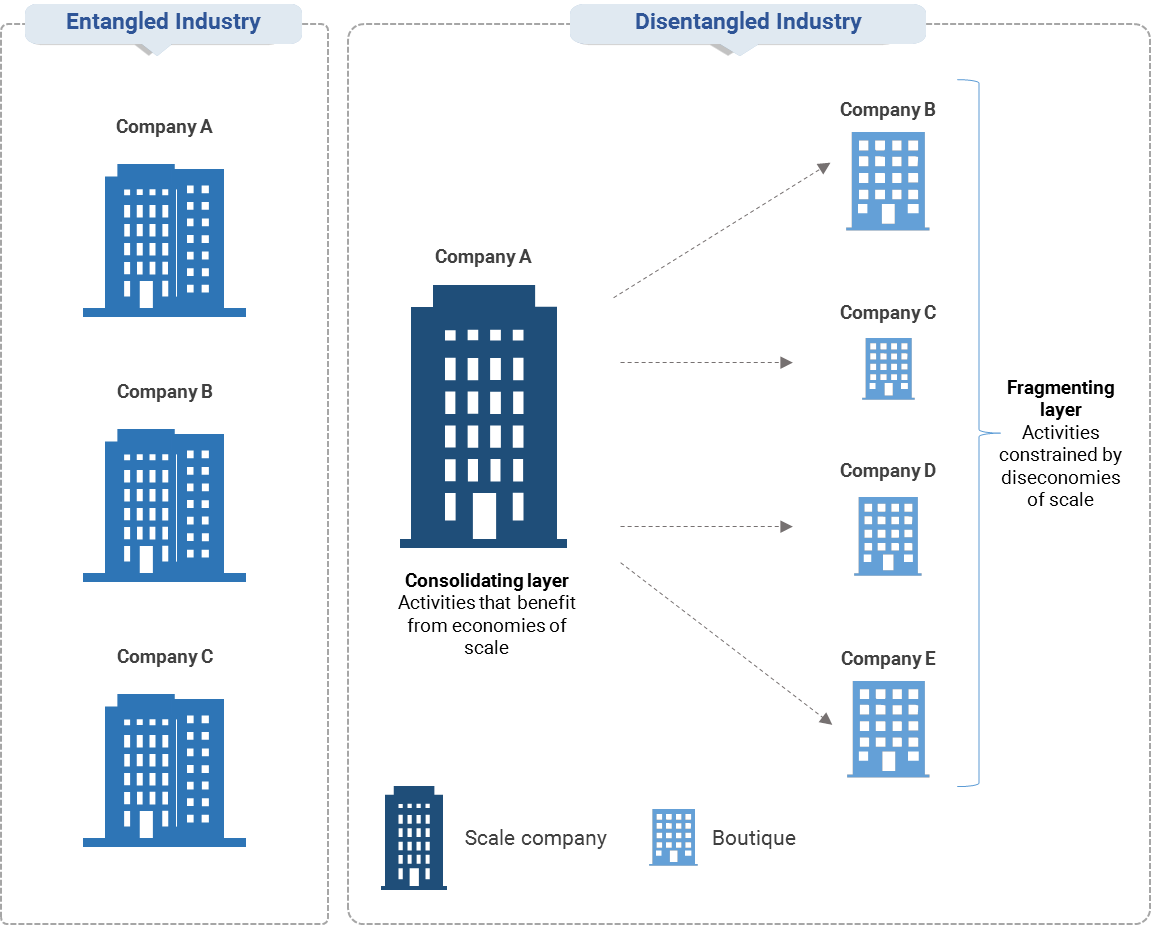
Why do we focus on disentanglement?
Exhibit 1: How firm-level disentanglement ultimately reshapes industries
Disentanglement and disruption: a deeper dive using case studies
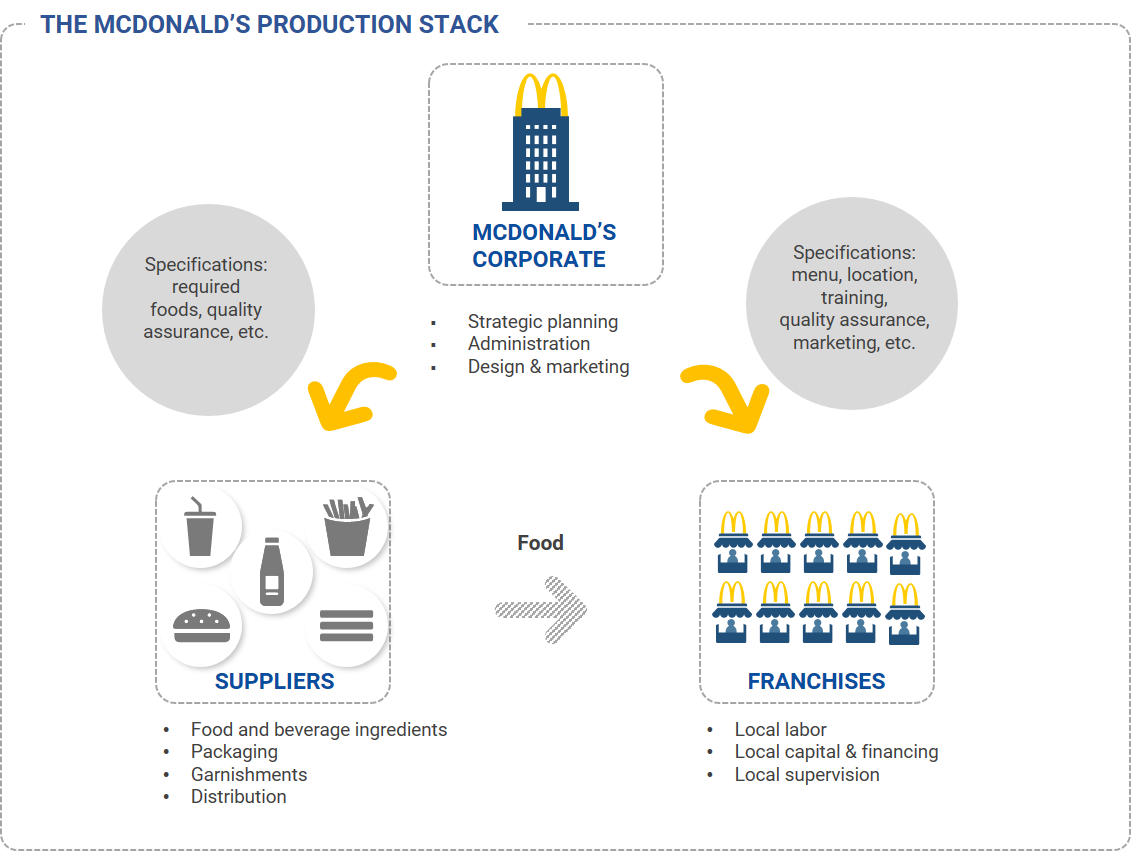
Case study 1: McDonald’s
Exhibit 2: The McDonald's production stack demonstrates the benefits of disentanglement
Industry disentanglement
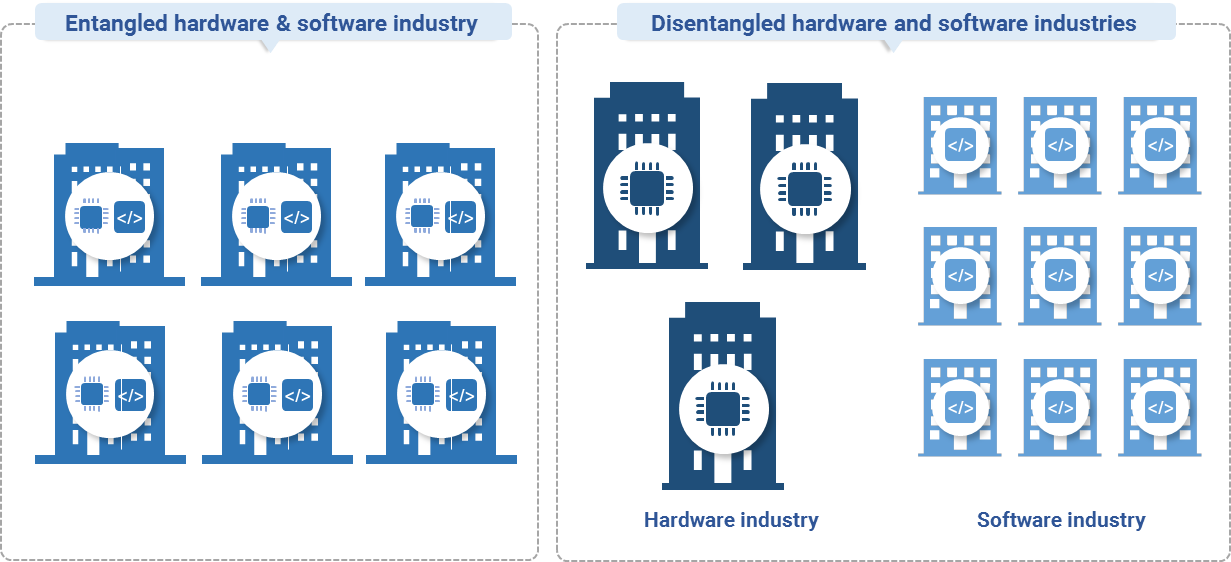
Case study 2: firmware (IBM)
Exhibit 3: The computer industry before and after firmware
The super accelerant: making change cheaper
Case study 3: user standards – Windows and iOS
Exhibit 4: Intuitive user interfaces make switching between competing products easier

From user standards to user-integrated production processes
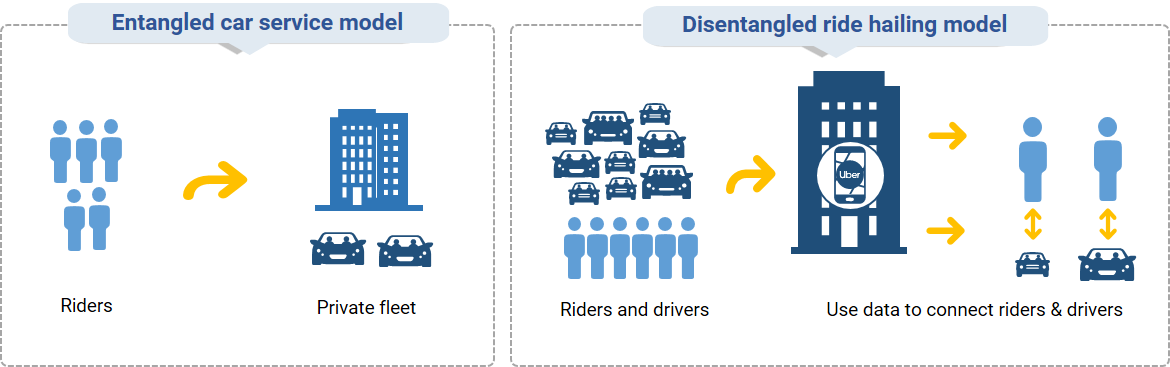
Case study 4: ride-hailing services
Exhibit 5: How user interfaces reshaped transport
ISO 9000 quality standards
Chapter 3: Perfecting Platforms
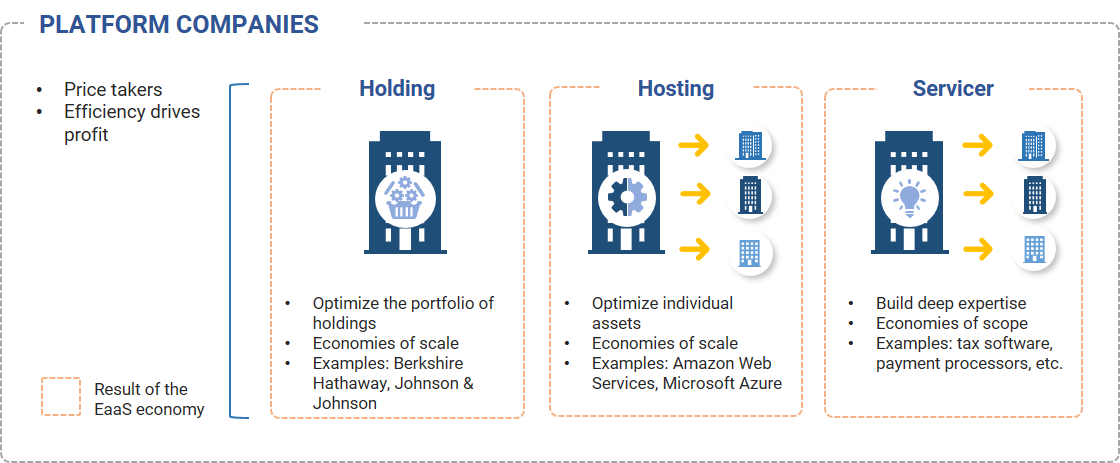
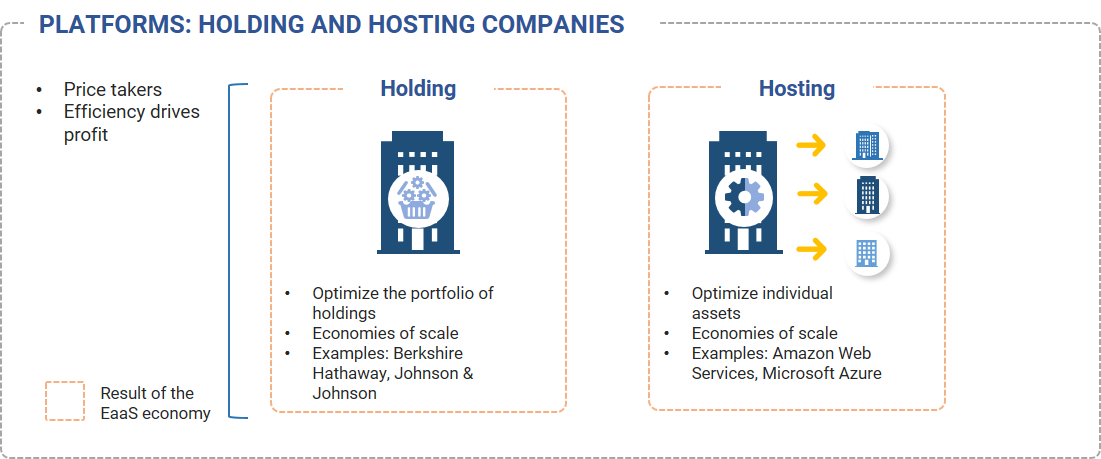
Holding companies focus on owning diversified portfolios of assets and prioritize managing these portfolios in their entirety, rather than each of the underlying assets independently. Examples: Berkshire Hathaway, Johnson & Johnson.
Hosting companies focus on having a diversified customer base, which allows them to manage their individual assets as efficiently as possible. Hosting companies seek to achieve high levels of physical asset utilization by distributing usage across as wide a customer base as possible. Examples: Amazon Web Services, Microsoft Azure.
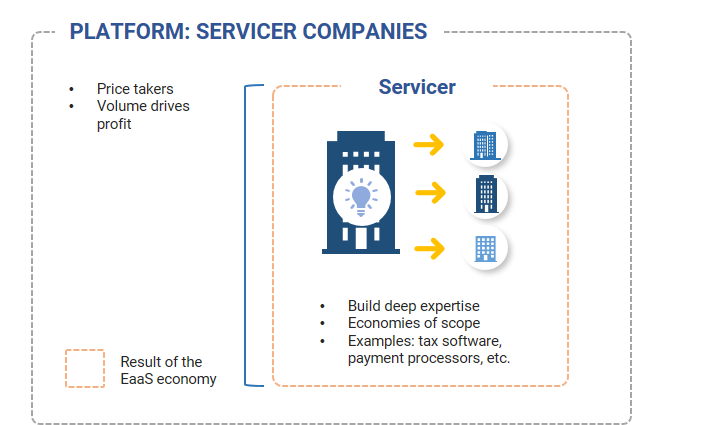
Servicers focus on providing their customers with some form of intellectual capital in a plug-and-play form, which allows Servicers to scale at very low marginal costs. Servicers seek to leverage this intellectual capital as much as possible and seek to expand their businesses by finding new customer types – but only ones that do not create diseconomies of scale by having unique customization requirements. Examples: tax software providers, payment processors.
Exhibit 6: The three types of Platform companies
Platforms: a closer look at Holding versus Hosting companies
Exhibit 7: A closer look at Holding and Hosting companies
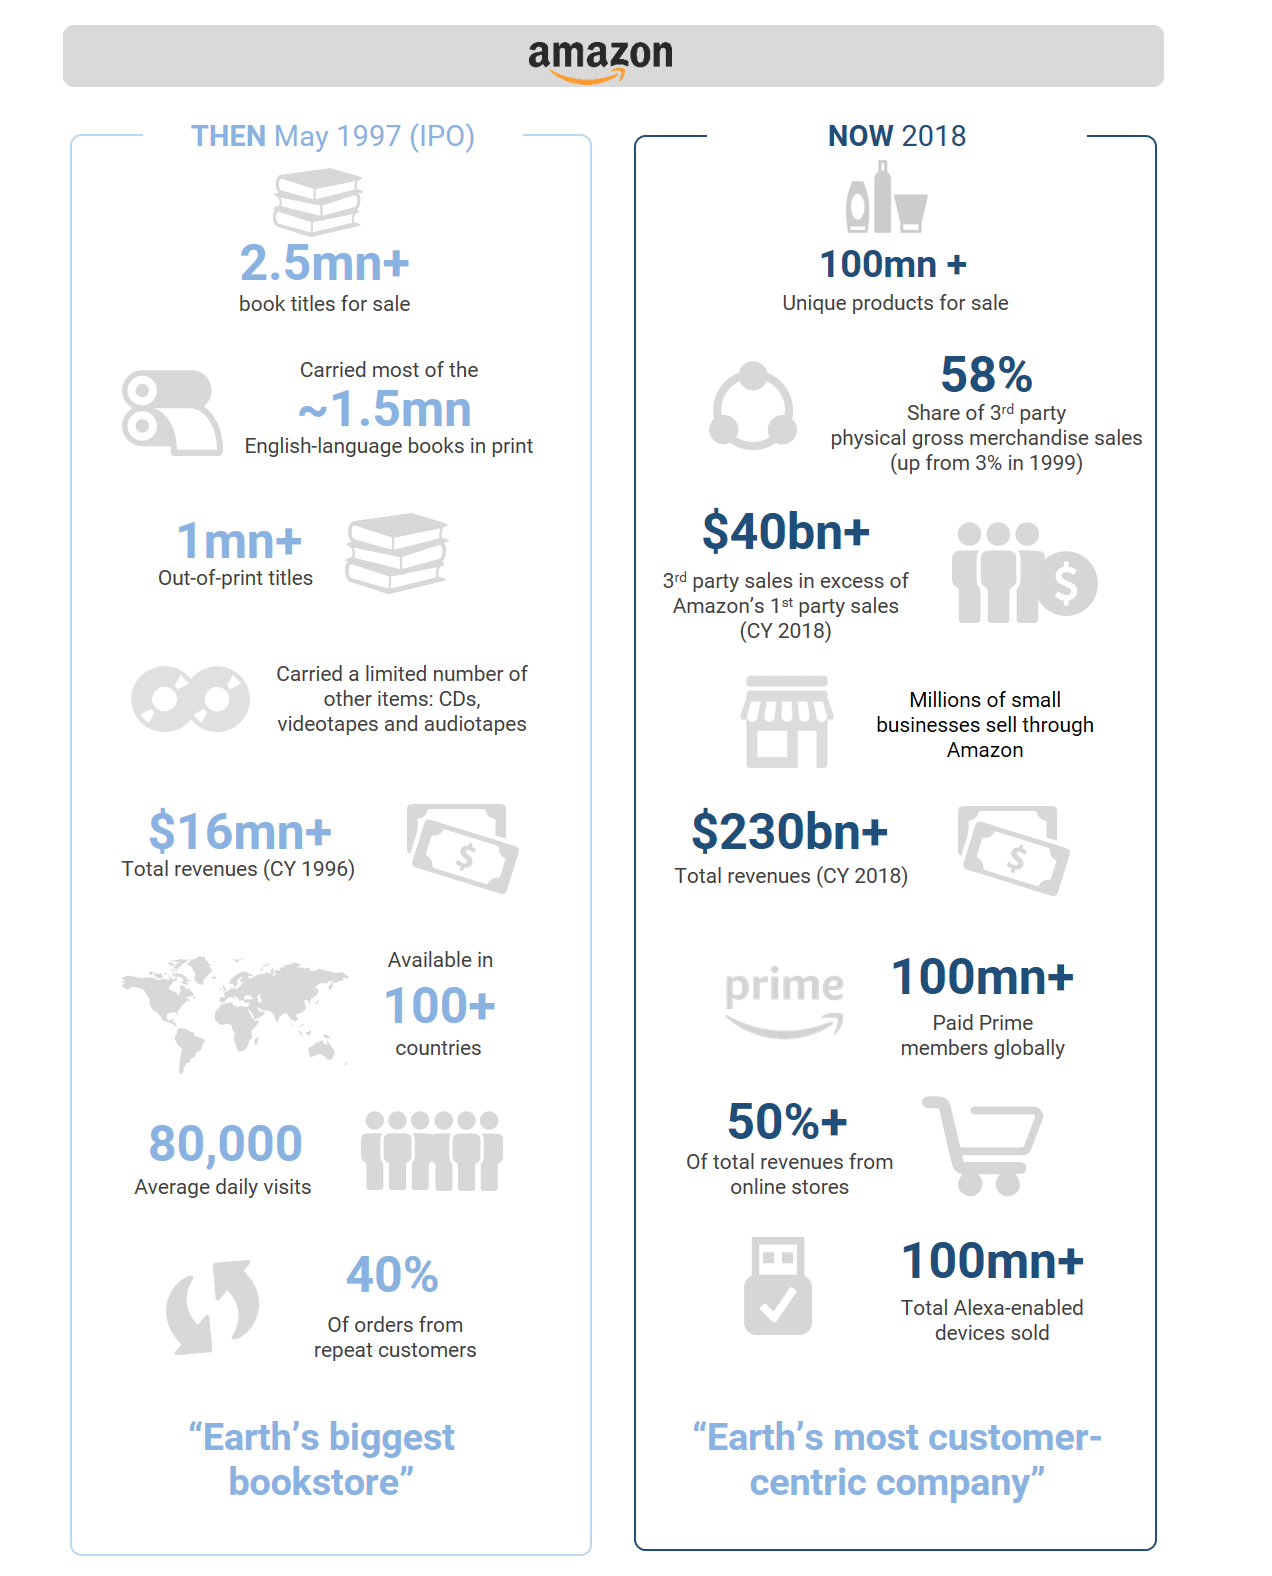
Case study 5: Amazon’s retail services business
Exhibit 8: Amazon's e-commerce business, 1997 and 2018
Case study 6: Berkshire Hathaway
Case study 7: the pharmaceutical industry
Servicer companies: exploiting economies of scope
Exhibit 9: Servicers are the intellectual capital version of Platform companies
Case study 8: Payroll software
Case study 9: payment processors
Exhibit 10: PayPal, Stripe, Square and Google Pay are examples of Servicers

Case study 10: Qualcomm
Case study 11: cable versus programming
Concluding thoughts
Chapter 4: Niche after niche - Organizers
Exhibit 11: Organizer companies
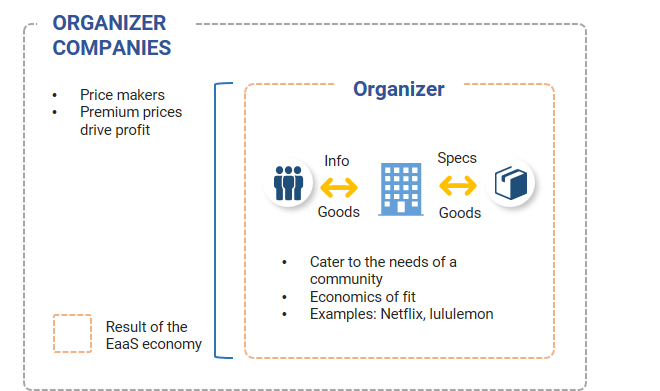
How Organizers create sustainable competitive advantages
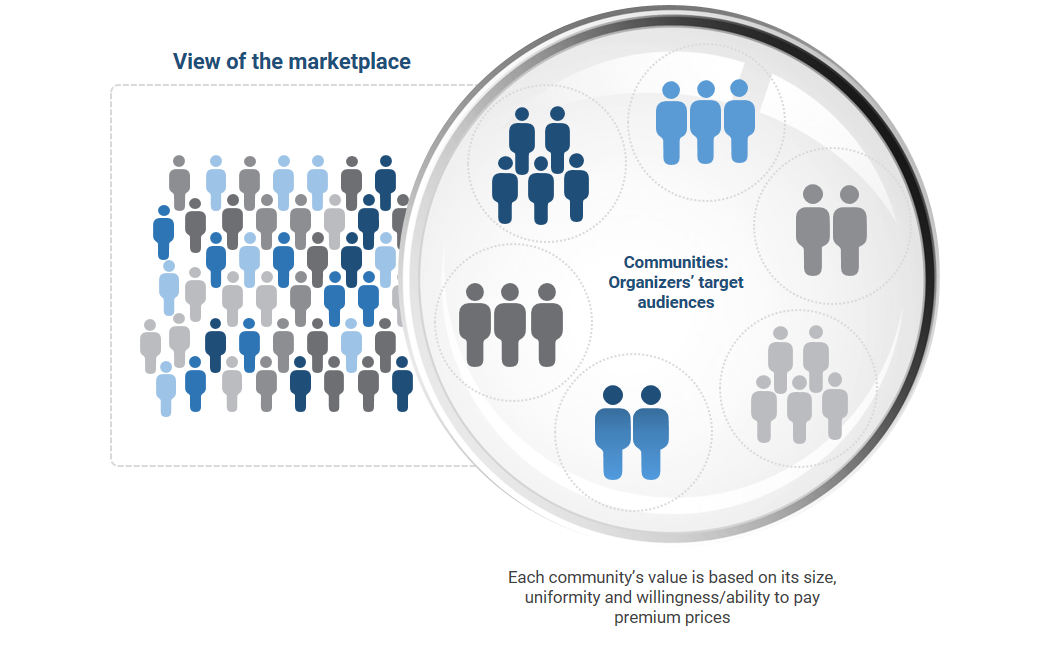
Organizers and the role of communities
Exhibit 12: Organizers focus on serving specific communities
Case study 12: Netflix
Finding the next niche – or why TV is getting weirder
Exhibit 13: A comparison of the advertising and subscriber views of programming
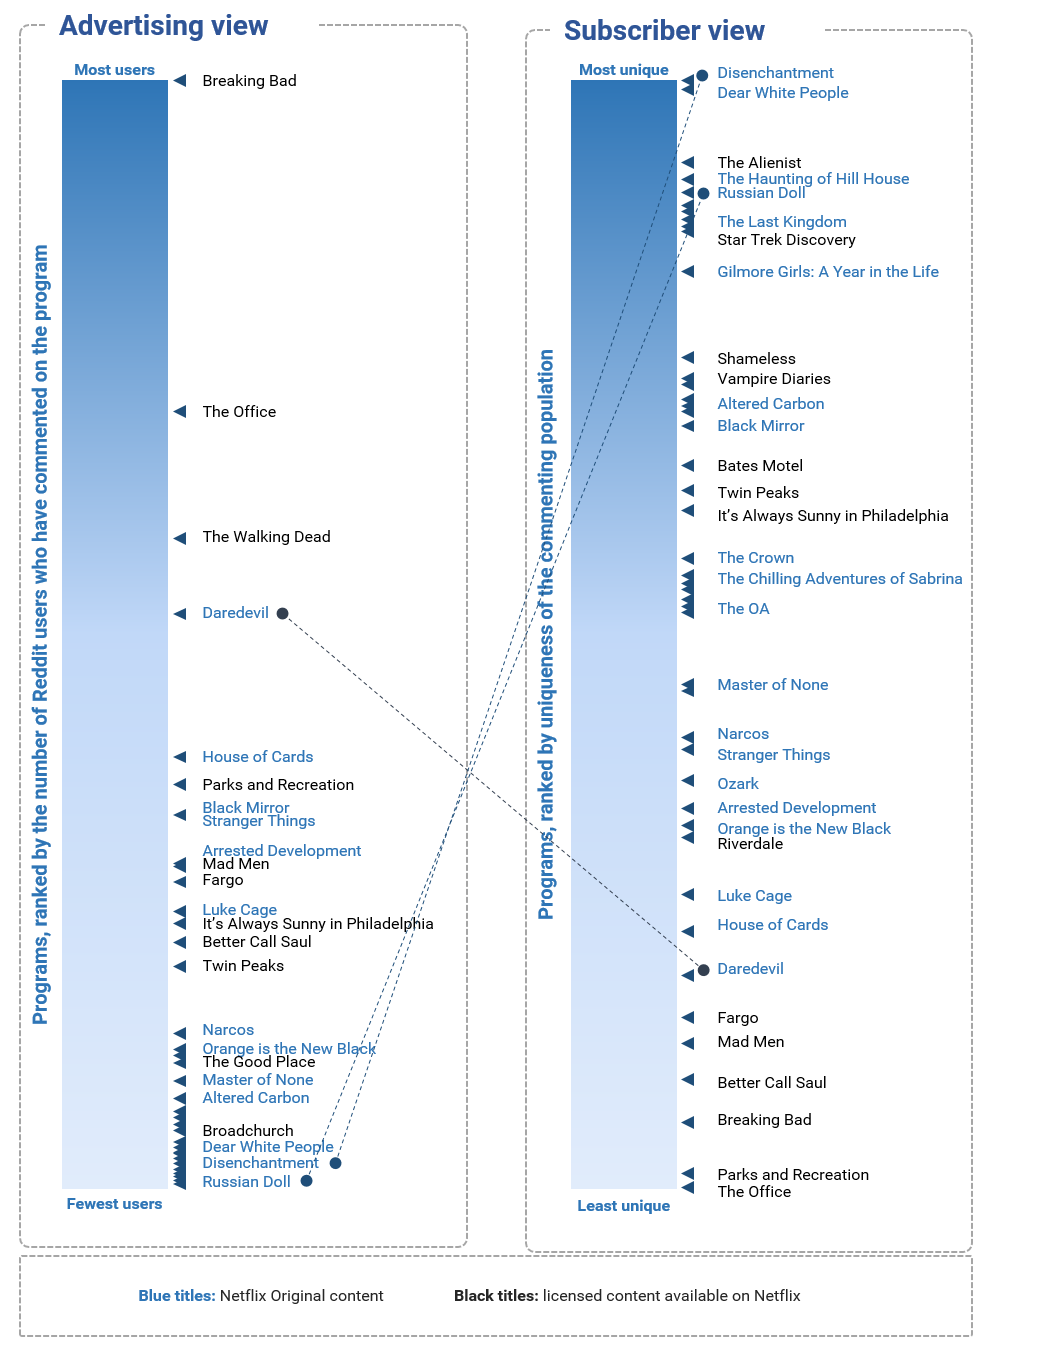
Exhibit 14: TV viewer analysis – analysis of Reddit comments
Community-linked Organizers
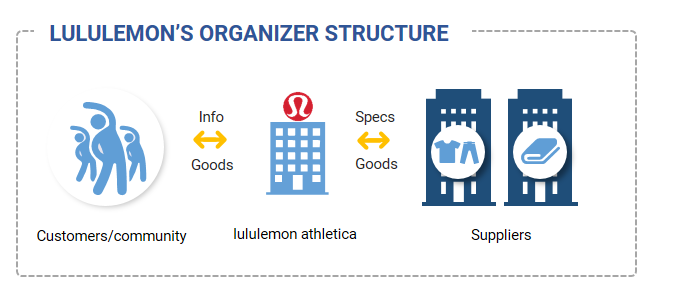
Case study 13: lululemon athletica
Exhibit 15: Lululemon’s Organizer business model
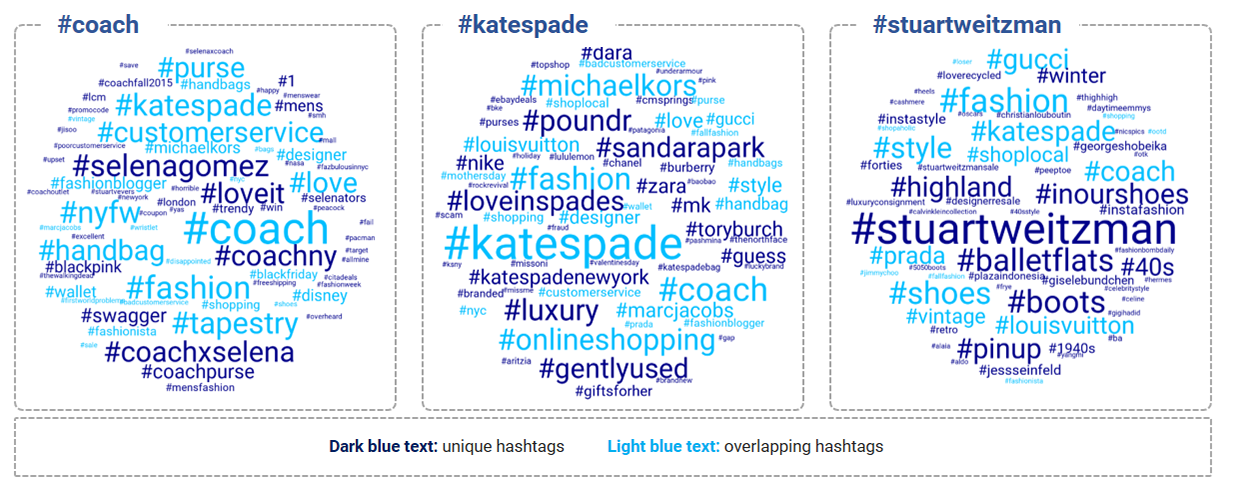
Case study 14: Coach
Exhibit 16: Understanding communities through word clouds: #coach, #katespade, #stuartweitzman
Chapter 5: The competitive value of data
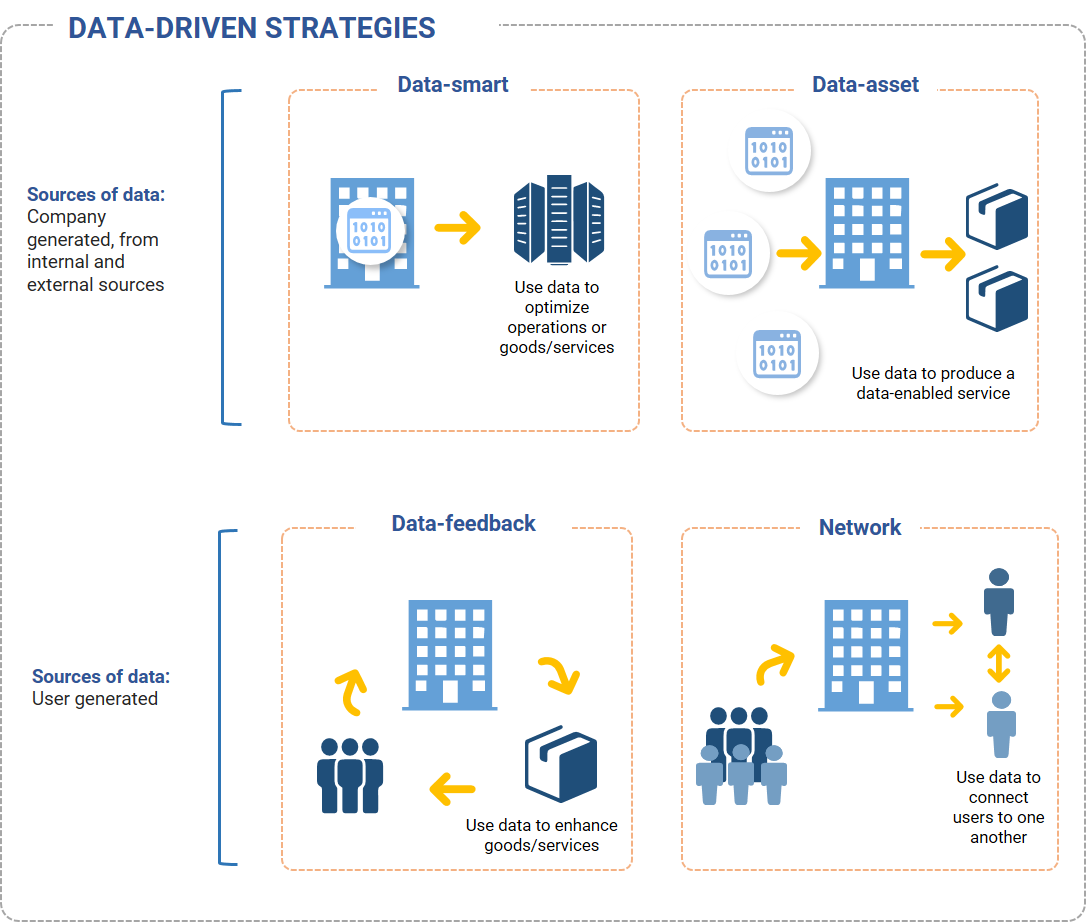
Data-smart strategies rely on a business’s internally generated data as the foundation for producing data-based insights – or what can be thought of as learning. These insights can be used to optimize both a firm’s operations as well as its output. An example of a business that uses a data-smart strategy is Amazon’s logistics service.
Data-asset strategies are dependent on a business’s ability to build a proprietary dataset using secondary sources, for example by collecting (free or purchased) data from sensors, genetic labs or satellites. These proprietary datasets can be used to produce data services that are sold to others. An example of a business that uses a data-asset strategy is IBM Watson Health.
Data-feedback strategies are applicable to businesses that collect user data. To employ this strategy, businesses collect the data that is generated by the users of their products or services, analyze it and leverage the resulting insights to enhance their products or services. Said another way, data-feedback strategies describe when a company leverages user data to create a feedback loop between its users and the goods or services it provides to those users. Examples of businesses that use data-feedback strategies include Spotify with its playlist suggestions, Amazon with its retail product recommendations or Google Maps.
Network strategies are also applicable to businesses that collect user data. However, the purpose of a network strategy is to leverage user data to connect users with one another. Examples of businesses that use network strategies include Uber, Lyft, Airbnb and Facebook.
The learning curve
Exhibit 17: The learning curve: the potential value of data (PVD) as a function of the amount of usable data a business possesses
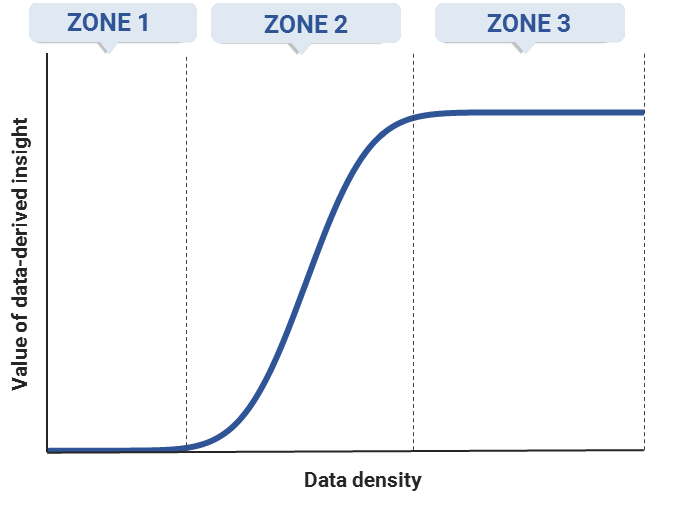
In zone 1, depicted on the left-hand side of Exhibit 18, the learning curve is flat and the incremental value associated with data analysis is low. This means the gains associated with incremental data analysis and data density are limited. The fact that learning is slow in zone 1 is due to the fact that a certain amount of data must be collected before it can be effectively modeled.
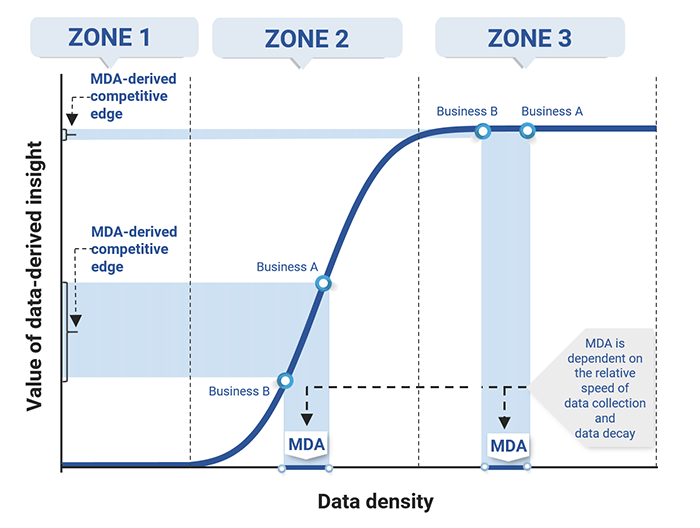
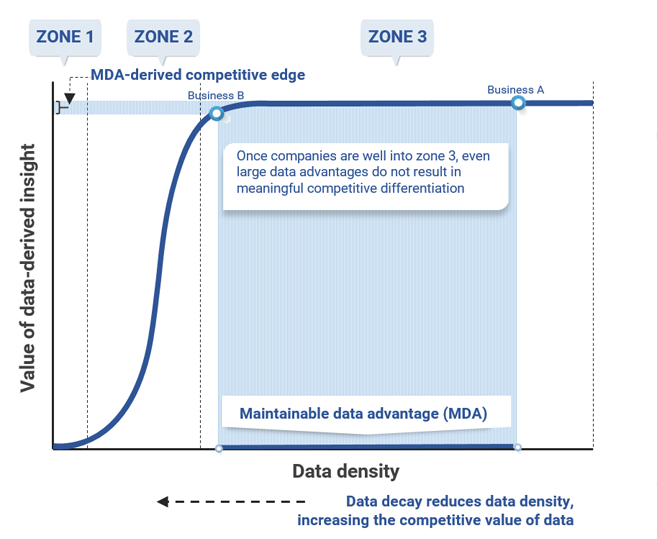
In zone 2, the learning curve begins to slope upward and becomes steeper, typically very steep. At this point, the nature of the data model has become clearer and is better defined, so the incremental value of data-derived information is high. As a result, in this zone, accumulating more data – particularly relative to competitors – can result in a maintainable data advantage (MDA) and can generate significant incremental value (as the middle portion of Exhibit 18 shows). The MDA refers to the pure advantage in the amount of data one business can collect relative to another; the learning curve can then be used to map that MDA to determine a business's relative competitive position given the value of its data-derived insights.
In zone 3, the learning curve flattens because incremental data accumulation and analysis no longer result in significant value, which can be seen on the right-hand side of Exhibit 18. In this zone, the learning process is nearly complete since most of what can be learned from data to address a specific question or problem has already been learned; businesses in the same market segment that reach zone 3 are in essentially the same competitive position. Accordingly, as Exhibit 18 shows, the same MDA that resulted in a significant competitive advantage for Business A relative to Business B in zone 2 becomes a very small advantage if both businesses reach zone 3.
Exhibit 18: The value of a maintainable data advantage (MDA) differs significantly by zone
Data density: the rate of collection vs. the rate of decay
Exhibit 19: In zone 3, there is little competitive differentiation between businesses regardless of the maintainable data advantage (MDA)
Data-driven learning strategies
Exhibit 20: The four types of data-driven learning strategies
The data-smart strategy
The data-asset strategy
Data-asset strategies: a comparison to deep-water drilling for oil or new drug development
The data-feedback strategy
The network strategy
The four-part test
Is there sufficient data to analyze?
Are the insights gained from the data novel and valuable enough to be of competitive benefit?
Is the data-derived strategy difficult to copy without the data?
Is the data sufficiently scarce or hard enough to collect that competitors cannot replicate the analysis in normal course?
Chapter 6: Concluding thoughts
Innovations are in general easier to execute, but are less likely to provide a sustainable advantage.
The use of external service providers allows firms to have a more narrow, focused approach to business but also creates a web of interdependencies that needs to be managed.
The path to success is actually more straightforward today: firms must have the best product, but the ability to stay on that path is far harder because someone else is coming!
An economic policy postscript
Lower barriers to entry across industries mean that firms will often find it more difficult to successfully engage in anti-competitive behavior, regardless of their own size or market position.
Given the role that most large firms now play as part of a more cooperative business environment, they now have strong incentives to support rather than exploit others.
The plug-and-play aspect of the EaaS economy lowers switching costs and makes it easier to displace “bad” actors, further limiting the scope for anti-competitive activity.
Appendix A: Considering communities
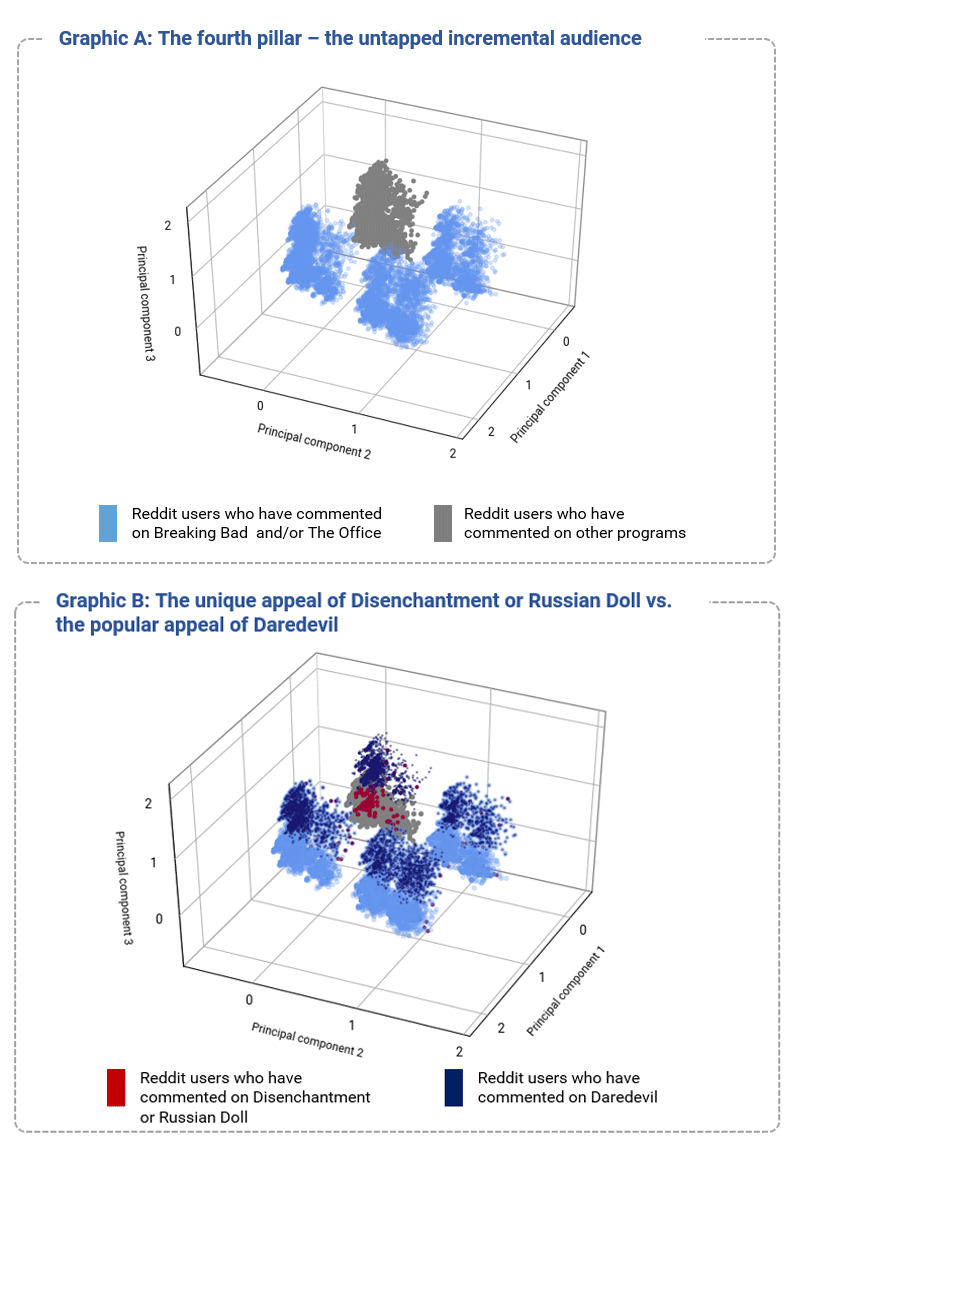
Principal component analysis of Reddit comments on 50 Netflix programs
The word clouds: a glimpse into community perceptions using Twitter hashtags
Bibliography
- 1 ^ Some of this material was included in Strongin, Steve et al (Dec 2018), The Everything-as-a-Service economy, Goldman Sachs Global Markets Institute.
- 2 ^ See Strongin, Steve et al (Apr 2019), What the market pays for, Goldman Sachs Global Markets Institute.
- 3 ^ Historically, economies of fit were referred to as monopolistic competition. See Chamberlin, E. (1933), The Theory of Monopolistic Competition, Cambridge Harvard University Press.
- 4 ^ We looked at a variety of similar ranking algorithms, including best fit types, all of which produced similar answers.
- 5 ^ The complete list of programs considered: 13 Reasons Why, The Alienist, Altered Carbon, Always Sunny in Philadelphia, American Horror Story, American Vandal, Arrested Development, Ash vs Evil Dead, Bates Motel, Better Call Saul, Black Mirror, Bojack Horseman, Breaking Bad, Broadchurch, Crazy Ex-girlfriend, Daredevil, Dear White People, Disenchantment, Fargo, Gilmore Girls, House of Cards, Luke Cage, Mad Men, Master of None, Mindhunter, Narcos, Orange is the New Black, Orphan Black, Ozark, Parks and Recreation, Parts Unknown, Peaky Blinders, Portlandia, Riverdale, Russian Doll, Sabrina, Shameless, Star Trek Discovery, Stranger Things, The Crown, The Good Place, The Haunting of Hill House, The IT Crowd, The Last Kingdom, The OA, The Office, Twin Peaks, Unbreakable Kimmy, Vampire Diaries, The Walking Dead.
The Global Markets Institute is the research think tank within Goldman Sachs Global Investment Research. For other important disclosures, see the Disclosure Appendix.