Goldman Sachs Research
A Closer Look
Immigration and the US workforce
13 August 2019 | 10:25AM EDT | Research| By Abby Joseph Cohen, CFA and others
More
0:00/0:00
  • Long-term sustainable economic growth in any nation is linked to a growing and appropriately skilled labor force. Slowing labor force growth is a challenge faced by many nations. The United States has been a notable exception among the world's largest economies. Since 1990, the US labor force has grown by almost 30% and immigrants have accounted for about half of this net increase (Exhibit 1).

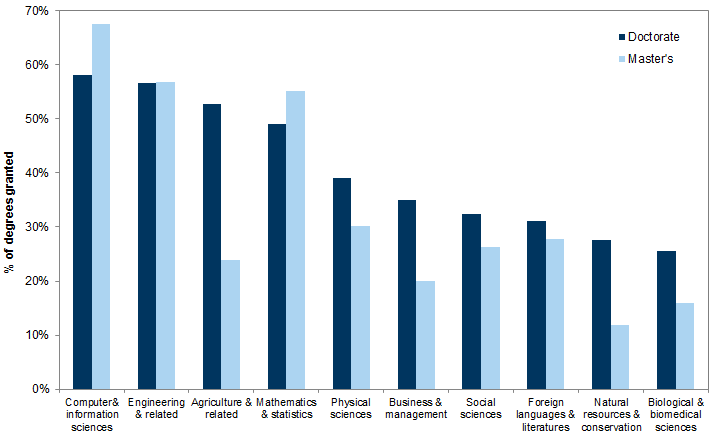
  • The US economy has undergone dramatic structural changes during this time. These include the shift from basic to more advanced manufacturing; the growth in service industries; and the explosion in industries tied to computer and information sciences. Immigrants comprise roughly 17% of the US workforce but are more heavily represented in highly skilled areas such as IT, mathematics, engineering, financial services and healthcare. In 2017, international students were awarded approximately 50% of the doctorate degrees granted by US universities in mathematics and 58% of those granted in IT and engineering. They were also awarded 67% of the master's degrees in IT and 56% of those in mathematics and engineering. These individuals have become a crucial source of talent for US companies (Exhibit 23).

  • Approximately 45% of the companies in the Fortune 500 were founded by immigrants or their children. Over the last five years, more than half of the US Nobel laureates were born abroad. Since the 1930s, about one-third of all US Nobel laureates were immigrants.

  • The experience of foreign-born workers in the US shows a stark bimodal distribution. While some excel, others are at the opposite end of the spectrum with regard to employment and income. Underlying factors relate to educational attainment, specific skills, facility with English and, in some cases, legal employment status. Upon entry in the workforce, immigrants have traditionally been concentrated in low-skilled occupations. More recently, occupations requiring high skills have seen the largest increases in foreign-born workers.

  • Foreign-born individuals comprise 41% of US workers who did not graduate from high school, although this number includes current high school students looking for work. In low-skilled occupations, foreign-born workers earn 15-30% less than their native counterparts, depending on occupation (Exhibit 10). Second-generation immigrants tend to perform far better economically than their parents due to higher levels of education, language proficiency and other factors (Exhibit 12).

  • Compared to native workers, highly educated foreign-born workers tend to have higher rates of unemployment and underemployment, particularly for those educated outside of the United States. But, field of study, not just the degree, determines employment opportunity and earnings. In some professions requiring advanced technical skills, foreign-born workers earn more than native workers due to stronger academic preparation and experience (Exhibit 10).

  • US immigration policy prioritizes family reunification. In FY 2017, 66% of individuals granted legal immigrant status were relatives of US citizens and permanent residents; 12% were granted status for employment reasons; and 11% were refugees. There have been declines in visas granted to international students and specialized workers since 2015. A large percentage of individuals granted these types of visas come from India and China. Finally, it is estimated that more than half of the newly undocumented population in the United States consists of people overstaying their otherwise legal visas and admissions.

Immigration and the US workforce

Introduction

A country's sustained economic prosperity depends on both the growth and the quality of its labor force. The United States, now in the midst of the longest economic expansion in its history, has experienced uninterrupted economic and labor force growth since the global financial crisis. As the US economy becomes more technology driven and service oriented, the US workforce is becoming more educated and specialized. A highly skilled labor force is essential to maintaining US leadership in innovation and research and development. This in turn requires a sustained flow of highly-trained professionals, including those in science, technology, engineering, and mathematics fields (STEM).
A slowdown in labor force growth has become a major long-term concern for policymakers and investors in several nations. As shown in Exhibit 1, Japan, China, and much of the European Union are either grappling with a declining labor force or could face similar situations in the coming years.[1] The United States has thus far avoided such a problem; its labor force has grown by 28.7% since 1990, the most robust expansion among the world's largest economies.

Exhibit 1: Labor force growth in the world's major economies

1. Labor force growth in the world's major economies. Data available on request.
Source: World Bank, Goldman Sachs Global Investment Research
Labor is a fundamental driver of economic growth. A sustainable flow of entrants into the workforce is linked to growth in aggregate demand for goods and services. Labor force growth is essential to the tax revenue base. This is especially true at a time when the median population age is rising in many countries. In the United States, the long-term sustainability of the Social Security program is under pressure due to the expected increase in the retirement-age population. The ratio of covered workers (those who pay Social Security payroll taxes) to benefit recipients was 3.3 in 2005, and declined to approximately 2.7 in 2018. According to estimates from the Congressional Budget Office, this ratio is expected to further decrease to 2.0 by 2035. The pressure is even more intense on Medicare funding given the greater difficulty in forecasting future obligations.
A key distinguishing factor of the United States's impressive labor force growth is its inflow of immigrants. Between 1996 and 2018, 49.3% of the net increase to the US labor force can be attributed to people born outside the country (Exhibit 2). During the current economic expansion that began in 2009, this percentage has increased to 53.9%. The foreign-born workforce grew from 14.4 million to 28.2 million during the 1996-2018 period, a cumulative increase of 95.4%. By comparison, the native workforce grew by 11.8%, from 119.7 million to 133.9 million, during this period. As a result, foreign-born workers' share of the US labor force increased from 10.8% in 1996 to 17.4% in 2018. With a decreasing birthrate and an aging native population (Exhibit 3), the potential importance of immigration to the future growth of the US labor force and its economy is expected to increase in the foreseeable future.

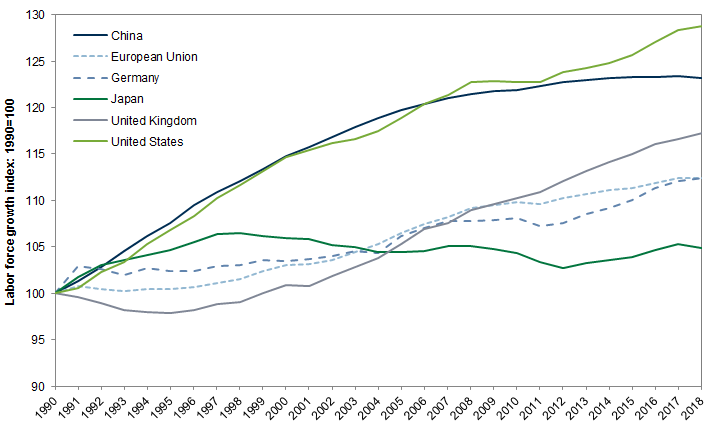
Exhibit 2: Labor force growth: native vs. foreign-born workers

2. Labor force growth: native vs. foreign-born workers. Data available on request.
Source: US Census Bureau, US Bureau of Labor Statistics, Goldman Sachs Global Investment Research

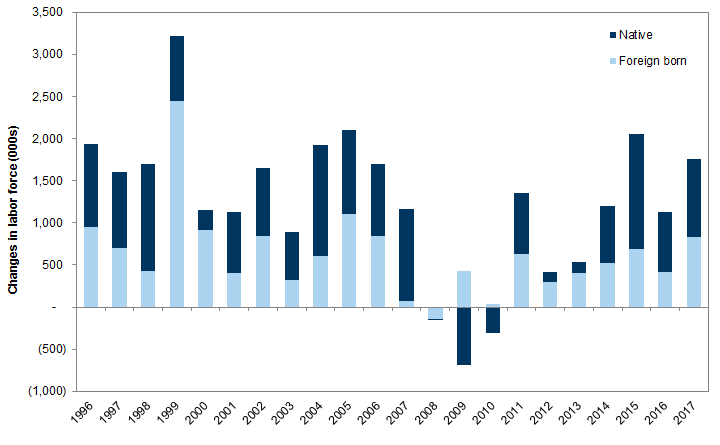
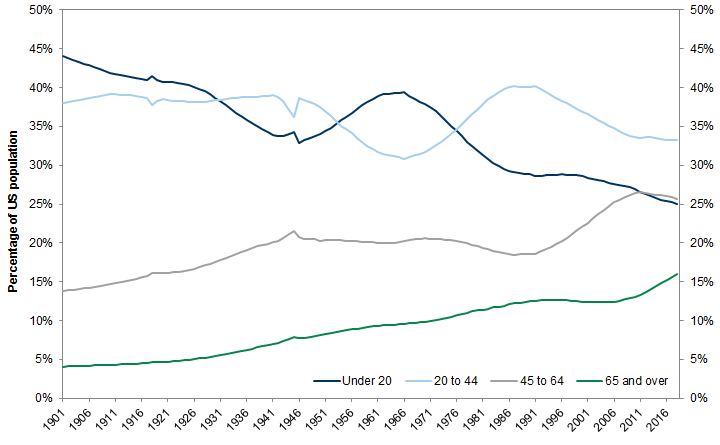
Exhibit 3: Distribution of US population by age group

3. Distribution of US population by age group. Data available on request.
Annual data from 1901 through 2018
Source: Census Bureau, Haver Analytics, Goldman Sachs Global Investment Research
In this report, we take a closer look at the foreign-born workforce in the United States, its characteristics, and how it has changed in relationship to shifting economic trends in the country. The bulk of the data for this analysis has come from the Current Population Survey Annual Social and Economic Supplement, published by the US Census Bureau. The CPS surveys do not include questions on the legal status of immigrants. Instead, this report considers the overall foreign-born workforce, which may include naturalized citizens, legal permanent residents, temporary foreign workers, and undocumented immigrants. The civilian labor force discussed in this report includes all people age 16 and older who are classified as either employed or unemployed. This includes current high school students who are looking for work.

Occupations held by immigrants: increasingly wide-ranging and professional

Foreign-born workers within the United States have an increasingly bimodal pattern of distribution with regard to occupation, education attainment, and earnings. They have historically been more concentrated in low-skilled occupations that do not require high-degree proficiency in English or advanced levels of education. While this still largely holds true today, data from the US Census Bureau show that the number of foreign-born workers in high-skilled occupations — particular those STEM fields — has grown rapidly over the past fifteen years (Exhibits 4, 6).
Compared to their share of the overall US labor force, immigrants play an outsized role in many high-skilled occupations that are crucial to long-term economic expansion and productivity growth. In addition, immigrant workers in these occupations on average earn more than their native counterparts due to stronger and/or more specialized education. As is discussed in a later section on educational attainment, fields of study, not just the degree, have a notable impact on job opportunities and earnings.
Exhibit 4 shows the size and concentration of the US foreign-born workforce across occupation groups using data from the most recent three years. Occupations such as construction, management, and sales employ the largest number of immigrant workers, while legal, protective, and social services employ the smallest. This is largely in line with the distribution of occupations in the overall economy (Exhibit 5). Immigrant workers have the largest concentration, that is, as a percentage of total workers, in occupations such as farming, cleaning and maintenance services, and construction (Exhibit 6). These are generally low-skilled jobs that allow immigrants with limited language and education levels to participate in the labor force. In many cases they receive substantially lower compensation than native workers with similar skill sets and work experience.

Exhibit 4: Number of foreign-born workers by occupation

4. Number of foreign-born workers by occupation. Data available on request.
Data are three year averages for the period 2016-2018
Source: US Census Bureau Current Population Survey, Goldman Sachs Global Investment Research

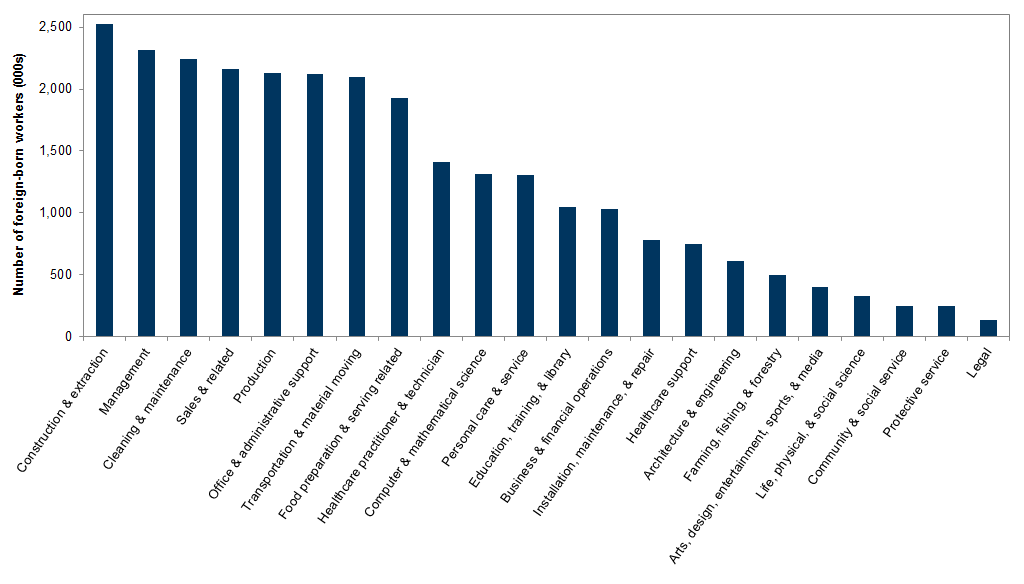
Exhibit 5: Number of workers in the US by occupation

5. Number of workers in the US by occupation. Data available on request.
Data are three year averages for the period 2016-2018
Source: US Census Bureau Current Population Survey, Goldman Sachs Global Investment Research

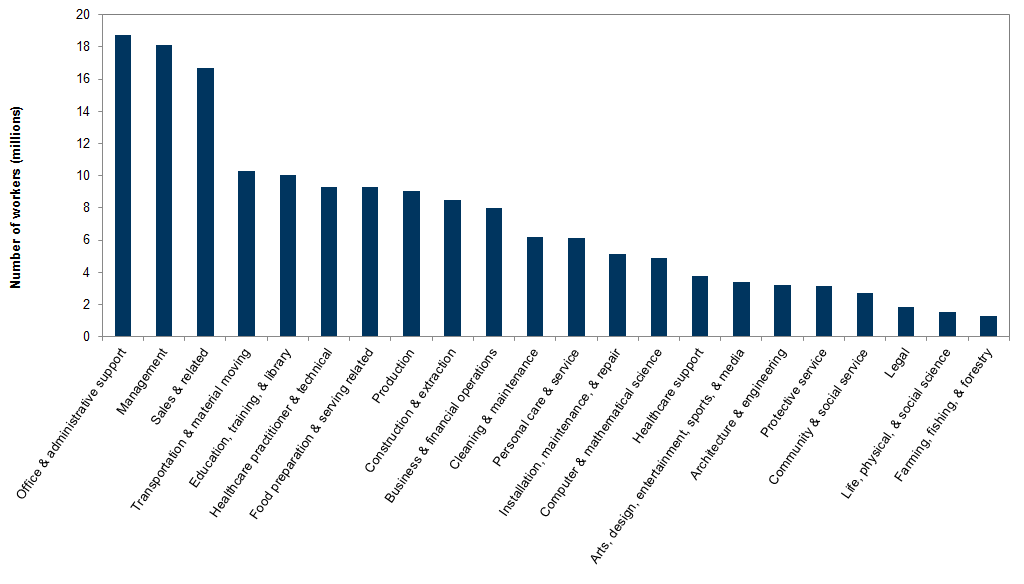
Exhibit 6: Concentration of foreign-born workers by occupation

6. Concentration of foreign-born workers by occupation. Data available on request.
Data are three year averages for the period 2016-2018
Source: US Census Bureau Current Population Survey, Goldman Sachs Global Investment Research
Occupations that require high levels of education and specialization, such as those in computer, mathematical, life and physical sciences, also have large concentrations of immigrant workers. The number of foreign-born workers holding jobs in STEM and business-related fields have steadily increased in recent years. As shown in Exhibit 7, the number of foreign-born workers in computer and mathematics-related occupations rose 141.1% in the 15 years ending in 2018, the highest among all occupation groups. Immigrants now make up 27.5% of all workers in these occupations, compared to 18.2% in 2003. During this period, there was also a large increase in the share immigrants comprised of total employment in construction and extraction, rising to 30.7% from 20.7%.

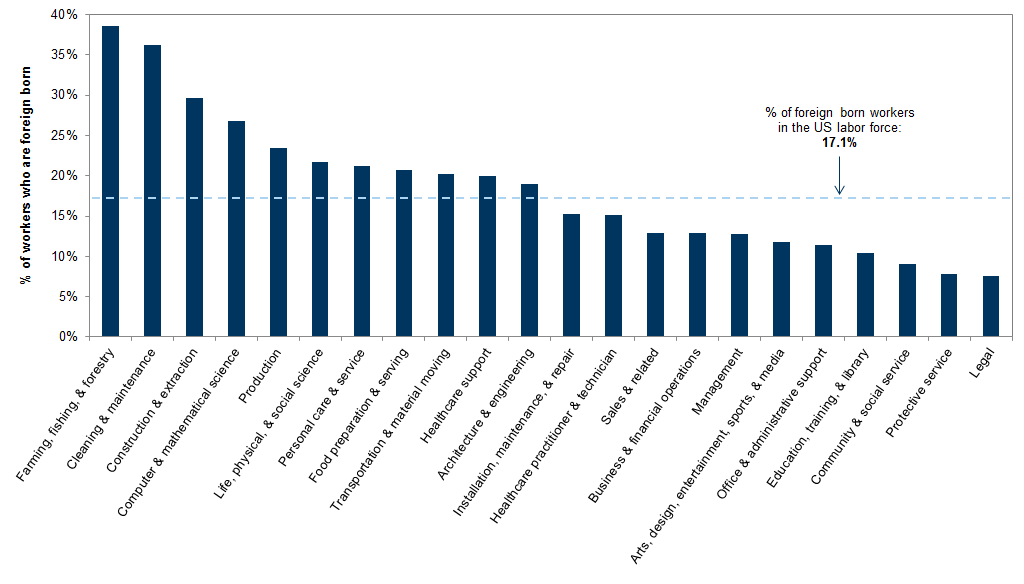
Exhibit 7: Changes in foreign-born workers by occupation, 2003-2018

7. Changes in foreign-born workers by occupation, 2003-2018. Data available on request.
Source: US Census Bureau Current Population Survey, Goldman Sachs Global Investment Research
Other occupations that have experienced significant growth in immigrant workers include many professional services such as legal, healthcare, financial, and engineering. These occupations have traditionally employed few foreign-born workers, as they generally require professional licenses and several years of specialized training. Immigrants' gains in these occupations can be attributed to the substantial increase in foreign students studying in American universities. Each year, significant percentages of postgraduate degrees in STEM and business-related fields are conferred on international students, many of whom then transitioned into the US labor force upon graduation.
With the rapid proliferation of technologies such as the internet, mobile devices, and artificial intelligence, STEM occupations are increasingly becoming a driving force behind US job growth. According to the most recent US Bureau of Labor Statistics (BLS) projections, and using BLS industry categorizations, employment in STEM occupations is expected to increase 10.8% during the 2016-2026 period. During the same time frame, BLS estimates that non-STEM employment will grow 7.2%. Exhibit 8 shows that employment in healthcare, personal and social services is forecast to experience significant growth over the 2016-2026 period. The aging of the population will increase the need for low-end healthcare service providers; these roles are often filled by immigrants. Computer and mathematical sciences occupations, which make up nearly half of all STEM occupations, are expected to grow 13.7%.
Currently, the United States is not producing enough workers in STEM occupations to meet this growing demand. According to data from the National Center for Education Statistics (NCES), US colleges and universities awarded 1.8 million bachelor's degrees in 2017. STEM fields made up 20.9% of this total, including 6.3% in engineering, 3.4% in computer and information sciences, and 1.3% in mathematics and statistics. By comparison, 31.2% of the bachelor's degrees earned by international students at American universities were in STEM fields. Given the expected robust growth in labor demand, and the inadequate pipeline of homegrown workers, employers will likely continue to rely on foreign-born talent to meet their hiring needs in STEM occupations.

Exhibit 8: Projections for employment growth by occupation groups

For the period 2016-2026
8. Projections for employment growth by occupation groups. Data available on request.
Source: US Bureau of Labor Statistics, Goldman Sachs Global Investment Research
Occupations that have had the slowest growth in foreign-born workers, and the smallest increase in the share of foreign-born workers, are concentrated in low-skilled categories such as basic manufacturing, agriculture, food service, and retail. Several factors have contributed to this.
First, technological advancements such as automation, supply chain integration, and e-commerce have significantly reduced the demand for labor in many industries that employ mainly low-skilled workers. The loss of jobs in these sectors has affected both native and foreign-born workers.
Second, over the past two decades, and in particular since the 2007-2008 financial crisis, the United States has seen a substantial reduction in the net inflow of unauthorized workers, who tend to be highly concentrated in low-skilled occupations such as farming, construction, and food service. Experts believe that this is due to improved economic conditions in Mexico and stepped-up law enforcement in the United States. Based on estimates from the Pew Research Center, there were 7.6 million unauthorized immigrant workers in the United States in 2017, compared to 8.2 million in 2007. The Center for Migration Studies of New York estimated that for each year during the 2010-2017 period, more than half of the new undocumented population in the United States originated from people overstaying their otherwise legal visas, such as those issued to tourists.
Third, the US immigrant population is now highly concentrated in large urban centers. Exhibit 9 shows that slightly more than half of the foreign-born population resides within ten large Metropolitan Statistical Areas (MSAs), while only 4.1% live outside of an MSA. New immigrants may be more willing to settle in big cities due to the presence of established immigrant communities in these places, which benefits immigrants with easier access to job opportunities and community support. Because of the high concentration of services-oriented jobs in the cities, the increase in foreign-born workers in these occupations may be a reflection of their geographical distribution.

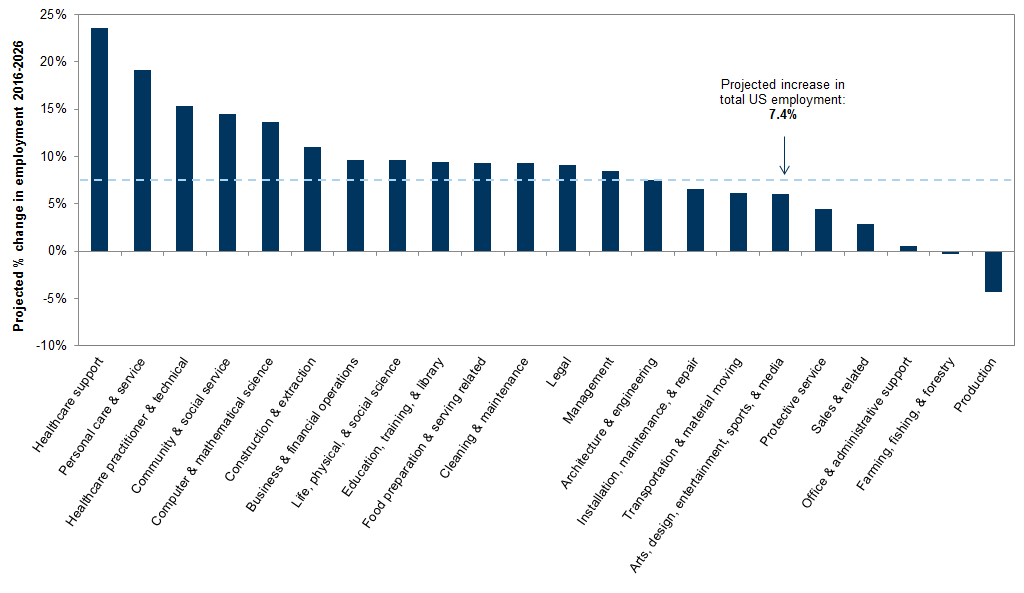
Exhibit 9: Distribution of foreign-born population by metropolitan areas

9. Distribution of foreign-born population by metropolitan areas. Data available on request.
Data based on 5-year estimates, 2013-2017
Source: US Census Bureau American Community Survey, Goldman Sachs Global Investment Research
Compared to their native counterparts, foreign-born workers tend to have higher earnings in high-skilled occupation categories, and lower earnings in low-skilled ones (Exhibits 10, 11). For instance, in STEM fields such as computer science, life and physical sciences, and engineering, foreign-born workers on average earn 15%-25% more than native workers because they tend to be better skilled and more experienced. US immigration policy encourages this. Foreign workers are required to possess advanced degrees and/or skills in high demand in the United States in order to secure legal permanent resident status or temporary specialty visas for employment purposes. As a result, foreign-born workers tend to be concentrated in more specialized and thus higher-earning positions within each occupation group, leading to the earnings differential compared to native workers.
In low-skilled occupations such as farming, manufacturing, personal care, and construction, foreign-born workers on average earn 15%-30% less than their native counterparts. Many foreign-born workers in these occupations may lack adequate English proficiency and/or authorization for legal employment, and are often hired under informal work arrangements. Their immigration status may have prompted them to accept wages significantly below the market rate for native workers. US federal law prohibits undocumented immigrants from participating in many means-tested governmental assistance programs such as SNAP (food stamps) and Medicaid. This further impedes their relative standard of living.

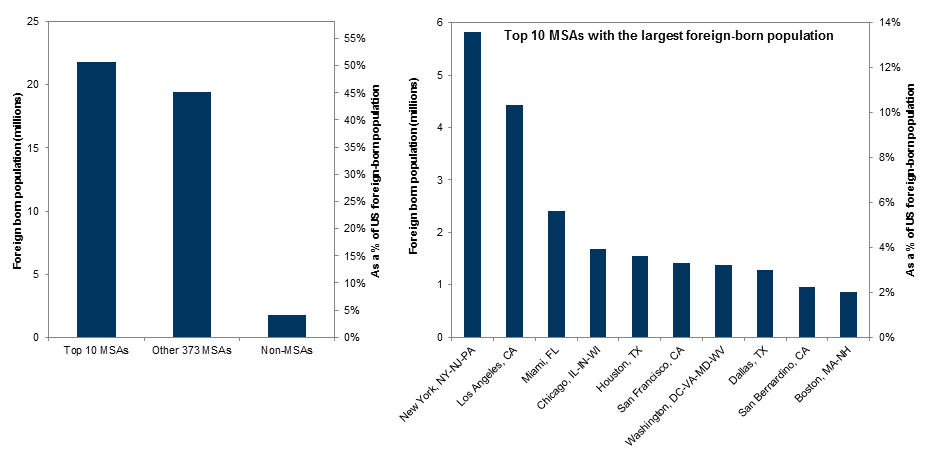
Exhibit 10: Earnings differential between foreign-born and native workers

Legal immigrants are often well educated and highly skilled
10. Earnings differential between foreign-born and native workers. Data available on request.
Data are the average of annual earnings differentials for the 2015-2017 period
Source: US Census Bureau Current Population Survey, Goldman Sachs Global Investment Research

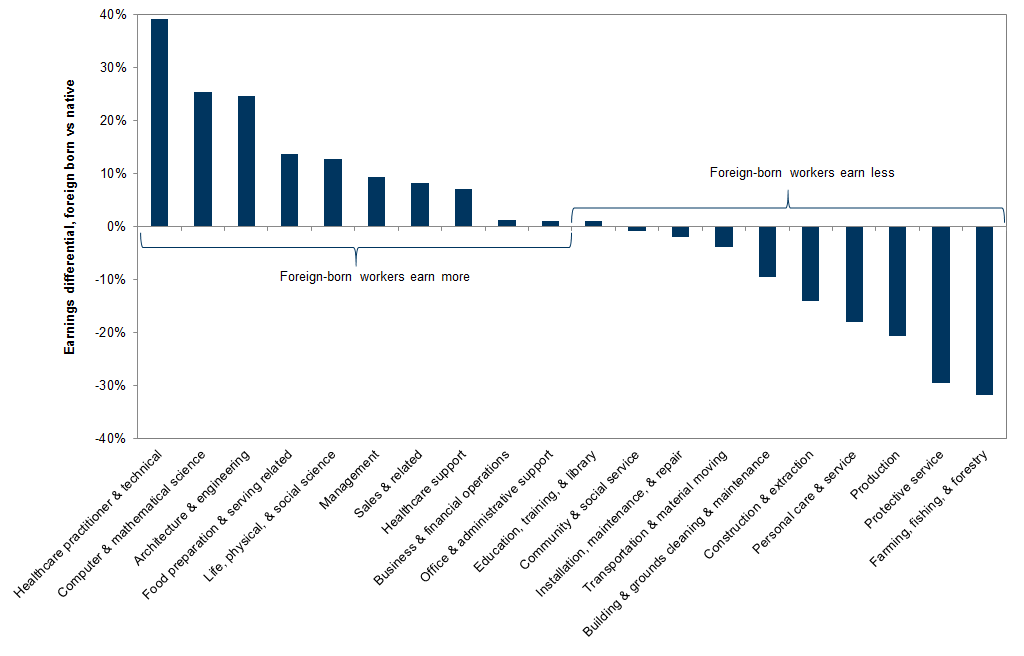
Exhibit 11: Earnings by occupation, native vs foreign-born

11. Earnings by occupation, native vs foreign-born. Data available on request.
Data are three year averages for the period 2015-2017
Source: US Census Bureau Current Population Survey, Goldman Sachs Global Investment Research
In the longer term, immigrants contribute to the US economy not only through their own labor, but also by bringing their offspring into the workforce. Immigrants have a higher average birth rate than the native US population, which will help to further expand the size of the US labor force over time. In addition, children of immigrants tend to do much better economically than their parents. Using cross-sectional data, Exhibit 12 shows that second-generation immigrants — defined here as native-born Americans with at least one foreign-born parent — earn significantly more than first-generation immigrants at almost every stage of the working-age period. Children of immigrants tend to be better educated, and better assimilated in language and culture, than their parents.

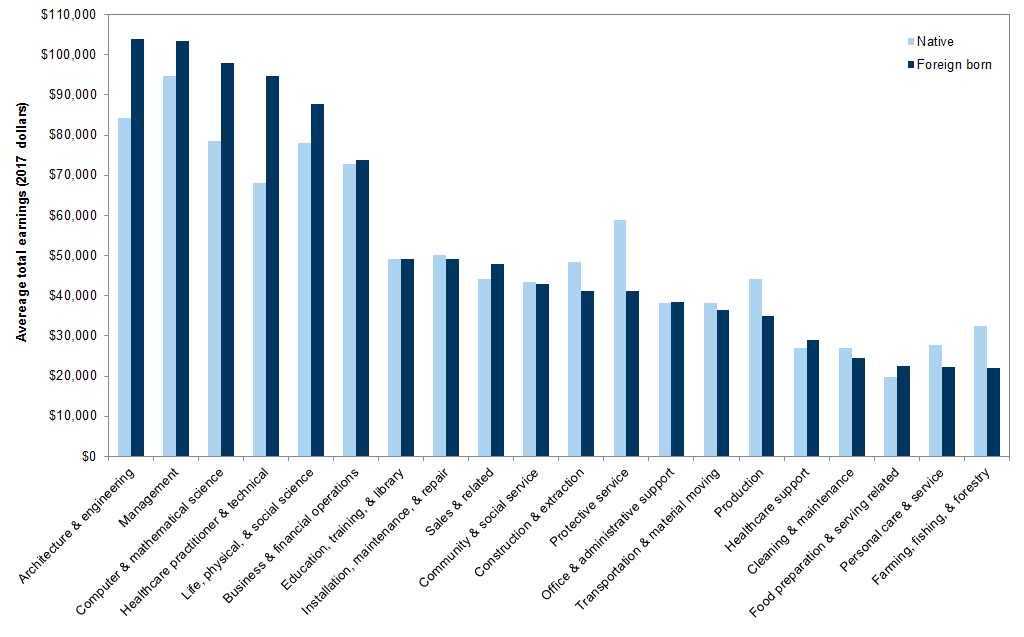
Exhibit 12: Earnings by age, first and second generation immigrants

12. Earnings by age, first and second generation immigrants. Data available on request.
Data are three-year averages for the period 2015-2017
Source: US Census Bureau Current Population Survey, Goldman Sachs Global Investment Research

Immigrants and educational attainment

Similar to that of occupation, foreign-born workers also have a bimodal distribution in educational attainment, with larger concentrations at both the highest and lowest education levels. According to data for the 2016-2018 period, 47.3% of foreign-born workers have a high school-level education or lower, while 15.2% have at least one advanced (graduate) degree. This compares to 32.8% and 12.8%, respectively, for native workers (Exhibit 13). Notably, foreign-born workers make up 41.2% of the US labor force that did not graduate high school, and 26.8% of those that earned a doctorate degree, both much higher than their 17.1% share of the overall US labor force (Exhibit 14). Please note that the data in Exhibits 13-18 include workers beginning at age 16. As such, some of those categorized as "no high school diploma" may still be in school.

Exhibit 13: Share of foreign-born labor force by educational attainment

13. Share of foreign-born labor force by educational attainment. Data available on request.
Data are three-year averages for the period 2016-2018.
Source: US Census Bureau Current Population Survey, Goldman Sachs Global Investment Research

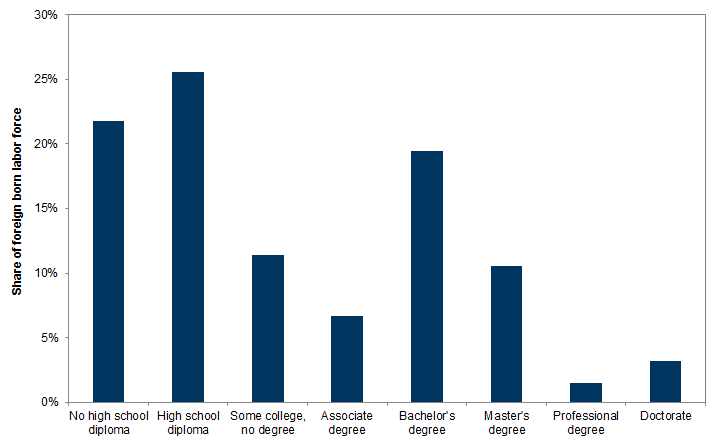
Exhibit 14: Foreign-born workers as % of the labor force by educational attainment

Bimodal distribution
14. Foreign-born workers as % of the labor force by educational attainment. Data available on request.
Data are three-year averages for the period 2016-2018
Source: US Census Bureau Current Population Survey, Goldman Sachs Global Investment Research
Over time, the foreign-born workforce has become much more educated. As shown in Exhibit 15, the number of foreign-born workers with doctorate degrees increased 120.9% over the past 15 years, while the number of master's degree holders increased 112.8%. Increases in native workers with these advanced degrees were 82.3% and 55.3%, respectively.
The numbers of foreign-born workers at lower levels of educational attainment have either increased by smaller amounts or decreased. However, because the native workforce at these education levels has experienced relatively larger reductions in percentage terms, the share of poorly educated workers who are foreign-born has increased as a result.

Exhibit 15: Change in the size of the labor force by educational attainment, native and foreign-born

For the period 2003-2018
15. Change in the size of the labor force by educational attainment, native and foreign-born. Data available on request.
Source: US Census Bureau Current Population Survey, Goldman Sachs Global Investment Research
Mean personal earnings for foreign-born workers increased substantially at the higher educational levels over the past 15 years, outpacing the increase for native workers at these levels (Exhibit 16). As of 2017, foreign-born workers on average earned more than their native counterparts at both the master's and doctorate degree levels (Exhibit 17); at the beginning of this period, the reverse was true. At lower levels of educational attainment, earnings grew by similar amounts for both native and foreign-born workers.

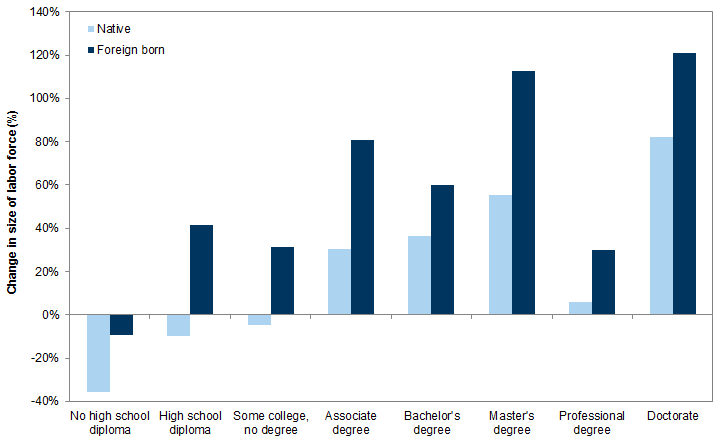
Exhibit 16: Changes in mean personal earnings, native vs foreign-born

For the period 2002-2017
16. Changes in mean personal earnings, native vs foreign-born. Data available on request.
Source: US Census Bureau Current Population Survey, Goldman Sachs Global Investment Research

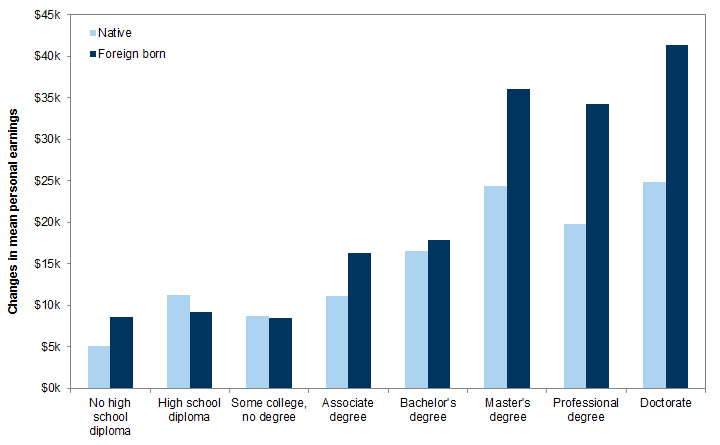
Exhibit 17: Mean personal earnings by educational attainment, native vs foreign born

17. Mean personal earnings by educational attainment, native vs foreign born. Data available on request.
Data are three-year averages for the period 2015-2017
Source: US Census Bureau Current Population Survey, Goldman Sachs Global Investment Research
A worker's income is determined not only by her level of education, but also by the field of study from which the degree is earned. Because foreign-born workers are increasingly concentrated in STEM fields, and are less likely to have studied or worked in lower-pay fields such as education and social sciences, they are likely to receive higher earnings, on average, than native workers with the same level of education. Moreover, as the US workforce has become more diverse, and business operations more global, the abilities of immigrants to deliver positive results and bridge cultural gaps for employers have become more recognized and rewarded. As a result, companies have become more open to hire and promote foreign-born workers than in the past.
Nevertheless, many foreign-born workers still face significant obstacles in the United States that limit their career opportunities and earning potential. Exhibit 18 shows that foreign-born workers have higher rates of unemployment than native workers at every advanced education level. Foreign-born workers are also more likely to become underemployed, defined as taking jobs below what their education and experience levels would otherwise warrant. The Migration Policy Institute estimated that underemployment costs college-educated immigrants over $39 billion a year in potential wages. This is particularly a challenge for immigrants educated outside the United States. For jobs that require professional licenses, foreign education and work experiences may be severely discounted by state-mandated occupational regulations. Often, non-US university degrees are deemed to be very hard to evaluate for US employment purposes. The lack of English proficiency and other skills may hinder an immigrant's ability to work in professions that require extensive levels of communication such as physicians and teachers. Employer bias towards immigrants may also be a factor.

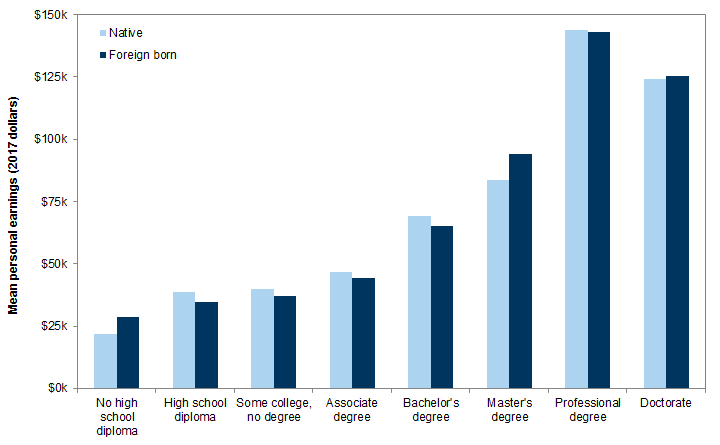
Exhibit 18: Unemployment rates, native vs foreign-born

18. Unemployment rates, native vs foreign-born. Data available on request.
Data are three year averages for the 2016-2018 period. Unemployment rates are for civilian labor force 16 years and older.
Source: US Census Bureau Current Population Survey, Goldman Sachs Global Investment Research

Role of immigrants in innovation

Foreign-born workers and entrepreneurs have made significant contributions to innovation in the United States, especially in the high-tech sector. There are many anecdotes of immigrants who have made transformative contributions to technological advancements in the United States through the companies or products they have created. A recent academic study found systematic evidence that immigrant founders are indeed more likely to engage in innovation and R&D activities than their native counterparts. Data from the Census Bureau's 2014 Annual Survey of Entrepreneurs, which included approximately 11,000 owners of 7,400 high-tech companies, showed that immigrant-owned businesses scored higher on every innovation measure except for copyright or trademark ownership (Exhibit 19).

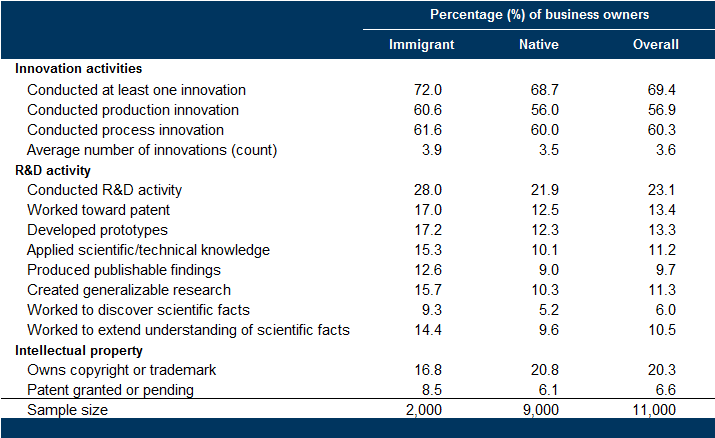
Exhibit 19: Innovation and R&D in high-tech industries

Immigrant entrepreneurs have a higher propensity for innovation
19. Innovation and R&D in high-tech industries. Data available on request.
Data are for the period 2012-2014
Source: Brown et al. "Immigrant entrepreneurs and innovation in the US high-tech sector" NBER working paper 25565

Trends in employment-based immigration

The Immigration and Nationality Act of 1965 established a US immigration policy that prioritizes family reunification. Since FY2005, an average of close to 1.1 million individuals have been granted lawful permanent resident status ("green card") each year. Approximately 65% of them are relatives of current US citizens and permanent residents, and many of them may not be of working age. Employment-based immigration, including people with extraordinary ability, advanced degrees, or investable capital, make up between 12%-16% of the annual total. The spouse and children of employment-based immigrants are also counted under this category. Approximately 10% of green cards are granted to resettled refugees.
Exhibit 20 shows the average yearly breakdown of legal immigration by type and class over the FY2015-FY2017 period. Except for immediate family members of US citizens, all major categories of legal immigration are subject to an annual cap. As shown in Exhibit 21, the number of people granted permanent resident status for employment reasons has fallen since FY2013.

Exhibit 20: Persons obtaining legal permanent resident status by type and class of admission

20. Persons obtaining legal permanent resident status by type and class of admission. Data available on request.
Data are 3-year averages for FY2015-FY2017
Source: US Department of Homeland Security, Goldman Sachs Global Investment Research

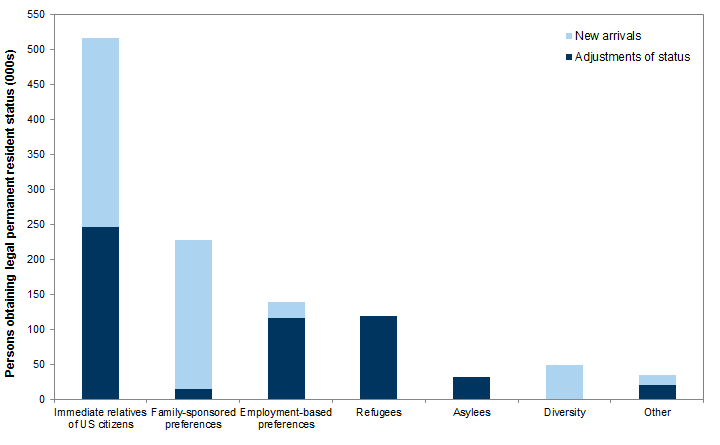
Exhibit 21: Trends in employment-based immigration

China and India are major sources of H1-B workers and international students to the US
21. Trends in employment-based immigration. Data available on request.
Source: US Department of Homeland Security, US Department of State, Goldman Sachs Global Investment Research
In addition to permanent residency, the United States issues several types of non-immigrant visas that allow foreign individuals to work and study in the United States temporarily. The H1-B program, for example, allows US companies to employ foreign professionals domestically for up to six years, and is often used to fill science and technology-related jobs where homegrown talent is in short supply. The number of H1-B visas issued for new applicants was capped at 65,000 annually by the Immigration Act of 1990, although subsequent legislation has temporarily adjusted this quota. Applicants who have met the relevant requirements are granted visas based on a lottery. An additional 20,000 H1-B visas are reserved for workers who have earned post-graduate degrees from US universities. Individuals who work at a college or university, or a nonprofit or governmental research institution, are also exempt from the cap.
The F-1 student visa allows foreign nationals to pursue full-time education in the United States. Over the past two decades, the size of the foreign student population in the United States has grown substantially, with the majority of students coming from Asian countries (Exhibit 22). The number of F-1 visas issued increased from 266,500 in 1997 to 644,200 in 2015, although it has dropped notably from this high since then.

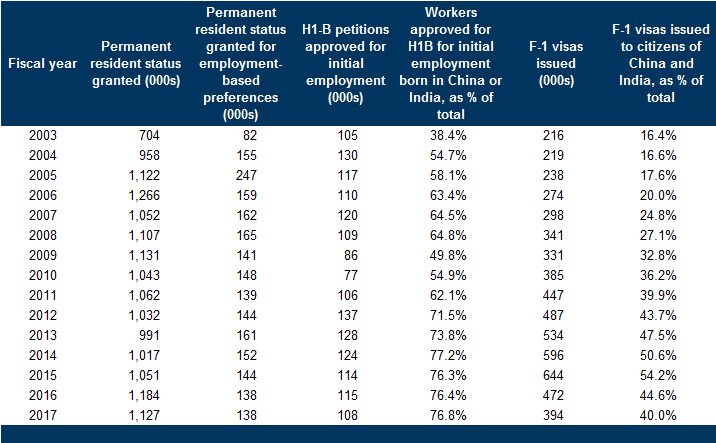
Exhibit 22: Student visas issued by country of citizenship

The majority of foreign students come from Asian countries
22. Student visas issued by country of citizenship. Data available on request.
Data are 3-year averages for FY2016-FY2018
Source: US Department of State, Goldman Sachs Global Investment Research
International students now make up a disproportionately large share of the total number of degrees earned in many STEM fields, particularly at the master's and doctorate degree levels. Exhibit 23 shows that in 2017, 58.2% of PhD degrees conferred by American universities in computer and information sciences, 56.6% in engineering, and 49.0% in mathematics and statistics were to foreign students. As such, these students have become a crucial source of professional talent in science and technology for US companies, and important contributors to research and innovation. The National Science Foundation reported that through 2013 about 75% of the PhD recipients in STEM stayed in the United States. Anecdotal data now show that foreign-born graduate students perceive increased difficulty in securing employment visas in the United States and have become somewhat less likely to stay.

Exhibit 23: Share of doctorate and master's degrees granted to international students

Top 10 fields with the highest concentration of foreign degree earners
23. Share of doctorate and master's degrees granted to international students. Data available on request.
Data for 2017
Source: National Center for Education Statistics (NCES), Goldman Sachs Global Investment Research
In recent years, approvals of H1-B visas for initial employment and the issuance of F-1 visas have both dropped (Exhibit 21). If such trends were to continue beyond the near term, concerns may rise about the United States's ability to sufficiently attract and retain top talent from around the world.
In the longer term, the average age of US native workers will continue to increase. And, there will be intensified global competition in science and technology. As in the past, immigration can play an important role in boosting US labor force growth, innovation, and economic leadership.
  1. 1 ^ Germany, which experienced dramatic political strains after accepting a significant number of asylum seekers from Middle Eastern and North African countries during 2015-2018, may benefit from the resulting growth of its labor force over the coming years.

Investors should consider this report as only a single factor in making their investment decision. For Reg AC certification and other important disclosures, see the Disclosure Appendix, or go to www.gs.com/research/hedge.html.