
The Bigger Picture
UK Social Mobility — A Tough Climb
The UK performs poorly on international comparisons for both social mobility and inequality. The poorest and the richest are the most socially immobile. This exacerbates inequality as disadvantaged individuals are less likely to climb the income ladder, and the economically advantaged tend to stay at the top.
According to surveys, covid is increasing inequality further, and people in the North of England are more likely to report adverse impacts on education and employment than people in the South.
Recent rises in inflation, especially energy costs, are intensifying the problem: real pay has fallen by c.4% over the last year for households in the lowest 10% of the income distribution.
Inequality in recent years has been exacerbated by the moves in asset prices (persistent and strong) versus real wage growth (low). Central Bank QE was originally conceived to enhance productivity and wages by bringing down borrowing costs and encouraging investment. Instead, it has pushed up asset prices (which favours wealthier asset-owners) but without the investment; capex/sales is at a low in the UK and has fallen behind other regions.
But, corporate managements are starting to focus on social issues (encouraged by the flows into ESG funds). Companies increasingly mention stakeholders rather than shareholders, more than 55% of FTSE 100 companies have diversity targets and 65-70% have internal promotion and flexible work schemes. We have also started to see investment intentions pick up in survey data and the potential to bring back supply locally or make supply chains more resilient may also increase employment opportunities in the UK.
We highlight examples of companies whose businesses are enablers of greater social mobility.
How Socially Mobile is the UK?
The majority of people would agree that talent and hard work rather than social background should determine success. However, the UK currently stands towards the bottom of the international league for both social mobility and inequality. Substandard education in less prosperous areas, economic shocks that have hit disadvantaged households harder, and employers underinvesting in their workforce can all have potentially harmful effects on social mobility. We take stock of the UK’s performance on social mobility metrics, investigate the potential impacts of covid, and discuss possible government policy reactions.
What is social mobility? How is the UK performing?
What is social mobility? Put simply, it means doing better or worse in terms of lifetime outcomes than one’s parents. While the political debate often focuses on moves up the social ladder, social mobility should also consider whether better-off families retain their socio-economic position. A frequently used indicator of social mobility is the intergenerational elasticity of income (IGE), which measures how much children’s income depends on the income of their parents. In other words, it is a measure of intergenerational income persistence and reflects the extent to which parental earnings are transmitted to the next generation. A high IGE value (closer to 1) indicates higher persistence in incomes across generations, and therefore less mobility.
Exhibit 1 presents average IGE estimates across countries compiled recently by academic researchers. The UK performs poorly in terms of income mobility relative to other developed countries, with only the US and Switzerland having lower mobility scores.
Exhibit 1: UK has Lower Social Mobility Compared with Other Developed Countries
(IGE) Intergenerational elasticity of income, indicates persistence in incomes across generations
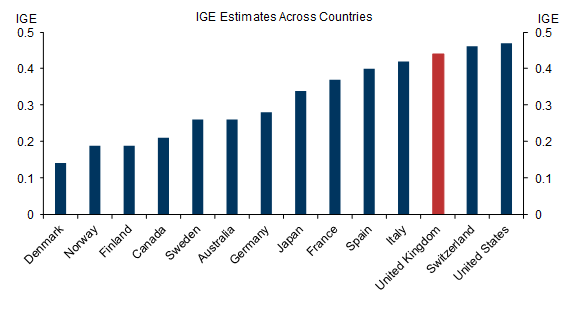
Source: Goldman Sachs Global Investment Research, Jan Stuhler (2018)
Exhibit 2 shows the Great Gatsby Curve, introduced in a speech by Alan Krueger in 2012, demonstrating the strong link between inequality (measured by the Gini coefficient, which captures income dispersion) and IGE across countries. Countries with lower social mobility also tend to have higher inequality, and the UK performs relatively poorly on both measures. While measuring “happiness” is particularly challenging, researchers have found that there is a fairly strong correlation between social mobility and happiness. The happiest countries tend to be the more socially mobile countries, such as Finland and Denmark.
Exhibit 2: The Great Gatsby Curve Shows the UK at the Extreme End
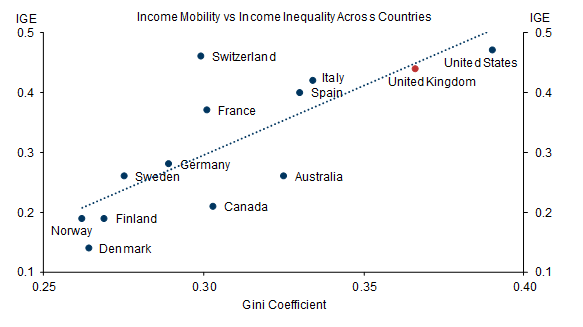
Source: Goldman Sachs Global Investment Research, Jan Stuhler (2018), OECD
There is little consensus on the cause of the UK’s relatively poor performance on both social mobility and inequality metrics. Some researchers argue it is due to the combination of strong education transmission between generations and the significant earnings premium for graduate-level jobs, other researchers have pointed to the large regional income differences in the UK and the growth of service-sector jobs in the South, and others have noted the more progressive tax system in countries with more social mobility (for example, Denmark, Finland and Norway).
Turning to the experience within the UK, researchers analysing IGE across the UK’s earnings distribution find that this intergenerational persistence of income varies significantly by socio-economic background. In particular, as Exhibit 3 illustrates, there exists a well-documented J-shaped relationship between parental income and children’s income across the distribution of children’s earnings, i.e., social mobility is lowest for the poorest and richest households. This phenomenon exacerbates social inequality as it means that disadvantaged individuals are less likely to climb up the income ladder and those that start life relatively more advantaged tend to stay at the top of the income ladder. For middle-income households, social mobility is relatively high (low IGE).
Exhibit 3: Social Mobility is Low Both at the Top and Bottom of Income Distribution in the UK
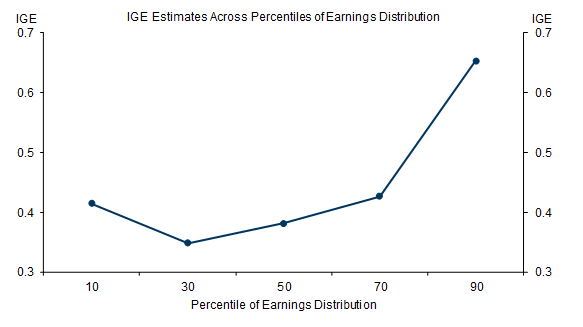
Source: Goldman Sachs Global Investment Research, Paul Gregg et al. (2019)
Perceptions of social mobility are also quite poor. The UK’s Social Mobility Commission reports that last year only 35% of adults in the UK believe that everyone has a fair chance to go as far as their hard work will take them, and 46% said that where you end up in society is mainly determined by your background and who your parents were.
In terms of potential solutions, education is generally agreed to be a pathway to improving social mobility but it is a necessary condition rather than a sufficient one. Recent research has shown that it isn’t enough to increase educational attainment, as graduates with the same degree have been shown to have significantly different life outcomes depending on the income of their parents. This suggests that socio-economic backgrounds still matter, perhaps due to children from higher-income households being better able to benefit from networks, having more opportunities to gain non-cognitive/soft skills, seeking out jobs further away from home, and facing fewer cultural barriers. In addition, they may have the financial backing/resources to take low-paying jobs while they build up experience.
Social mobility and income inequality likely hit by covid
Exhibit 4 shows that just before the pandemic (latest ONS data available), income inequality increased to the highest reported level over the last ten years. However, it remained below the level experienced during the Global Financial Crisis. Wealth in the UK is more unequally divided than income. Indeed, recent ONS data show that the wealthiest 10% of households hold 43% of all UK wealth, whereas the bottom half of the distribution owned less than 10%.
Exhibit 4: Inequality has Increased in the UK in Recent Years
The Gini index is a measure of income distribution across the population ranging from 0 to 100, with 0 representing perfect equality and 100 representing perfect inequality
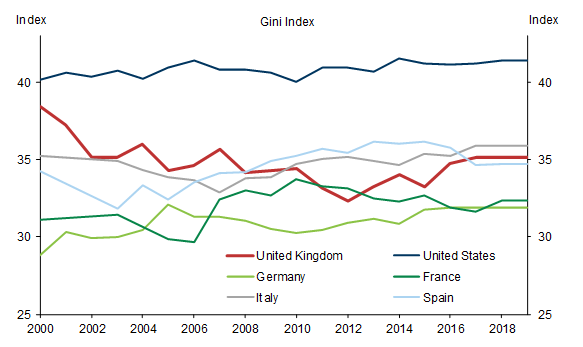
Source: Goldman Sachs Global Investment Research, Our World in Data
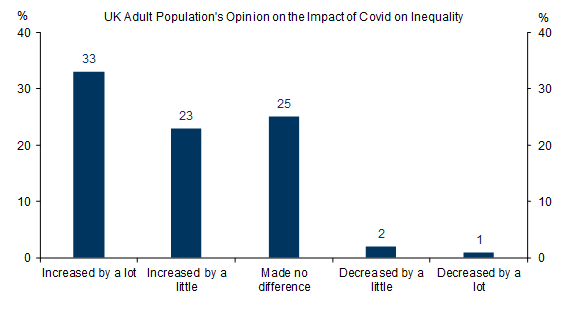
Covid has accentuated many of the existing social mobility issues in the UK. Exhibit 5 shows recent survey data from YouGov, showing that over half (56%) of the UK population think that covid has increased social inequality. This is consistent with evidence that covid has had a larger impact on lower-income jobs (as they tend to be consumer-facing, rather than office-based) and it has been reported that there is higher incidence of the virus in poorer households.
Exhibit 5: Covid Viewed as Having Increased Inequality
Source: Goldman Sachs Global Investment Research, Social Mobility Commission
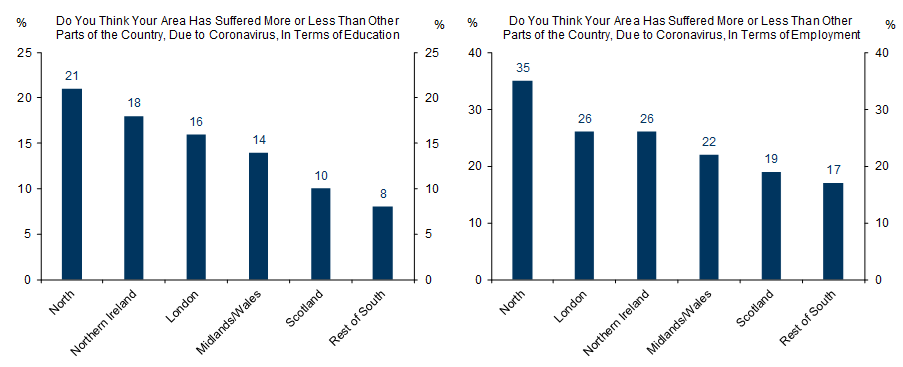
There are also clear indications of significant differences between UK regions. Exhibit 6 (right) shows that 35% of people living in the North of England think that covid had impacted employment in their area more than in other parts of the country, whereas the corresponding figure for the South is only 17%. On the impact on education (Exhibit 6, left), 21% of people in the North think that they have suffered more during the pandemic, compared with only 8% in the South.
Exhibit 6: People in North Report Higher Covid Impact
Source: Goldman Sachs Global Investment Research, Social Mobility Commission
Turning to the differential impact by age, academic research has shown that those aged 16-25 were more than twice as likely as older employees to lose their job during the covid crisis. Around one in ten young workers suffered a job loss, and just less than two-thirds experienced a fall in their incomes. The IFS has noted that lockdowns and covid restrictions have tended to have larger impacts for the younger, lower-earning and less educated workers. In sum, the impact of covid on labour market outcomes has tended to be more severe for disadvantaged individuals, leading to an exacerbation of inequalities in the UK.
Will higher wages and a tight labour market help?
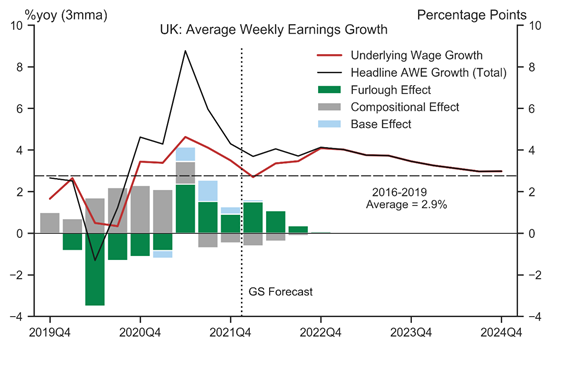
More recently, Exhibit 7 shows that wage growth has been very strong in the UK, reaching record highs last summer. However, the earnings data are difficult to interpret as shifts in the composition of employment, the furlough scheme and base effects all continue to distort official estimates. That said, we expect our measure of underlying wage growth—which removes these distortions—to remain close to 4% over the course of 2022, before gradually falling towards its historical average of around 3% next year (red line in Exhibit 7). Furthermore, in its recent Monetary Policy Report, the BoE estimated that underlying wage growth would firm to 4¾% this year, somewhat above our projection.
Exhibit 7: Underlying Wage Growth Remains Strong, And Is Currently Tracking At Just Over 4%YoY
Source: Goldman Sachs Global Investment Research, Haver Analytics
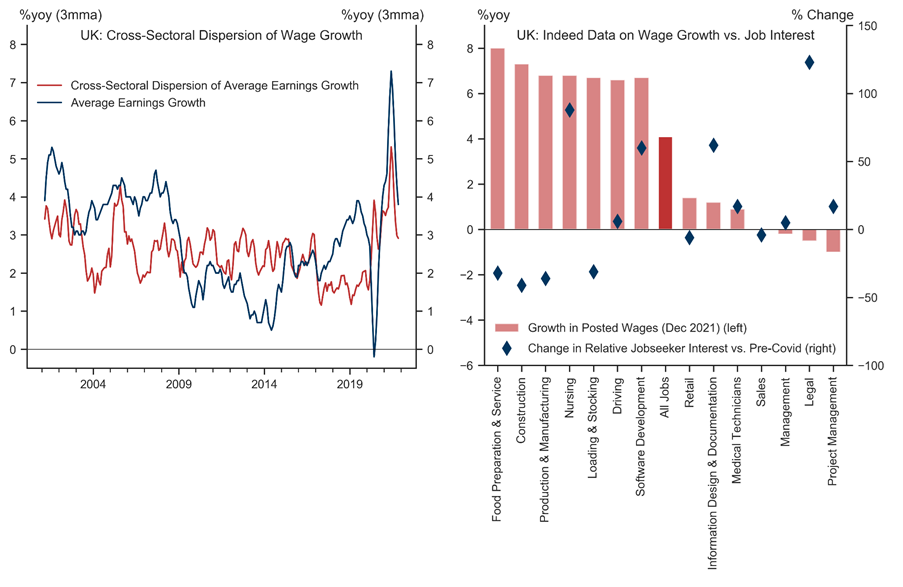
However, these strong wage gains have not been experienced in all sectors of the economy. Exhibit 8 (left) shows that last year’s spike in average wage growth was accompanied by a significant rise in dispersion. This suggests that some sectors experienced very strong wage pressures, but others did not. Researchers from the Indeed Hiring Lab have reached a similar conclusion using a very rich dataset of online vacancy postings (Exhibit 8, right). While they find average year-on-year growth in posted wages in December of 4.1% (a touch higher than the latest official data), many jobs experienced less than a 2% increase in posted wages, whereas others have seen wage growth in the range of 6-8%. The strongest wage gains tended to be in sectors with severe shortages of qualified applicants for jobs.
Exhibit 8: Dispersion of Wage Dynamics Still Relatively High
Source: Goldman Sachs Global Investment Research, Haver Analytics, ONS, HMRC, Indeed
From April 2022, a number of minimum wages will be increased, by around +4% for those aged under 20, +9.8% for those aged 21-22, +6.6% for those aged 23 or above, and by around +12%yoy for apprentices—broadly comparable to or somewhat higher than the annual increases pre-pandemic (Exhibit 9, left). The UK has a relatively high minimum wage, with the eighth-highest adult minimum wage out of the 25 OECD countries before the pandemic. Academic research suggests this could help to lower wage inequality by benefiting low-paid workers more broadly not just those in receipt of the statutory minimum wage. While some researchers have argued that Brexit would lead to a mass exodus of EU migrants, we expect the magnitude to be much smaller and for some offset given higher non-EU net migration (Exhibit 9, right).
Exhibit 9: Minimum Wages Set to Grow Strongly; Offsetting Migrant Employment Flows
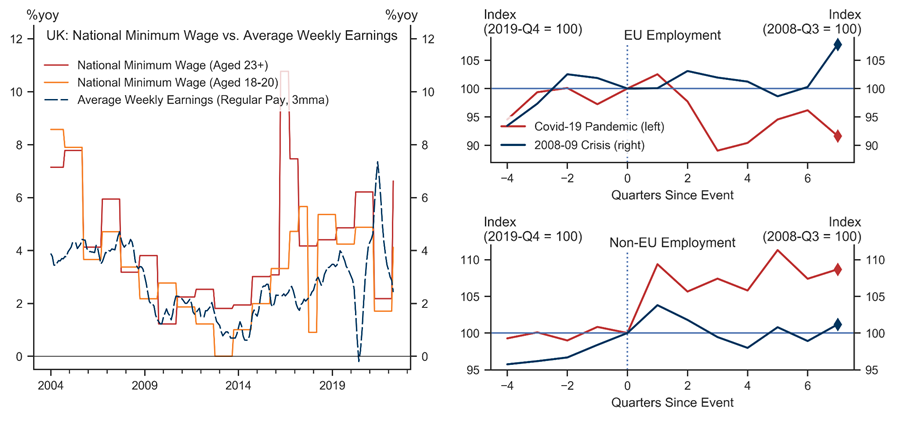
Source: Goldman Sachs Global Investment Research, Haver Analytics, ONS
Exhibit 10 (left) shows real-time administrative PAYE data for the 10th, 50th and 90th percentile of the income distribution. The cumulative pay increase for low-income earners has been notably soft since the start of the pandemic, although there was a spike in low-income wages during the reopening-driven sharp rebound in demand in 2021. In addition, households at the lower end of the income distribution tend to have substantially lower or no savings (Exhibit 10, right). That said, from this April, a number of minimum wages will be increased: by around 4% for those aged under 20, 9.8% for those aged 21-22, 6.6% for those aged 23 or above, and by around 12%yoy for apprentices. Academic research suggests this could help to lower wage inequality by benefiting low-paid workers more broadly not just those in receipt of the statutory minimum wage.
Exhibit 10: Significant Differences Across the Income Distribution
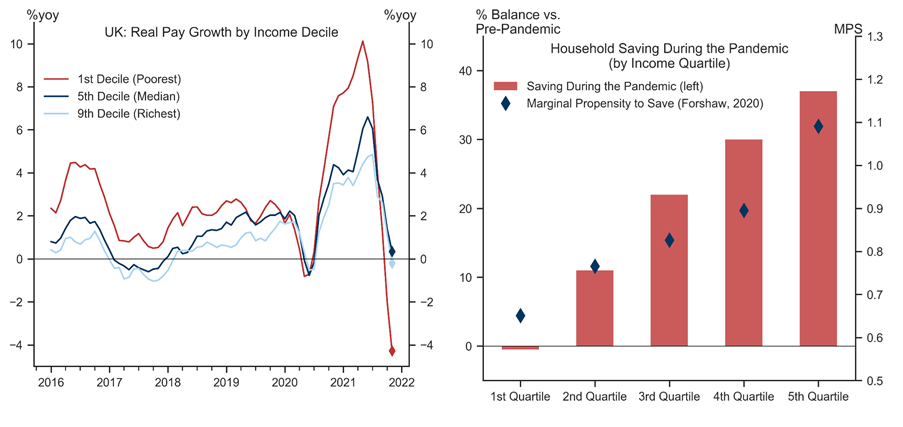
Source: Goldman Sachs Global Investment Research, Haver Analytics, Foreshaw (2020), Bank of England, IFS
However, these strong wage gains will not necessarily boost real take-home pay for all households given inflation is likely to rise to around 8% in April (Exhibit 11, left). Rising energy prices are a particular concern and tend to have a large impact on households at the bottom of the income distribution. In previous research we have estimated the impact of higher energy prices on household incomes. Exhibit 11 (right) shows that the hit to disposable incomes is larger in the UK than in the Euro area, and will be more protracted given the mechanism of six-monthly updates to the energy price cap (April and October).
Exhibit 11: High Inflation, Large Hit to UK Incomes
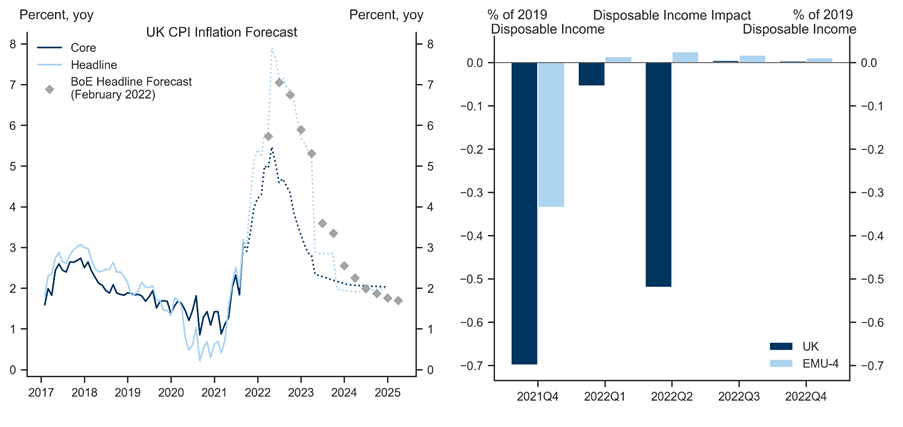
Source: Goldman Sachs Global Investment Research, Haver Analytics, Bank of England
Lower-income households are more reliant on income for everyday purchases and tend to cut spending more in line with changes to their income. Exhibit 12 shows academic estimates of this impact through what economists term the marginal propensity to consume (MPC). The charts show that the MPCs are higher for poorer households and that the impact on goods purchases is particularly pronounced for households in the bottom income decile. Critically, households in the top decile are more likely to adjust services spending in response to changes in their income streams.
Exhibit 12: Poorer Households Are Likely To Cut Spending Disproportionately
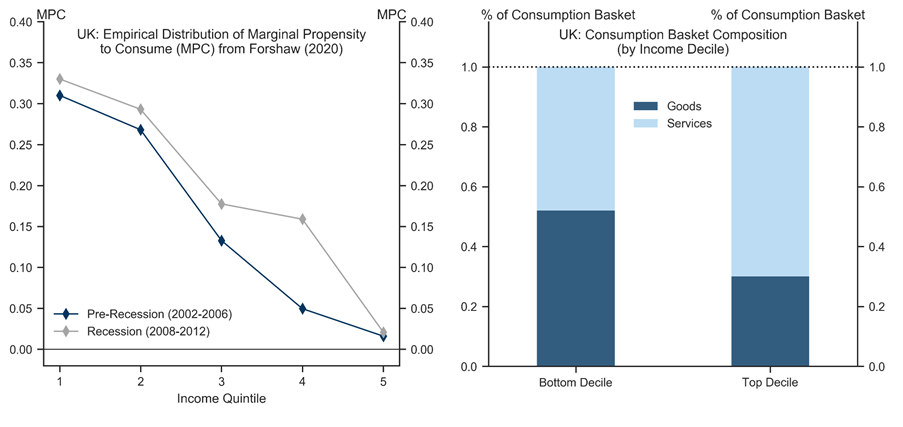
The estimates in the left chart are from Rachel Forshaw (2020), \\\"Essays on heterogeneity over the business cycle\\\", PhD Thesis, University of Edinburgh.
Source: Goldman Sachs Global Investment Research, Foreshaw (2020), ONS
Recent research by the Resolution Foundation has shown that households in the bottom half of the income distribution are likely to be net beneficiaries from the impact of various fiscal policies enacted over 2022-23, as a rise in National Insurance contributions from April for these households should be more than offset by income inflows via policies such as Council Tax rebate, Energy Bills rebate, and the Warm Homes Discount changes (for the poorest households) (Exhibit 13, left). That said, higher energy bills will likely weigh on the spending power of the average household, with around 1.6pp more of disposable income than usual spent on energy bills and a net drag on income of around 0.2pp from various policies (Exhibit 13, right).
Exhibit 13: Energy and Tax Changes Hit Lower-Income Households Hardest
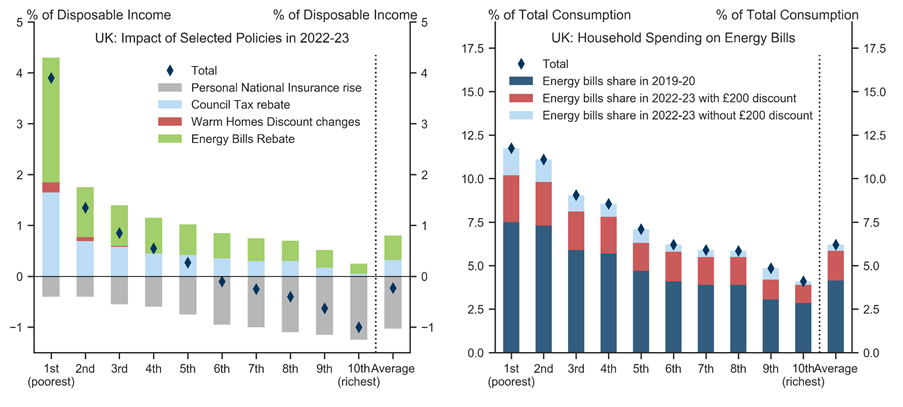
See \\\"The price is right? The April 2022 energy price rise and the Government’s response\\\", 4 February 2022, Resolution Foundation.
Source: Goldman Sachs Global Investment Research, Resolution Foundation
Despite the likely reduction in spending and potential hardship for households at the lower end of the income distribution, we remain constructive on the UK’s economic outlook. We expect aggregate consumption to be fairly resilient to the cost-of-living pressures, as services consumption of higher-income households (given high savings and a significant shortfall relative to pre-pandemic levels) is likely to offset any slowdown in spending for lower-income households. In addition, high savings and availability of credit should act to buoy aggregate consumption.
Politics and Policy
While it is particularly difficult to parse out the impact of covid and Brexit at this juncture, we continue to expect Brexit to lower trend growth by holding down investment and net migration over the medium run. As such, we think Brexit will reduce the level of GDP by about 3½% over the next few years.
Exhibit 14: Conservatives Gained Support in Lower-Income Regions in the 2019 General Election
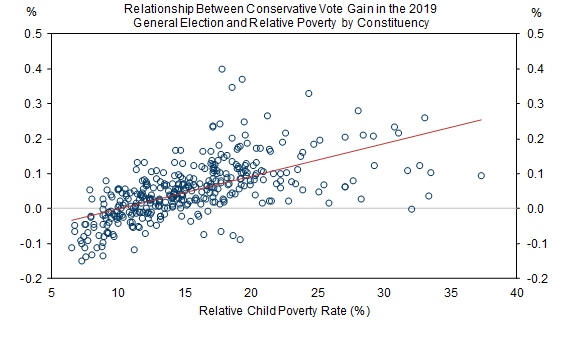
Source: Goldman Sachs Global Investment Research, ONS, House of Commons Library
A potential silver lining to Brexit is that we are now in a situation where both political pressures and economic needs are pulling in the same direction. Indeed, in contrast to traditional voting patterns, the 2019 general election witnessed a substantial shift in support for the Conservative Party towards lower-income regions. Exhibit 14 illustrates that the government’s vote gain in the 2019 elections across regions was positively correlated with regional poverty levels. If the government is able to successfully implement policies that can spur business investment, create new jobs, and re-skill and retrain workers, then there is the potential to mitigate Brexit headwinds and boost the post-covid recovery. The recent white paper on “Levelling Up the United Kingdom” outlining the government’s vision through twelve missions, is a step in this direction. However, it is yet to be determined how these programmes will be funded.
What can the government do? The UK’s social mobility commission has argued that in the post-covid recovery the “country cannot rebuild itself after such an enormous shock without making sure that addressing social inequality is at the top of the agenda”. Potential areas for policy to focus include:
Improving geographical inequality by increasing public investment in less prosperous regions of the UK.
Ensuring benefits are well targeted and reducing child poverty.
Education is focused on equalising opportunities and improved access for children from lower-income households.
Apprenticeships and re-training programmes are focused on people from disadvantaged backgrounds.
High-quality digital access to less-wealthy households and those living in more remote locations.
Social Mobility: Asset markets & Corporates
Asset market returns have exacerbated inequality
Asset markets have performed exceptionally well in recent years, with returns on equities, bonds and private markets more than doubling in just over a decade (Exhibit 15). Strong asset markets have in part been a function of supportive global policy conditions – low interest rates and central bank bond buying. In contrast, price rises in the real economy have been subdued; wage inflation since 2009 has not kept pace with either CPI or RPI inflation, so wages have fallen in real terms. Even house prices, which have been strong, have not kept pace with global equities.
Exhibit 15: Asset Markets have Performed Exceptionally Well in Recent Years, While Wages have Stagnated
Total return performance since 2009, in GBP
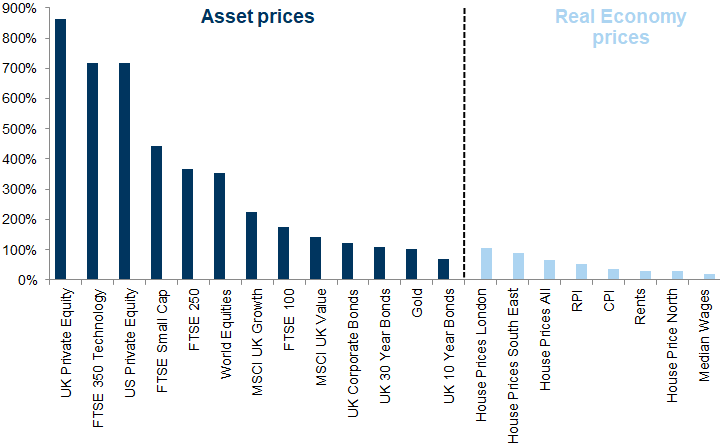
Source: Datastream, Haver Analytics, Goldman Sachs Global Investment Research
Asset market inflation has in many ways helped to entrench wealth inequalities. In the years since the GFC, the wages of workers in the lowest 10% or 25% of earners have increased more than those in the top 10% and 25% based on wages. The salary or income gap has narrowed in the past decade (having widened notably in the previous two decades). But the wealth gap has widened given that those with wealth (assets) have been able to take advantage of the rise in house prices and the rise in asset prices such as equities and bonds.
Indeed, the more specialist or risky assets such as private equity, small caps or technology stocks have been by far the strongest in terms of performance. Lower-income households are more exposed to the right-hand side of Exhibit 15, and while higher-income households may not have benefited from high wage inflation in recent years, they tend to be the beneficiaries of asset growth and house price appreciation.
That said, this is not restricted to the UK: the inequalities from vastly divergent wealth distribution are greater in the US – something our US colleagues highlighted in Black Womenomics and in Wealth and equity flows: How the top 1% of households compares with the rest.
Lack of investment hasn't helped
Needless to say, the aim of central bank and government policy was not to widen wealth gaps. One of the original arguments for central bank asset purchases was that lowering the cost of borrowing would lead to more investment and ultimately improve economic growth, enhance labour productivity and therefore wage growth. But, while corporates are benefiting from a lower cost of borrowing (Exhibit 16), their investment to sales ratio remains exceptionally low (Exhibit 17) – with the UK falling behind other developed markets.
Exhibit 16: Cost of Borrowing for UK Companies has Fallen
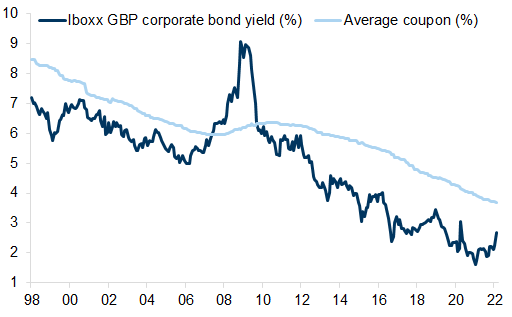
Source: Datastream, Goldman Sachs Global Investment Research
Exhibit 17: Race to the Bottom: The Investment to Sales Ratio is at a Low
Capex / Sales (excluding Financials and Basic Resources companies)
Source: Datastream, Worldscope, Goldman Sachs Global Investment Research
The corporate sector as a barrier to social mobility...
There are numerous ways in which the corporate sector has evolved in recent years that have worked against equality and social mobility. It's not that these changes were designed or intended to do that, but to varying degrees they have worked against equality or social mobility:
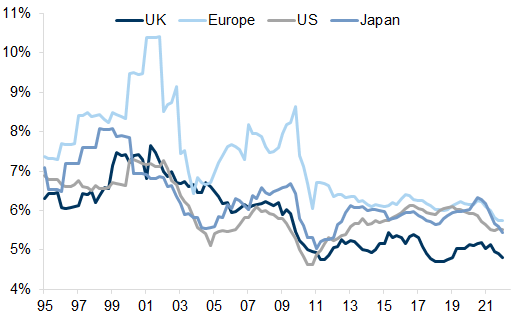
Pension benefits: Fewer defined benefit (DB) pensions (Exhibit 18) – the move to defined contribution shifts the risks to the employee and often the resultant pension available is lower. This of course hits all employees and isn’t just a problem for lower-income households. Indeed, DB pensions were more the preserve of middle-income households historically. But for those lower-income households that may previously have enjoyed a DB pension the lack of this safety net and the greater uncertainty is arguably worse. In addition, higher-income households are in a better position to top up their pension if it is under-provisioned.
Bargaining power: Trade union membership has fallen, which means less ability for workers to negotiate wages collectively and potentially less job protection for employees. That said, most of the declines in union membership happened in the 1980s/90s – levels have been more static in recent years (Exhibit 19). Also, current membership is often higher among more disadvantaged groups – for example, women and people with disabilities, while the proportion of employees who are trade union members is highest in the Black or Black British ethnic group.
Exhibit 18: Fewer Defined Benefit Pensions, Although More People Now have Some Pension Provision
(%) Proportion of employees with workplace pensions by type of pension
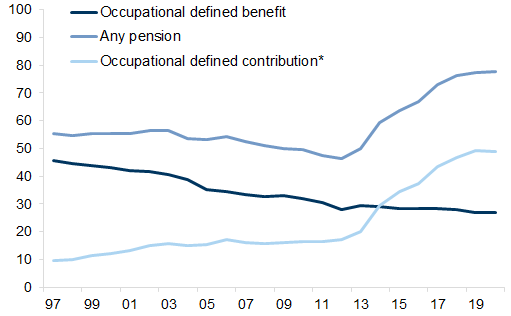
*Occupational defined contribution (inc Nest) + Group personal, stakeholder and self-invested personal pension
Source: ONS, Goldman Sachs Global Investment Research
Exhibit 19: Trade Union Membership has Fallen But Levels have Slightly Increased in Recent Years
Thousands
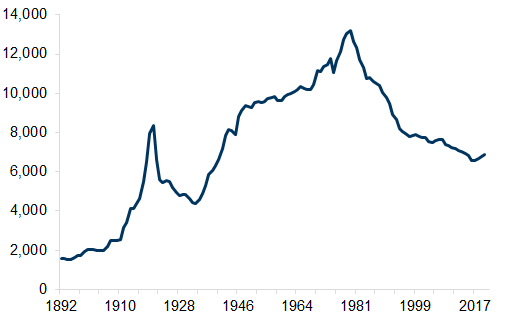
Source: UK Department of Employment Statistics Division, UK Certification Office, Goldman Sachs Global Investment Research
Changing employment contracts: Self-employment has risen and so has the use of zero-hour contracts (Exhibit 20). One can argue these provide workers with flexibility and are desirable if employment/opportunities are to respond to changing demands. But it also means less security for workers, many of whom are on lower incomes, and it may also disincentivise investment in skills or training by companies if their workforce is more peripatetic. That said, while zero-hours contracts may have risen, they account for only 3% of employment and this proportion has been roughly static for 5 years.
Exhibit 20: The Use of Zero-Hour Contracts has Risen, as has Self-Employment
% of employment
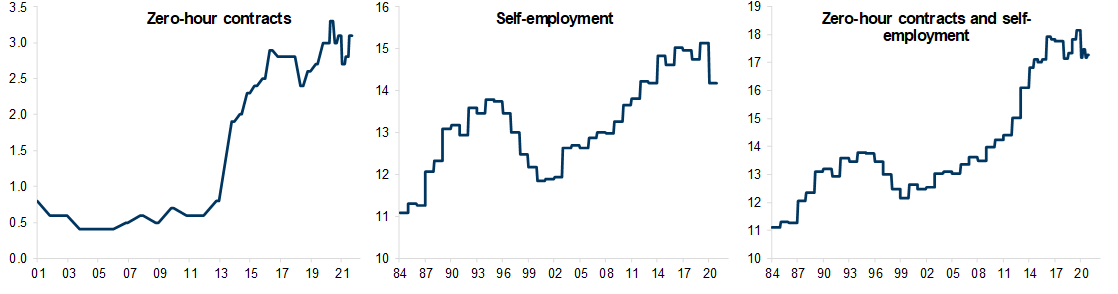
Source: Haver Analytics, Goldman Sachs Global Investment Research
Ownership: This is in many ways one of the most dramatic and under-appreciated changes. Around 65% of the UK stock market is held by non-UK shareholders, which compares with just 18% foreign ownership in 1995. Global shareholders are arguably less likely to be focused on progress or equality goals in the UK. Capital in general has become more global, but in doing so may have become more fickle or short-term, as investors look for the best near-term opportunity rather than a longer-term investment where owners of the capital feel responsible for the welfare of the employees in the domestic country (Exhibit 21). In addition, passive ownership is rising with the growth of index trackers and ETFs, and again these are designed to track indices in a low-cost way, not to seek the best management or influence company policies.
Exhibit 21: Ownership of UK equities has Changed - Non-UK Owners Dominate
Last datapoint is Q4 2021
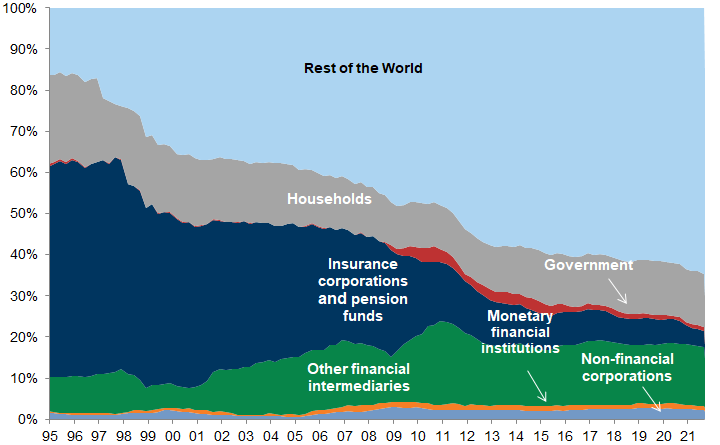
Source: Haver Analytics, Bank of England, Goldman Sachs Global Investment Research
Exhibit 22: Cumulative Flows from Global Investors into UK Equity Funds
Weekly flows since 2007, EPFR Country Flows
Source: EPFR, Haver Analytics, Goldman Sachs Global Investment Research
Taxation: Corporates are paying lower corporation tax in recent years, which in turn means a lower contribution to the fiscal pot for re-distribution. That said, the UK is not unique in this regard and arguably without a competitive tax rate the UK would attract less investment and therefore would have lower growth and incomes (Exhibit 23).
Use of cash: Companies have increased the share of their cash flow that goes to shareholders via dividends or buybacks rather than growth-related uses of cash such as R&D or capex – this could be seen as favouring short-term holders of capital rather than longer-term stakeholders of the economy, including employees, whose productivity and wages tend to be enhanced by greater investment (Exhibit 24).
Exhibit 23: The Major Equity Indices have Seen a Decline in the Effective Tax Rate
Effective tax rate for companies with a positive tax rate below 100%. Current constituents (ex Energy and Basic Resources).
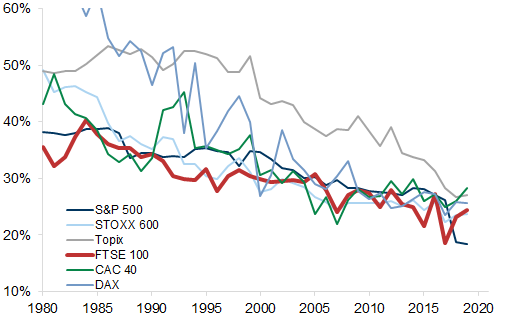
Source: Datastream, STOXX, Worldscope, Goldman Sachs Global Investment Research
Exhibit 24: The Growth Investment Ratio for FTSE 350 has declined considerably since 2016
Growth Investment Ratio = [Capex (minus depreciation) + R&D]/Cash Flow from Operations
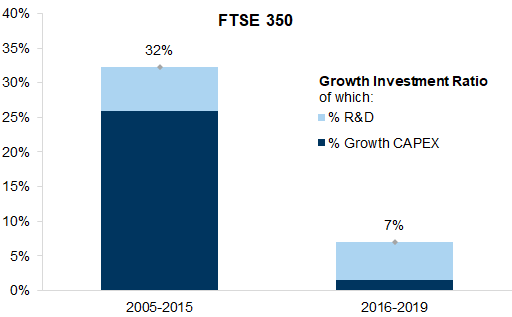
Source: FactSet, Datastream, Goldman Sachs Global Investment Research
The upshot is that companies have not invested, and work is somewhat more precarious than historically, with fewer safety nets, such as a guaranteed pension or trade union membership; and domestic longer-term shareholders have largely exited the market, such as pension funds and insurers.
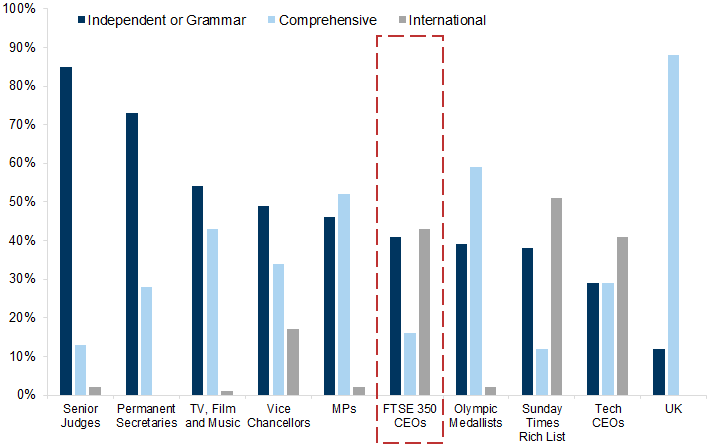
Senior positions are filled predominately by those with a more privileged background, according to the Sutton Trust report on the educational background of senior people in various professions. As we show in Exhibit 25, around 40% of FTSE 350 CEOs attended either an independent/private school or a grammar school in the UK. Only 16% went to a UK comprehensive school, compared with 88% for current UK students.
We find that more FTSE 350 CEOs have an international background than people in other senior positions – such as MPs or judges.
Exhibit 25: Only 16% of FTSE 350s CEOs went to a UK comprehensive school
Source: The Sutton Trust and the Social Mobility Commission, Goldman Sachs Global Investment Research
...Or a facilitator of equality and social mobility
But it is not all one way: on the other side, corporates have become more engaged with social issues. The pandemic has increased this focus but it was already a growing mandate for managements prior to the pandemic. There are many recent changes that have improved, or are likely to improve, opportunity and mobility for employees:
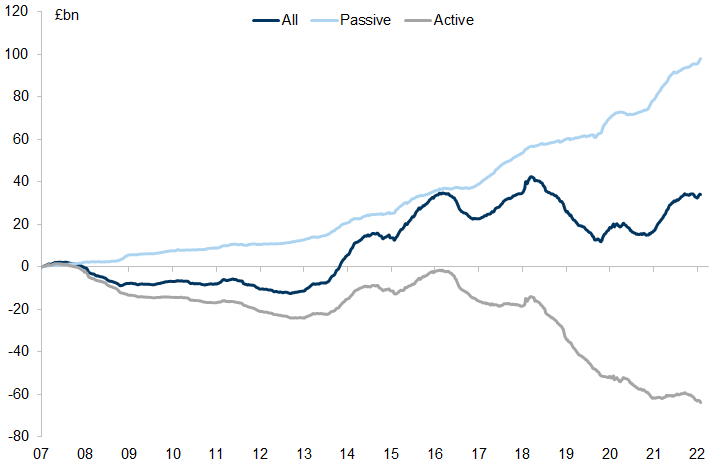
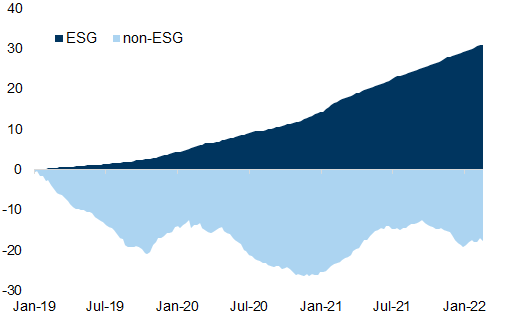
ESG flows: Flows into ESG funds, both passive and active, are pushing corporates to pay more attention to the social aspects of their businesses both internally (how they treat, promote, train their workers) and externally (their impact on society). In net terms all the flows into UK equities from funds globally have been into ESG/SRI funds (Exhibit 26).
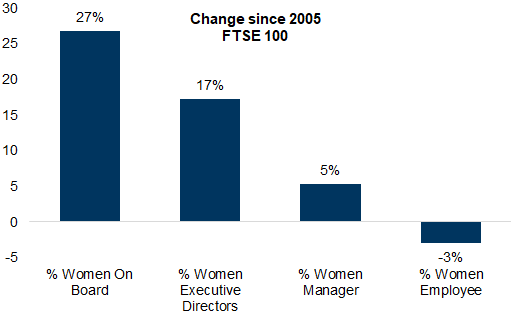
Improving diversity: Corporates increasingly have targets for diversity and are measuring current levels and targeting improvement. We can see improvements in certain targeted areas, such as the growth of women's representation in more senior positions (Exhibit 27).
Exhibit 26: ESG Funds Growing Steadily, While All Others are Seeing Outflows
Cumulative flows into UK equities, USD bn
Source: EPFR, Goldman Sachs Global Investment Research
Exhibit 27: The Largest Change in % of Female Representation has been at the Board Level
FTSE 100, equal-weighted. Average % change in the proportion of women 2005-2020.
Source: Datastream, Goldman Sachs Global Investment Research
Global minimum taxation: After many years of falling taxes, especially for large multi-nationals, there is a global concerted effect to look to increase taxation – especially on digital assets and streams of income. A global minimum taxation threshold of 15% was recently agreed by OECD countries.
Resilient supply chains rather than 'just in time': There has been a growing discussion about the impact of the coronavirus on globalisation in general, and supply chains in particular. In some ways, the pushback on the years of globalisation had already begun, with a shift in the political climate. The US/China trade conflict and Brexit had fractured the belief that globalisation was without limit even before the pandemic and the recent supply-chain issues.
Back to investing again?: There may be reasons to believe that investment should start to pick up: (i) companies have accumulated cash on balance sheets through the pandemic (Exhibit 28), (ii) government policy has been encouraging more investment with the super-deductability of investment for taxation purposes, (iii) if companies want to make their production environmentally friendly and reduce fuel usage, they are likely to need to invest in better/newer buildings, machines etc. and the current rise in energy costs will increase the incentive to use less energy, as well as the pressure from their shareholders with a focus on ESG credentials, and (iv) higher wages may ironically incentivise more investment as companies look to mitigate costs of labour by putting in more automation. From a productivity perspective, this is a positive provided that the workers who are substituted are able to find productive jobs elsewhere in the economy; with the demand for labour high, we think this is likely.
We find that, when surveyed, CFOs increasingly point to capex as a priority, more so that at any point in the last decade (Exhibit 29).
Exhibit 28: UK Corporates have High Cash Balances
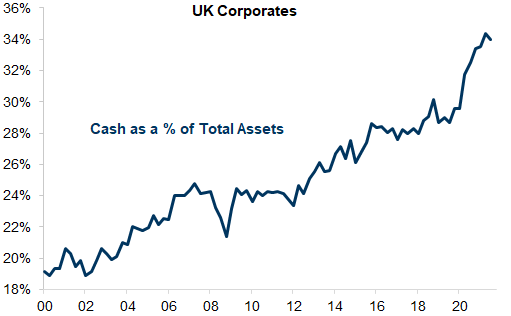
Source: ONS, Haver Analytics, Goldman Sachs Global Investment Research
Exhibit 29: Increasing Capex is Becoming a Higher Priority
Deloitte CFO Survey, companies reporting as Strong Priority in the next 12M
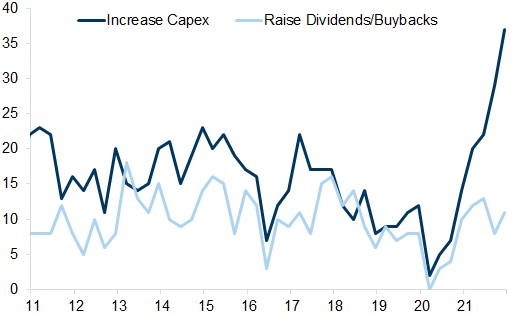
Source: Deloitte, Haver Analytics, Goldman Sachs Global Investment Research
The ‘social contract’ post the pandemic: The recent crisis has been very different from the global financial crisis in many respects. No particular sector of society or industry is responsible. Societies have pulled together to focus on the problem. But the extraordinary support given by governments is likely to mean more focus on companies being part of the solution – especially the largest and most profitable ones. Encouragingly, there have been many examples of companies helping with innovation, drug development, healthcare systems, ensuring access to telephone capacity, and many more such issues. The emphasis on corporate responsibilities towards stakeholders, including employees and suppliers, is likely to grow in our view. We leveraged GS Data Works to note that mentions of terms such as stakeholder have grown substantially versus shareholder (Exhibit 31).
Exhibit 30: Mention of Key Social Mobility Words in Company Results
1y rolling basis. Each word/expression is indexed to 100 at its maximum. Based on FTSE 350 earnings call transcripts (Presenter + Q&A)
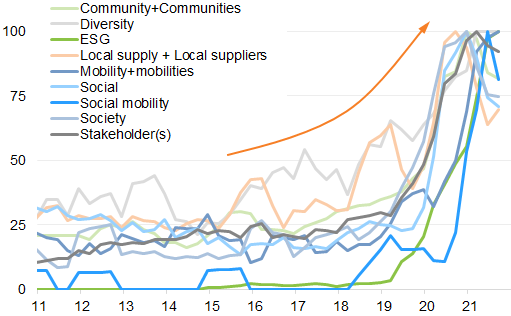
Source: Refinitiv, Goldman Sachs Global Investment Research
Exhibit 31: The Term 'Stakeholder' has become More Common in the Management Lexicon
Number of times the words Shareholder(s) and Stakeholder(s) are mentioned (per company). Based on FTSE 350 earnings call transcripts (Presenter + Q&A)
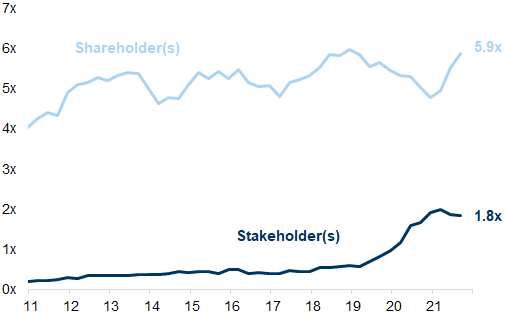
Source: Refinitiv, Goldman Sachs Global Investment Research
Targeting social mobility specifically: Companies have started to target more under-represented groups in their workforce, and internal promotion has become more of a focus. More than 55% of FTSE 100 companies have diversity targets (the proportion is lower for smaller cap companies) and 65% have internal promotion schemes, compared with just 39% of S&P 500 companies (Exhibit 33).
Exhibit 32: 55% of FTSE 100 Companies have Targets for Diversity ...
% of companies in each index with targets or objectives for diversity
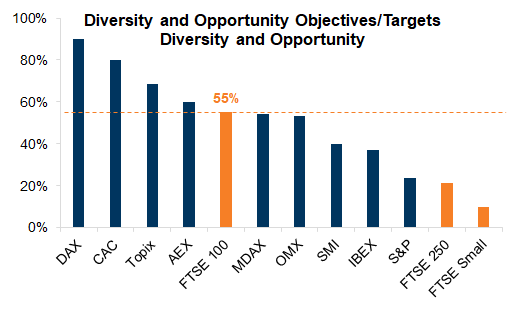
Source: Datastream, Goldman Sachs Global Investment Research
Exhibit 33: Majority of Companies Encouraging More Home-Grown Talent via Internal Promotion schemes
% of companies in each index with stated schemes for internal promotion
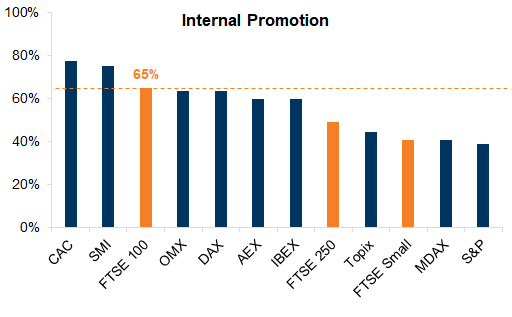
Source: Datastream, Goldman Sachs Global Investment Research
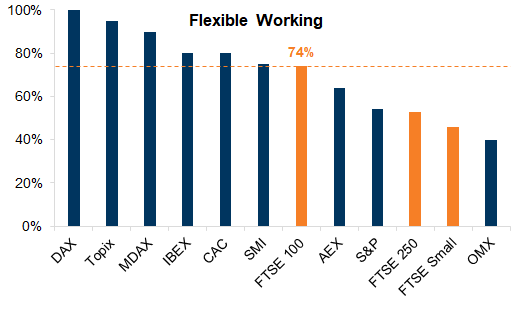
More focus on flexibility and adapting to employee lifestyles: Schemes that will appeal to and foster a diverse workforce have risen in recent years, such as employee networks and flexible working schemes. In addition, day care provision/services have grown. The pandemic is also likely to increase the availability and acceptability of more flexible work options for employees given greater use of working remotely in locations outside firms' head offices.
Large cap UK companies score relatively well with regard to offering flexible working, although most of these companies have large operations (and employees) outside the UK. Mid cap and small cap companies offer this with less frequency.
Exhibit 34: Over 70% of Large Cap Companies Offer Flexible Working - a Smaller % of Mid/Small Caps Do
% of companies in each index which specifically offer flexible working schemes
Source: Datastream, Goldman Sachs Global Investment Research
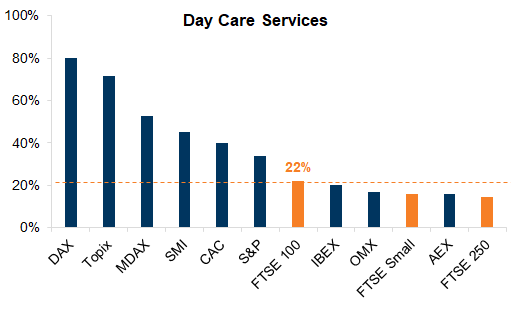
Exhibit 35: Day Care Services are Still an Exception, Offered by Just 20% of FTSE 100 companies and c.15% of FTSE 250/FT Small Cap Companies
% of companies in each index which offer day care facilities - either on or offsite
Source: Datastream, Goldman Sachs Global Investment Research
On day-care services the UK scores relatively badly, with few companies offering such services. Whether companies offer this or not also depends on how much is provided by the state: the OMX companies (Sweden) may not need to provide childcare onsite if the state provides good services.
We find that in the last 15 years the proportion of companies measuring or providing more socially driven services for employees or the wider community has grown. Of course, some of this may owe to a change in reporting or disclosures rather than companies changing the services offered or their approach to employees. That said, we believe not all of it is down to reporting. Moreover, measuring something – such as diversity targets, the pay gap, etc. – should focus management attention on the need to improve these metrics.
We think several things would promote leveling up and equality from a corporate perspective in the UK:
More investment spend, which has been lacking in recent years, should boost longer-term returns, and is a good use of cash when borrowing costs are low. While some investment may be a substitute for labour, ultimately it tends to lift productivity and therefore wages.
Continued focus on diversity targets – this has improved but there is a long way to go.
More schemes to encourage internal mobility and flexible working; also, relatively few companies offer day care services.
Location, location, location — the bias in the UK is very much towards London
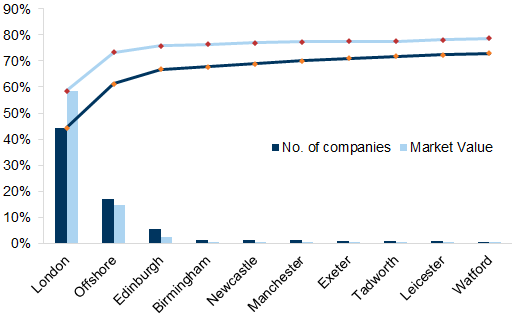
There is a very strong bias to company headquarters being located in London rather than other UK cities. There is much more of a capital-city bias in the location of UK listed companies’ headquarters than in, say, the headquarters of US companies or those in Germany (Exhibit 37). France has a strong bias to Paris as a base for company headquarters. That said, headquarters do not necessarily equate to headcount or investment. But this lack of a spread in where companies are controlled is particularly acute in the UK.
Exhibit 36: UK Company Headquarters are Concentrated in London
Company headquarters for FTSE 350
Source: Datastream, Goldman Sachs Global Investment Research
Exhibit 37: UK Not Alone in One-City Dominance among Listed Stocks But It's More Extreme than for Many
Company headquarters for large-cap listed companies % in largest city*
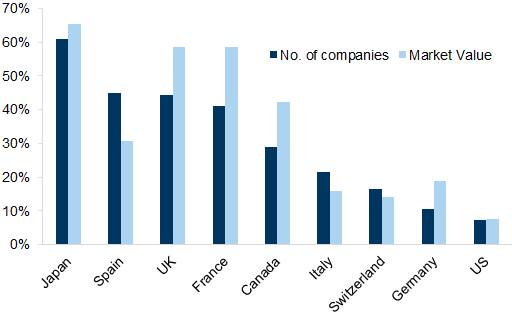
*Capital in each country except for Munich in Germany, Milan in Italy, Zurich in Switzerland, Toronto in Canada and New York in the US
Source: Datastream, Goldman Sachs Global Investment Research
Energy inflation and the impact of the cost of living crisis for stocks
Headline CPI inflation is already above +5%, and we expect it to peak around 8% in April and then stay sticky/high through to the early part of 2023. Wage growth is also strong given the tightness of the labour market, but real wage growth is now slightly negative and, with energy prices set to rise further when the energy cap is raised in April, the problem of a further cost of living hit – especially to lower income households – is likely to remain a concern, as we discussed earlier.
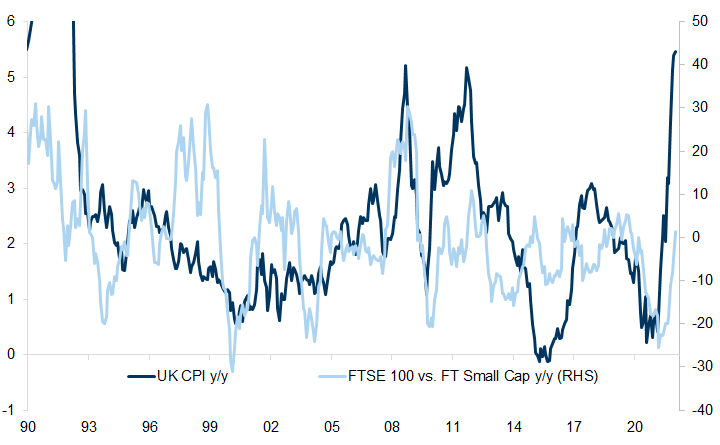
Who is affected by this? Rising inflation per se tends to be better for big-cap stocks relative to smaller-cap ones, as we show in Exhibit 38. Indeed, big caps have under-performed their normal relationship with the rise in inflation. They tend to be in a better position to absorb extra costs; also, commodity stocks account for a large slice of the FTSE 100 and often inflation is driven (as is the case now) partly by higher commodity prices. Furthermore, the large caps tend to be more international so suffer less from any domestic inflationary episodes.
Exhibit 38: FTSE 100 Companies Tend to Outperform Small-Cap Stocks as Inflation Rises
y/y relative price performance vs. UK CPI
Source: Datastream, Goldman Sachs Global Investment Research
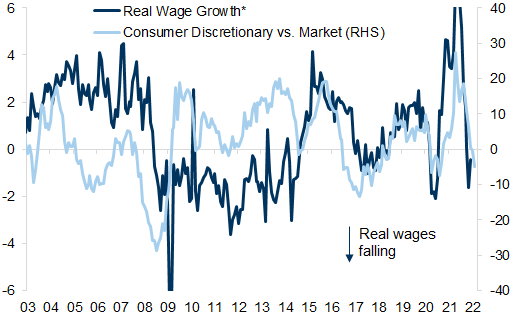
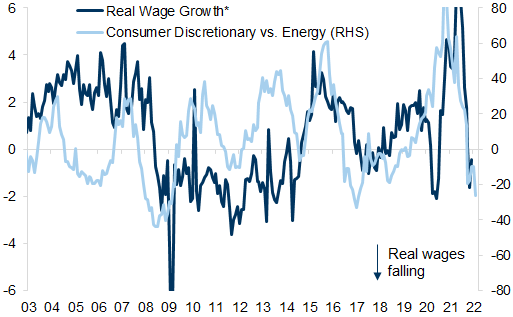
Unsurprisingly, given the squeeze on the consumer, we find that Consumer Discretionary stocks tend to underperform the market (Exhibit 39) and the Energy sector (Exhibit 40) when real wages are falling. Of course, not all consumers are hit equally – energy is a smaller proportion of outgoings for middle- and higher-income households, and they also have built -up the most savings during the pandemic. It is companies more exposed to the lower-end consumer which are likely to be impacted most.
Exhibit 39: Consumer Discretionary Stocks Tend to Underperform the Market When Real Wages are Falling
Relative price return. *Average weekly earnings yoy minus Headline CPI inflation.
Source: Datastream, Worldscope, Goldman Sachs Global Investment Research
Exhibit 40: Consumer Discretionary Stocks Tend to Underperform Energy stocks when Real Wages are Falling
Relative price return. *Average weekly earnings yoy minus Headline CPI inflation.
Source: Datastream, Worldscope, Goldman Sachs Global Investment Research
For example, our Equity Retail analysts recently downgraded ABF based on higher input costs and lack of ability to pass these through to margins. For its Primark business, our analysts expect weak store footfall trends to continue. That said, Retailers and other Consumer stocks with more of a leisure focus or those catering to middle- or higher-income households are probably more cushioned. As an example, airlines are seeing strong booking demand. Our Equity analysts have raised their estimates for Ryanair and Easyjet, arguing that reduced industry capacity and more consolidated industry structure should allow low-cost carriers to raise fares above inflation and exceed pre-pandemic profitability.
Enablers of Social Mobility
Companies enabling social mobility
We asked our Equity analysts for examples of companies whose businesses are involved directly in enabling social mobility, whether education businesses or those broadening out access to technology or finance. We highlight some of these below. This is not meant to be a comprehensive list, but rather illustrations of companies and businesses that are enabling social mobility.
Exhibit 41: Examples of enablers of social mobility
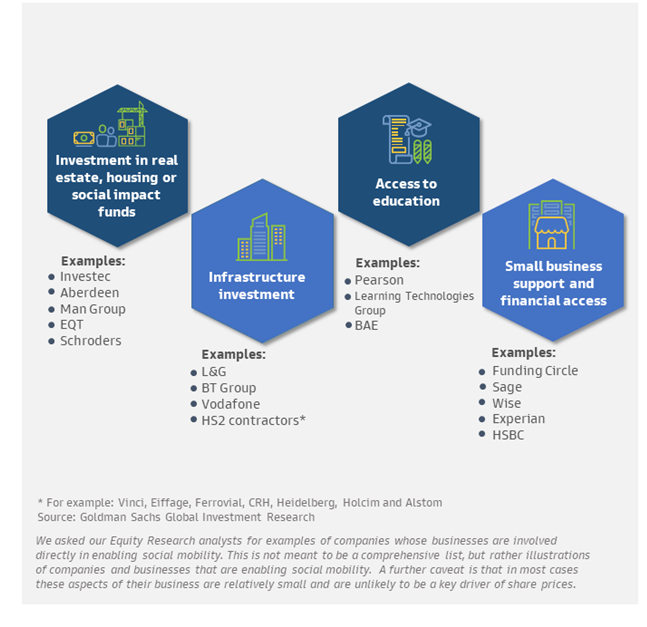
Impact on share prices likely to remain small: A further caveat is that in most cases these aspects of their business are relatively small and are unlikely to be a key share price driver, especially for the larger cap companies. Nonetheless, we think that in total the investment projects, infrastructure, apprenticeship schemes and support for education and small businesses should make a material difference to outcomes.
Many companies tend to be involved in large infrastructure projects: One large project to improve transport linkages across the UK is the HS2 project. Several companies have won contracts to supply HS2-related infrastructure, including Vinci, Eiffage, Ferrovial, CRH, Heidelberg, Holcim and Alstom. But generally for these businesses the contribution to income is small compared with the size of the overall company and unlikely to be material for share prices. Nonetheless, these types of projects are important for UK infrastructure and investment in the Midlands and North of England.
1/ Investment in real estate, housing or social impact funds
Investec PLC: Economic regeneration projects
Real Estate provided £83 million of facilities to a joint venture to fund the development of student accommodation properties.
Investec partners with the Bromley by Bow Centre, which focuses on economic regeneration in London by helping entrepreneurs to launch their businesses. Many of the entrepreneurs are female and/or from an ethnic minority. It also provides financial and other support for digital learning in rural and disadvantaged communities.
One of Investec’s partners in the UK, Arrival Education, is a social enterprise that focuses on supporting young people from minority ethnic groups through programmes which encourage social mobility.
In the UK, Investec’s Asset Finance business supports over 50,000 SME clients, just over 50% of their client population.
Aberdeen: Job creation through social investment & social housing
Aberdeen has collaborated with Big Issue Invest to offer ways of investing that promote societal as well as financial benefits. An example of this is the UK Equity Impact Employment Opportunities Fund. The fund aims to promote stable employment, wages and opportunities for learning and progression – particularly in the UK's most deprived communities.
Aberdeen Standard Investments (ASI) invested £70 million into Network Homes which enabled Network Homes to boost liquidity and help achieve its social housing goals.
Man Group: Real estate equity – UK community housing
The UK Community Housing Strategy is a real estate strategy that seeks to generate financial and social returns by investing in the UK affordable housing sector.
The business is targeting the creation of a £400mn fund to build 3,500 homes of which it has already raised the first part and has deployed c.£31mn into a 227-home scheme.
EQT: Real estate investment
£1bn residential joint venture between EQT Exeter and Sigma Capital to create a portfolio of high-quality 'build-to-rent' (BTR) residential homes at market rental rates in more affordable areas of Greater London.
Schroders: Social impact trust
Schroders and Big Society Capital (BSC) launched the Schroder BSC Social Impact Trust plc, a new investment trust strategically positioned to address significant social challenges in the UK.
2/ Infrastructure investment
Legal & General: Infrastructure investment
Legal & General have been large investors in infrastructure in regions within the UK for some years – including in Manchester, Cardiff, Salford, Sheffield and Oxford. The company calls this inclusive capitalism, and they are committed to putting their capital and the capital backing their c£90bn annuity portfolio into building better and greener infrastructure.
These projects include urban development, science and technology parks and data centres, leaving the company well positioned to benefit from the UK government's focus on 'building back better' in the regions. The company has also made a commitment that all its residential homes will be operationally carbon emission free from 2030. This includes c.3,000 traditional homes pa and 3,000 affordable homes, coupled with 'build to rent' homes.
They are committed to providing capital for up to 5% of the UK clean energy market by 2021 and increasing the proportion of economically and socially valuable assets within their real asset portfolio by 20% by 2023.
BT Group: Digital infrastructure
BT is playing a major role in broadening out digital connectivity for the UK. With a fibre build-out to 25mn homes by 2026, BT plans to build faster than any European operator has done before.
Vodafone: Digital access
In partnership with charities, Vodafone is tackling digital exclusion in the UK. With 1.5 million UK homes still without internet access, Vodafone aims to bridge the gap and broaden the opportunity set for users who would have otherwise struggled to access basic services, study from home, or keep in touch with relatives. Note, the UK is only 10% of Vodafone's business.
3/ Education access and training/apprenticeships
Pearson: Education access
Pearson supports the existing UK academic system across GCSEs and A Levels as well as vocation-focused BTEC and T Level curricula, materials and qualifications. Beyond the traditional school-aged student, the company also operates Pearson VUE, which facilitates professional assessments and qualifications from a range of different industries.
The company created the 'UK learns' portal during the pandemic, providing certified online courses for furloughed workers and is now open to individuals across the UK wishing to access these courses.
The company has recently committed to growing its business offering in 'workforce skills' to support the upskilling and reskilling efforts of corporates, a market which it believes was worth £280bn globally in 2019.
Learning Technologies Group: Education access
LTG supports employers (including UK corporates and the public sector) in upskilling and reskilling their employees for the future needs of the workforce. It does this through providing digital content authoring tools, as well as specialists that partner with customers directly to create bespoke digital learning content.
LTG’s software and platforms offering includes businesses such as Affirmity and PDT Global, which enable corporates to assess the diversity of their workforce.
The company’s software and platforms offering also includes products that help corporates identify skills gaps across their workforce and then both recommend and facilitate appropriate training.
BAE: Apprenticeships and investment in the North
BAE has a track record of investing in education. The company hired c.800 apprentices in 2021, and they were maintained even during the pandemic. It invests in STEM & early careers training for around 3,000 young people in the UK.
'Leveling-up': It employs over 20,000 in North West England. In 2020, BAE directly employed 14,700 workers in the most deprived local authorities, 40% of its total employment in the UK.
4/ Support and access to finance for small businesses
Funding Circle: SME online lending
Provides online-based SME lending with a process that is faster and smoother than the traditional banks.
In addition, the company was used successfully by the government to distribute pandemic-related interest free loans to UK SMEs.
Sage: Small business support
Sage provides accounting, payroll and HR software to small and medium businesses.
The main issue for Sage, according to our Equity analysts, is that in order to remain competitive it needs to spend a high amount of its revenues on R&D (c.15%) and a third of its revenues on sales and marketing.
Wise: Fintech platform for consumers and SMEs
This is a global business but around a quarter of revenues are from the UK.
Wise is an enabler of cross-border money transfer solutions, but it increasingly leverages its platform to provide a broader range of financial services ranging from multi-currency accounts and debit cards for consumers and businesses. See our Equity analysts' report.
Experian: Financial access
Enabler of access to financial products. Experian is focusing on expanding the amount of data added to credit reports to help with access to mortgages and other credit financing (or insurance) for the underprivileged or unbanked population.
It is predominantly a US business but is one of the major players in the credit market in the UK.
For example, they add mobile phone bills or utility bills to credit reports in order to increase an individual’s credit history, making banks more comfortable providing first-time loans, and focusing on UN SDGs related to access to financial resources and poverty elimination.
Experian has increased its capex spend on product development from c.18% in 2016 to c.33% in 2020.
HSBC: Broadening financial access
HSBC is working with housing and homelessness charities such as Shelter to help people without a fixed home address to open a bank account.
Who is likely to benefit from 'leveling-up'?
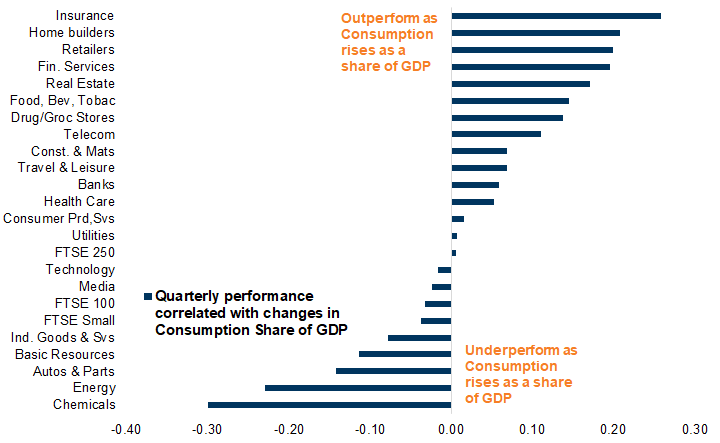
More income for lower-income households or 'leveling-up' should benefit certain sectors. These are likely to be the same companies and areas of the market that generally benefit when consumption as a share of GDP is rising, in sectors such as Homebuilders, Retailers, Travel & Leisure companies, Real Estate and Financial Services stocks.
Exhibit 42: Consumer and Financial Sectors Benefit as Consumption Share of GDP Rises
UK sectors' relative performance to UK market yoy, measured quarterly and compared with changes in UK consumption share of GDP
Source: Datastream, Haver Analytics, Goldman Sachs Global Investment Research

We would like to thank Lior Kohanan, an intern on the Portfolio Strategy team, for his contributions to this report.
Investors should consider this report as only a single factor in making their investment decision. For Reg AC certification and other important disclosures, see the Disclosure Appendix, or go to www.gs.com/research/hedge.html.