The Bigger Picture
Asianomics in America: Contributions and Challenges
Executive Summary
1. Major economic successes. Asian Americans have seen marked success as it relates to education, income, and innovation, and are the most highly educated group in the US. While Asian Americans now account for 6% of the US population, they hold 13% of STEM jobs and drive 19% of high-impact patents.
2. Inequalities and challenges. Despite these successes, the Asian American economic experience is not monolithic, and varies significantly across occupations and country of origin. Asian Americans are overrepresented both in well-paid occupations and in low-paid occupations. Within the well-paid occupations, Asian Americans remain underrepresented in managerial and executive positions.
3. “Bamboo ceiling.” Despite accounting for 13% of professional positions at large employers, Asian Americans account for just 6% of senior management positions. While part of this gap reflects younger average age, US-born Asian American men with graduate degrees are 15% less likely to be in executive positions than white men with graduate degrees even on an age-adjusted basis. The Asian American share in S&P 500 CEO positions has stalled at around 2% for the past decade.
4. Often hired to restore performance. Zeroing in on the 39 Asian American Fortune 500 CEOs who have reached the top, we document four trends. First, nearly all of them were either born, raised, or educated in the West. Second, 22 of the 39 CEOs have a South Asian background. Third, Asian Americans are more likely to have graduate degrees, and lead younger firms than white CEOs. Fourth, 82% of the appointments of Asian American CEOs followed financial underperformance. Equity returns also recovered following the median appointment.
5. Major contributions to the labor market, innovation, and GDP. Data spanning 2003-2019 illustrate the outsized contributions of Asian Americans to growth in the workforce, innovation, and productivity. Asian Americans have driven 22% of employment growth during this period, despite accounting for just 6% of the population. We estimate that Asian American contributions boosted new patenting activity by 26% over 2003-2019. Taken together, we estimate that Asian Americans drove 23% of US private sector output growth over 2003-2019. This translates to a total GDP growth contribution of $1.5 trillion in current dollar terms.
Overview: Successes and Heterogeneities[1]
In this section, we review the key economic trends shaping the Asian American experience, highlighting both the group’s successes as well as the challenges and significant heterogeneity the group still faces.
Before we proceed, it is important to note that Asian Americans are a relatively new and rapidly growing major demographic group, whose experiences have been shaped significantly by the conditions under which they came to the US. Asian Americans do have a long history in the US that extends back to early colonial times, though immigration restrictions stunted their subsequent population growth. Passed in 1882, the Chinese Exclusion Act was the first broad US immigration restriction placed on an ethnic group, and over the ensuing decades, restrictions were extended to other Asian groups. The Immigration and Nationality Act of 1965 then overturned these restrictions, and created a new immigration system aiming to attract high-skilled immigrants and reunify families.
As a result, the Asian American population has increased meaningfully. The Asian American share of the population has increased from less than 1% in 1970, with most born in the US, to nearly 6% today, with most born outside the US (Exhibit 1). Today, Asia’s share of high-skilled H-1B visa admissions is nearly 90% (Appendix chart 1), and high-skilled immigration has significantly shaped the Asian American economic experience.
Exhibit 1: Following the Liberalization of Immigration the Asian American Share of the US Population Has Increased From Less Than 1% in 1970 to Nearly 6% Today
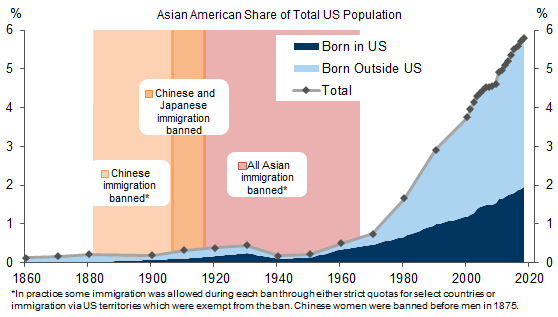
Source: US Census, American Community Survey, Goldman Sachs Global Investment Research
1. Successes: Education, Income, and Innovation
Asian Americans have attained a number of significant economic successes, in areas such as education, income, and innovation.
Asian Americans are the most highly educated group in the United States, with 69% of Asian Americans aged 25-54 holding a bachelor’s degree compared to 41% among white Americans, and Asian Americans are more than twice as likely as white Americans to hold a graduate degree (Exhibit 2).
Exhibit 2: Relatively High Education Levels for Asian Americans
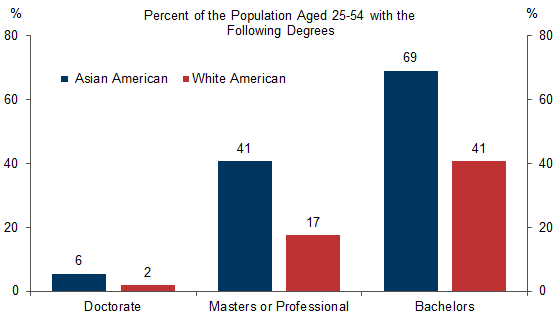
Source: Current Population Survey, Goldman Sachs Global Investment Research
This achievement is attributable, at least in part, to the policy of selecting high-skilled immigrants. As Lee and coauthors note, the US immigration system “gave preferences to highly-educated, highly-skilled applicants from Asia, which, in turn, ushered in a new stream of Asian immigrants of diverse skills and socioeconomic backgrounds. Some Asian immigrant groups are hyper-selected…they are not only more highly educated than their compatriots from their countries of origin who did not immigrate, but also more highly educated than the U.S. average.” Even for US-born Asian Americans, higher education levels of their parents suggest higher college completion rates.[2]
Potentially as a result of elevated education levels, the median Asian American also earns more than their white American counterpart. Prior to 2000, Asian American and white American incomes roughly tracked one another. However, incomes for the two groups have diverged, with the median Asian American household earning approximately $9,000 more in 2019 than the median white household (Appendix chart 2).
These individual successes mirror Asian Americans’ large contributions to scientific progress, innovation, and growth in the US economy. Despite accounting for just under 7% of the US labor force, Asian Americans hold 10% of Nobel Prizes in Physics and Chemistry since 1980, represent 11% of American doctoral degree graduates, hold 13% of college-educated STEM jobs, and have driven 19% of high-impact US patents (Exhibit 3).
Exhibit 3: Asian Americans Have Made Disproportionate Contributions to Innovation
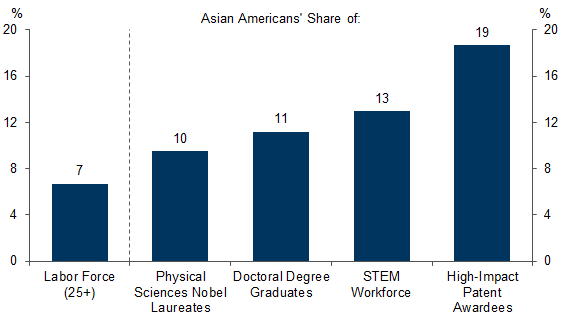
Labor force data from 2020. Nobel Laureates in Chemistry and Physics from 1980-2020. Doctoral degree data from 2018-19 and includes Ph.D., E.D., and comparable degrees at the doctorate level, as well as M.D., D.D.S., and law degrees that confer doctoral status. STEM workforce data from 2014-2016 and includes college-educated employees in 74 occupations including computer and mathematical occupations, engineers and architects, physical scientists, life scientists, and health-related jobs such as healthcare practitioners and technicians. High-impact patent data from 2011-2015 includes patents approved by all 3 major international patent offices in life sciences, material sciences, information technology, and from large tech companies, as well as R&D100 Award Winners.
Source: US Bureau of Labor Statistics, Nobel Foundation, National Center for Education Statistics, Pew Research Center, Information Technology and Innovation Foundation, Data compiled by Goldman Sachs Global Investment Research
More broadly, Asian Americans are overrepresented in all three of the fastest-growing industries: information, management of companies and enterprises, and professional and technical services (Exhibit 4). In Section 3, we estimate Asian Americans’ contributions to US GDP growth.
Exhibit 4: Asian Americans Are Overrepresented in Fastest-Growing Industries
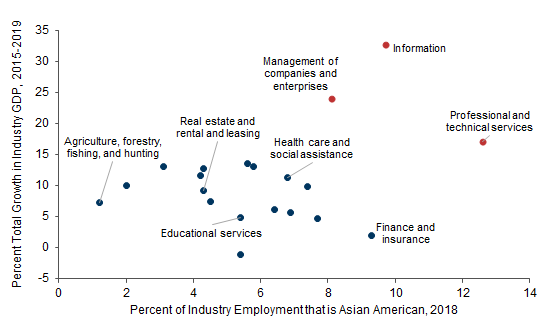
Source: US Bureau of Labor Statistics, Haver Analytics, Goldman Sachs Global Investment Research
2. Heterogeneities: Occupational and Country-Level Inequalities
Despite Asian Americans’ notable economic successes, the Asian American experience is not monolithic, and varies significantly across occupations and the country of origin.
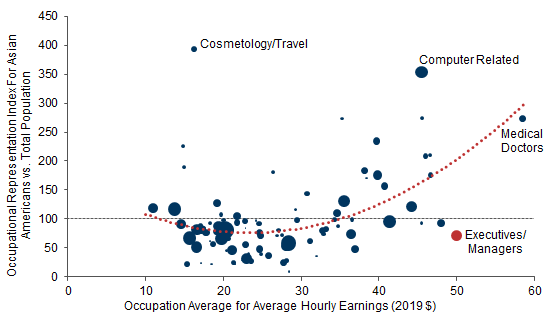
Exhibit 5 shows that Asian Americans are overrepresented in both well-paid occupations, as well as at the lower end of the occupational spectrum, and are underrepresented in mid-level professions. Despite their general overrepresentation in well-paid occupations, Asian Americans are also still substantially underrepresented in managerial and executive positions, a topic Section 2 discusses.
Exhibit 5: Asian Americans Are Overrepresented at Both Ends of the Occupational Spectrum
Source: Current Population Survey, Goldman Sachs Global Investment Research
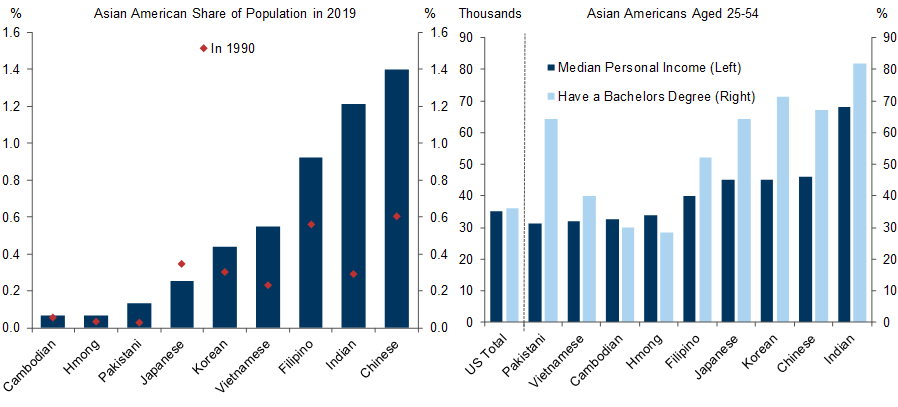
A second source of heterogeneity in the Asian American population (which may in part explain the first) is country of origin. Asian Americans from countries such as India and China tend to have significantly higher education and income levels than their counterparts from countries like Pakistan, Vietnam, and Cambodia (Exhibit 6).
Existing research suggests that these disparities result, at least in part, from differences in the pathway of immigration. Immigrants from countries like India are more likely to have immigrated via high-skilled immigration programs than those from countries like Vietnam (many of whom moved to the US as Vietnam War refugees).[3] Between 1970 and 2016, income inequality rose more rapidly among Asian Americans than among any other racial or ethnic group in the US, with particularly low wage growth for low-income Asian Americans.[4]
Exhibit 6: Asian American Economic Outcomes Vary Considerably by Country of Origin
Source: American Community Survey, Goldman Sachs Global Investment Research
We next analyze one major additional challenge Asian Americans face: the group’s persistent underrepresentation in and lack of access to leadership and management roles, also known as the "bamboo ceiling".
Documenting the Bamboo Ceiling
In this section, we document the barriers Asian Americans face to advancement in the workplace and representation in top leadership positions, a phenomenon often referred to as the "bamboo ceiling".[5]
We first use macro-level data to quantify the significant and persistent seniority gap, and show that observable group-level differences alone cannot fully explain this gap. We then use micro-level biographical data on past and present Asian American Fortune 500 CEOs to identify the factors which do enable Asian Americans to rise to the top.
1. Macro-Level Data: A Persistent Gap
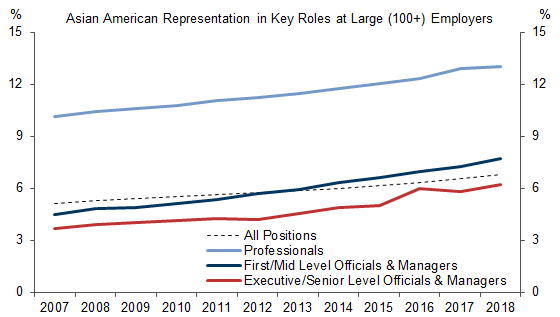
First, we observe national trends in Asian American representation in US corporate leadership positions using data from the US Equal Employment Opportunity Commission (EEOC). Exhibit 7 shows that there is a persistent gap between Asian American representation in entry-level professional positions and more senior management roles nationally.[6] In 2018, despite accounting for 13% of professional positions at large employers, Asian Americans accounted for less than half that share of senior management positions (6%).
Exhibit 7: Persistent Underrepresentation of Asian Americans in Management and Executive Positions
Source: Equal Employment Opportunity Commission, Goldman Sachs Global Investment Research
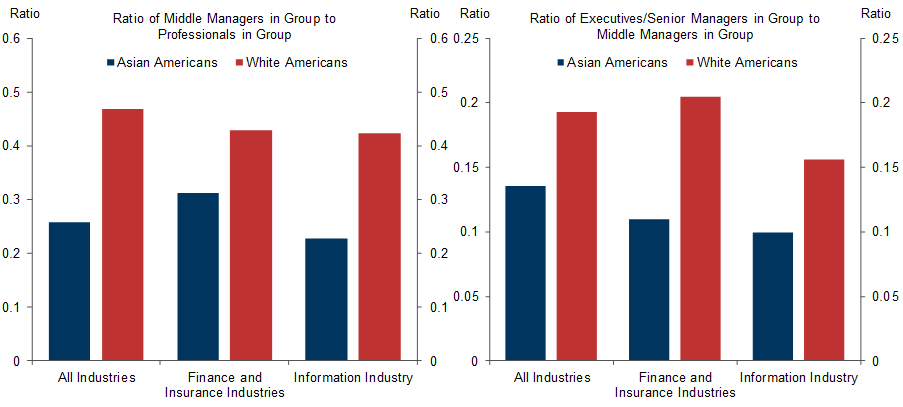
To further illustrate this gap, we construct a “promotion proxy”, expressed as the ratio of middle managers to professionals in a given group (we do the same for executives to middle managers). We find that the promotion proxy for Asian Americans is between 50-70% that of white Americans, and is consistently lower across a number of industries and levels of seniority (Exhibit 8). Asian Americans have the lowest professional-to-manager promotion proxy of any racial group in the EEOC data. However, this gap may in part reflect other factors such as a lower average age or a larger share of recent immigrants (who may be less likely to start in managerial roles).
Exhibit 8: Promotion Proxy for Asian Americans 50-70% That of White Americans
Source: Equal Employment Opportunity Commission, Goldman Sachs Global Investment Research
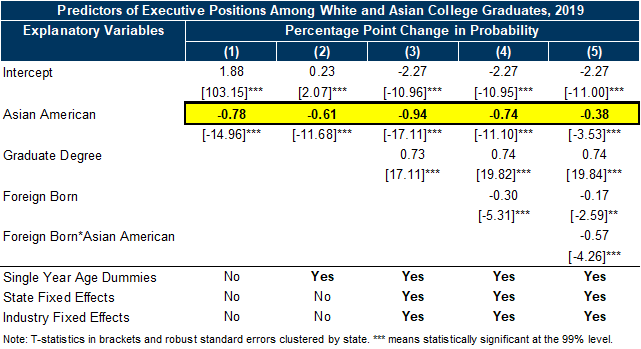
We next ask to what extent observable factors—including age, nativity, and industry choices—can explain this seniority gap. Using individual data from the American Community Survey, we decompose the gap in the frequency of executive employment among college-educated Asian Americans and White Americans.[7]
Exhibit 9 shows that observable factors can explain part of the bamboo ceiling. The introduction of single year age dummy and nativity controls reduces the magnitude of the unexplained executive employment gap, because Asian Americans are on average younger and more likely to be foreign-born.
Nonetheless, at least 50% of the gap remains unexplained with the inclusion of all controls (Column 5 vs. Column 1). When we assume that Asian Americans and white Americans face the same employment penalty for being foreign-born, 95% of the gap remains unexplained (Column 4). In contrast, allowing a larger penalty from being born abroad for Asian Americans reduces the unexplained share to 50% (Column 5).
Restricting the sample to US born individuals also leaves about 50% of the gap unexplained. Finally, we document that US-born Asian American men with graduate degrees are 15% less likely to be in executive positions than white men with graduate degrees, adjusted for age.
Exhibit 9: 50-95% of the Seniority Gap Persists with the Inclusion of Age, Nativity, Industry, and Education Controls
Source: American Community Survey, Goldman Sachs Global Investment Research
Existing research sheds some light on the unexplained portion of this gap. Lu and coauthors have shown that East Asians are rated as substantially less assertive by their peers (even when controlling for demographics and self-described leadership motivation), and that this factor statistically mediates the leadership gap between East Asians and white Americans. Notably, South Asians are not rated as less assertive by their peers, and correspondingly, are not less likely than white Americans to be appointed to leadership positions.[8] This suggests that some combination of (perceived) cultural differences in assertiveness and perceptions of Asian Americans potentially based on stereotypes may be contributing to this gap, particularly among East Asians.
2. Micro-Level Data: A Young, Dynamic, and Westernized Group of Leaders
Second, we use biographical data on the 39 past and present Asian American Fortune 500 CEOs to identify factors enabling Asian Americans to break through the bamboo ceiling[9], and under what conditions Asian Americans may be more likely to be appointed to management positions.
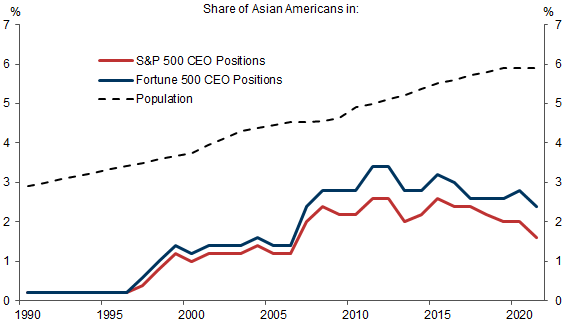
Exhibit 10 shows that the share of Asian Americans in S&P 500 CEO positions has stalled at around 2% since 2007, despite consistent increases in the Asian American population share. Asian Americans also remain underrepresented on Fortune 100 corporate boards, although the share has been edging up (Appendix chart 3).
Exhibit 10: Asian American Share of S&P 500 CEO Positions Stalling at Around 2%
Source: Prof. Zweigenhaft, Goldman Sachs Global Investment Research
We next document four trends found across Asian American CEOs:
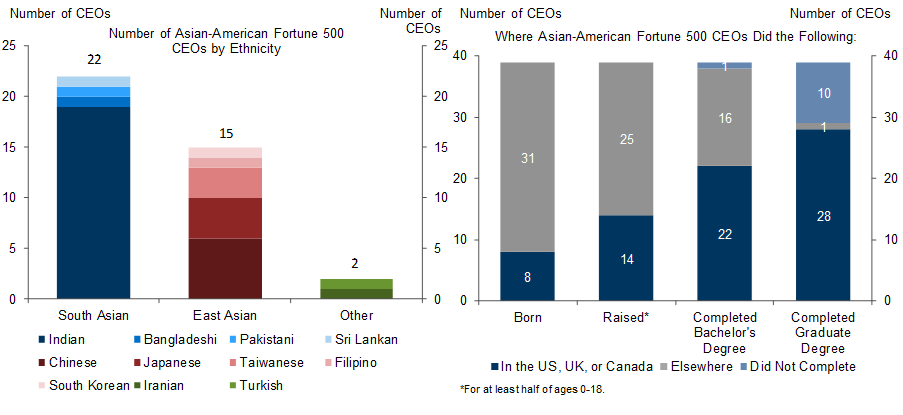
1. Westernized backgrounds. Of those CEOs that have attained these positions, the vast majority spent formative years of their life in a Western country (Exhibit 11). Of the 39 Asian American CEOs in our sample, 38 (97%) were either born, raised, or received a degree in the US, UK, or Canada.
2. Often South Asian. The vast majority (82%) of Asian American CEOs come from India, China, Taiwan, or Japan. 22 of 39 CEOs have a South Asian background, despite there being approximately 1.6 times as many East Asians as there are South Asians in the US.
Exhibit 11: Asian American CEOs Spend Formative Years in Western Countries, Hail Disproportionately from South Asia
Source: Prof. Zweigenhaft, Goldman Sachs Global Investment Research
3. More graduate degrees and lead younger firms. Asian American CEOs are more likely to have graduate degrees than their white counterparts, and lead younger firms. 74% of Asian American Fortune 500 CEOs and 79% of Asian American Fortune 500 CEOs who were raised in Asia have a graduate degree, compared to 66%[10] of all Fortune 500 CEOs. This suggests that Asian Americans, particularly those who are foreign-born, may be held to a somewhat higher academic standard to attain similar positions. Alternatively, the higher graduate degree share may also reflect that Asian American CEOs tend to lead firms in more knowledge intensive industries.
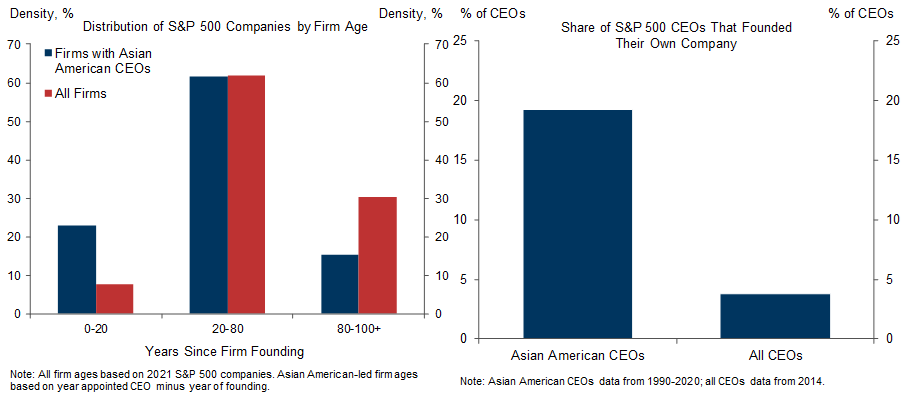
Exhibit 12 shows that Asian Americans are nearly 3 times as likely to lead a firm less than 20 years old (23% vs. 8%) and are 5 times as likely to lead a firm they founded. Put differently, Asian Americans are more likely than others to lead younger, nimbler companies that they have often played a pivotal role in launching, and are less likely to manage established companies that have been around for 80-100 years or more.
Exhibit 12: Asian Americans Nearly 3 Times as Likely to Lead a Firm Less Than 20 Years Old; 5 Times as Likely to Lead a Firm They Founded
Source: FactSet, Goldman Sachs Global Investment Research
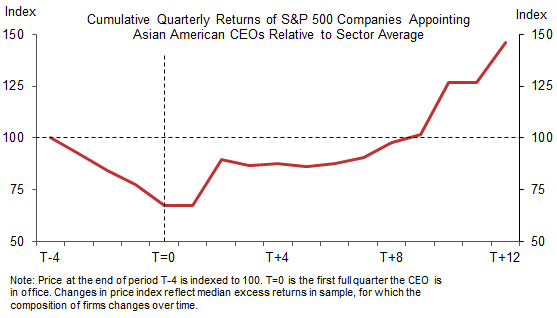
4. Appointed to restore performance. Using company- and sector-level returns data for S&P 500 companies, we study the 23 appointments of an Asian American CEO since 1990. We find that in 18 (82%) of these instances, Asian Americans are appointed to CEO positions following a year of underperformance in returns relative to the company’s sector average. Interestingly, the median appointment was also associated with restored performance (Exhibit 13). In contrast, several broader academic studies studying turnover of (generally white) CEOs do not find a significant change in long run firm performance following appointments.[11]
Exhibit 13: Asian American CEOs Often Appointed After a Period of Corporate Decline
Source: FactSet, Goldman Sachs Global Investment Research
Gundemir and coauthors confirm in a large study of nearly 5,000 historical CEO appointments that appointments of Asian American CEOs are two-and-a-half times more likely during periods of decline than during periods of nondecline. In contrast, the study finds that appointments of CEOs of other racial groups are roughly equally likely in periods of decline as in periods of nondecline. They conclude that “this pattern occurs because evaluators (a) prefer self-sacrificing leaders more when organizations are experiencing decline than success…, (b) expect Asian Americans leaders to behave in self-sacrificing ways in general…and, consequently, (c) perceive that Asian Americans are better equipped to be leaders during decline than success.”[12]
We see three implications. First, preexisting notions and stereotypes about Asian Americans’ leadership styles appear to influence Asian Americans’ promotion decisions. Second, the more limited number of situations where Asian Americans are perceived to be valuable leadership appointees (organizations only experience decline an estimated 12% of the time) may help explain the bamboo ceiling. Third, the outperformance of Asian American-led companies suggests that Asian Americans may bring unique abilities and perspectives to leadership roles that enable them to succeed. The marginal contribution of those who are appointed may also be disproportionate, as only the most qualified candidates may be selected.
Contributions to Innovation and Growth
Last but not least, we document the contributions Asian Americans have made to the US economy, both in terms of innovation and GDP growth.
We estimate the share of US GDP growth attributable to Asian Americans over 2003-2019 using a growth accounting framework. As the Appendix shows, GDP growth can be thought of as the weighted sum of growth in its three components: (1) the workforce L, (2) the nation’s capital stock capital K, and (3) total factor productivity (TFP) A.
We then express the share of GDP growth contributed by Asian Americans as the weighted average of the shares contributed by Asian Americans to growth in (1) the workforce, (2) the capital stock, and (3) TFP. We next estimate Asian Americans’ contributions to these three engines of growth.
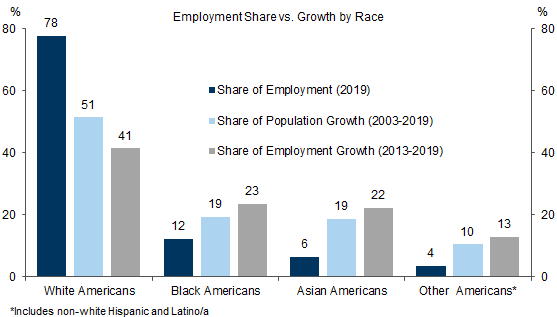
1. Share of Employment Growth
Asian Americans have contributed disproportionately to employment growth in the US over 2003-2019 (beginning in the first year for which Asian American-specific employment data is available). Asian Americans have driven 22% of US employment growth during this period, despite accounting for just under 6% of the US population in 2019. This mainly reflects that Asian Americans have driven 19% of US population growth over this period.
Exhibit 14: Asian Americans Have Driven 22% of US Employment Growth Over 2003-2019
Source: Haver Analytics, Goldman Sachs Global Investment Research
2. Share of Capital Growth
Given the difficulty of estimating a single group’s contribution to the capital stock, we assume that the Asian American share of labor growth mirrors the Asian American share of capital growth. This is likely a conservative assumption, given that Asian Americans are often employed in rapidly growing industries (Exhibit 4) with more technical demands.
3. Share of TFP Growth
We next estimate Asian Americans’ contribution to TFP growth. We assume that new patenting approvals are a good proxy for TFP growth. As Chang and coauthors note, “virtually all studies in the finance literature use patent variables as outcome measures, implicitly assuming that on average, patents reflect valuable innovations. Our paper…shows that patents predict productivity growth in a global sample consisting of 59 countries.”[13]
Building on the work of Hunt and coauthors[14], and using data from the US Census and the US Patent Trademark Office, we model the effect of changes in the Asian American population share ∆Ait on changes in per-capita domestic patent approvals ∆ log Pi,t+1 at the state level from 1950-2005:
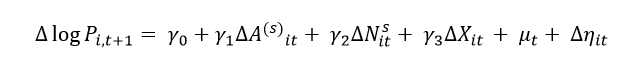
Where i indexes states, P is patents per capita, A is the share of (skilled) Asian Americans, N is the share of skilled natives, X is a vector of state-level characteristics and μ are year dummies. OLS regressions of this model would present an endogeneity problem, because Americans could conceivably be drawn to areas experiencing rapid economic growth, which may be predisposed to more patenting per capita (thus biasing our estimates upward).[15]
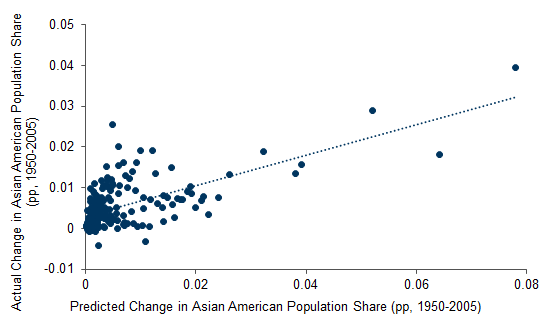
To address this problem, we construct a shift-share instrumental variable (IV) that predicts exogenous state-level changes in the Asian American population share using American population shares in 1960 Ai,1960 (when Asian American economic migration was largely banned) and observed national changes in Asian American population ∆AUS,t. The intuition is that many immigrants will move to areas where they already have family or cultural ties. This instrument strongly predicts changes in the state-level Asian American population share (Exhibit 15).[16]
Exhibit 15: Our Instrument Predicts Changes in State-Level Asian American Population Shares Well
Source: Goldman Sachs Global Investment Research
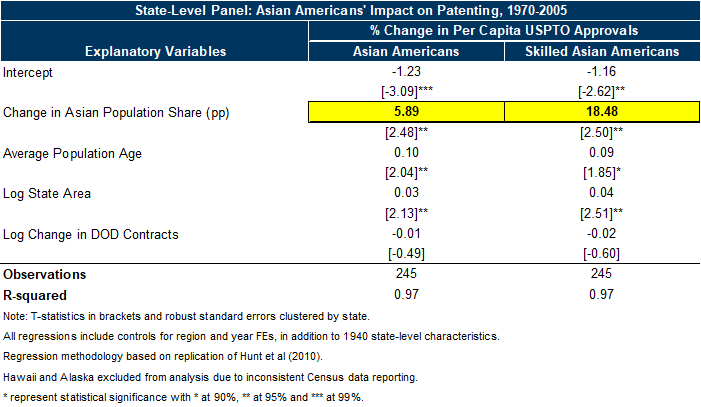
Running instrumental variable regressions, we estimate that each pp increase in the Asian American population share increases state-level patenting per capita by 5.9% (Exhibit 16). This effect is even stronger for college-educated Asian Americans, with each pp in their respective population share inducing an 18.5% increase in state-level patenting per capita.
Exhibit 16: Each 1pp Increase in the Asian American Population Share Increases Patenting Per-Capita by 5.9%
Source: Goldman Sachs Global Investment Research
Furthermore, Exhibit 17 shows that the total increases in patenting brought about by changes in the (total and skilled) Asian American population share exceed those implied by real-world survey data on patenting by Asian Americans.[17] This suggests that Asian Americans generate significant positive spillovers to innovation in the private sector, beyond their direct contributions. For instance, Asian American entrepreneurs who do not patent themselves may still increase patenting by complementing inventors in their organizations. Additionally, skilled Asian Americans patent more and generate larger spillovers than their skilled immigrant counterparts (estimates from Hunt and coauthors).[18]
Exhibit 17: Asian Americans Generate Significant Positive Spillovers to Patenting; College-Educated Asian Americans Outperform Their Immigrant Counterparts
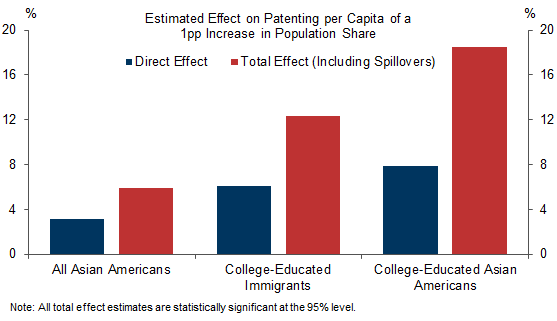
Direct effect for each group calculated based on Equation A(1) from Hunt and coauthors (2010) and data from the National Survey of College Graduates (2003) and the US Census (2005). Indirect effect for each group calculated based on methodology from Hunt and coauthors (2010) and historical data from the US Census and US Patent Trademark Office (1940-present).
Source: Hunt et al. (2010), National Survey of College Graduates, Goldman Sachs Global Investment Research
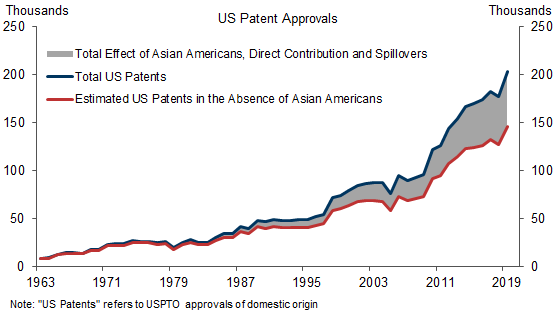
Using our coefficient estimate for Asian Americans’ effect on patenting and actual national changes in the Asian American population, we estimate that Asian American contributions boosted new patenting activity by approximately 26% over 2003-2019 (Exhibit 18). (Ignoring spillovers and incorporating only the direct patenting contribution would imply a less elevated Asian American share in US patenting and TFP growth of 14%.)
Exhibit 18: Asian American Contributions Boosted New Patenting Activity by 26% Over 2003-2019
Source: US Patent Trademark Office, Goldman Sachs Global Investment Research
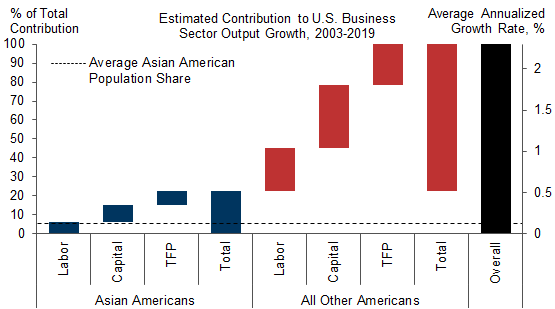
Combining the estimated contributions to employment growth, capital growth, and TFP growth, we estimate that Asian Americans drove 23% of US private sector output growth over 2003-2019, despite accounting for on average 5% of the population during this period. Given the $5.1 trillion increase in real business sector output (measured in chained 2012 dollars) over this period, this translates to a total GDP growth contribution of $1.5 trillion in current dollar terms, visualized in Exhibit 19.
Exhibit 19: Asian Americans Drove 23% of US Private Sector Output Growth Over 2003-2019
Source: Goldman Sachs Global Investment Research
Appendix
Nearly 90% of H-1B Visa Approvals Are from Asia
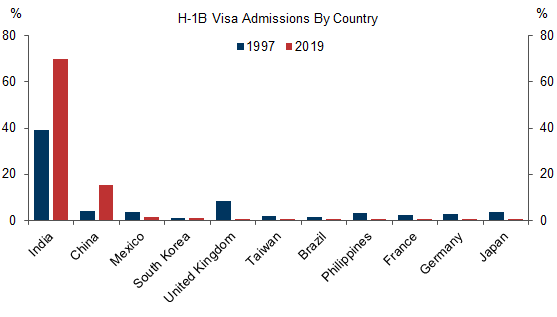
Source: US Department of State, Goldman Sachs Global Investment Research
Asian American and White American Incomes Have Diverged Since 2000
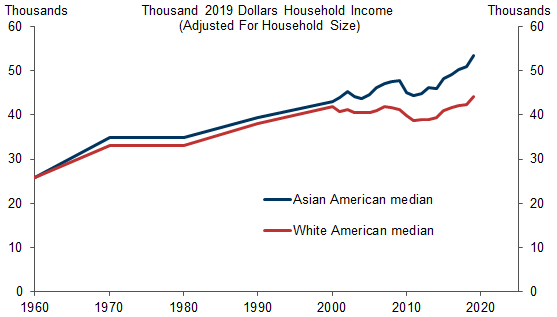
Source: American Community Survey, Goldman Sachs Global Investment Research
Asian Americans Remain Underrepresented On Fortune 100 Corporate Boards
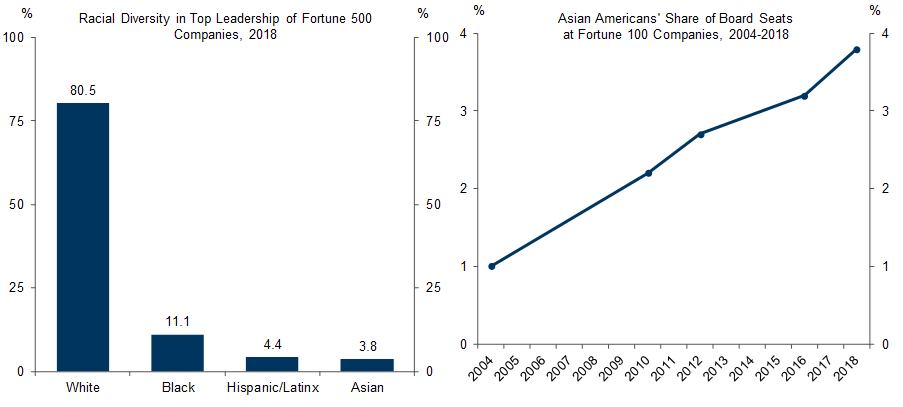
Source: Deloitte, Goldman Sachs Global Investment Research
Appendix : Growth Decomposition and Asian Americans’ Share of Growth
We use a Cobb-Douglass production function to model the three major drivers of GDP Y: (1) the workforce L, (2) the nation’s capital stock capital K, and (3) total factor productivity (TFP) A.
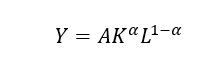
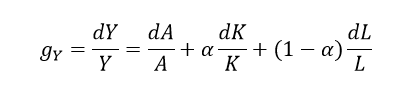
Using the product rule, we can express the GDP growth rate as the weighted sum of productivity growth, capital growth, and labor growth.
Our analysis focuses on Asian Americans’ contribution to private sector GDP (roughly 88% of the total).
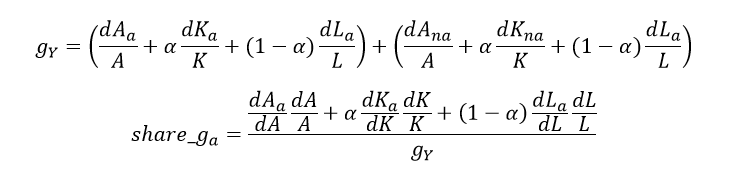
We then further decompose this change into the contribution from Asian Americans (subscript a) and others (subscript na), and finally express the share of GDP growth contributed by Asian Americans (share_gα) based on Asian Americans’ share in TFP growth, capital growth, and workforce growth.
- 1 ^ We would like to thank Jan Hatzius for his guidance throughout this project and Devesh Kodnani for his major contributions to this project.
- 2 ^ Cataldi, Emily Forrest, Christopher T. Bennett, and Xianglei Chen. “First-Generation Students: College Access, Persistence, and Postbachelor’s Outcomes.” National Center for Education Statistics (2018). https://nces.ed.gov/pubsearch/pubsinfo.asp?pubid=2018421
- 3 ^ Kochhar, Rakesh and Anthony Cilluffo. “Income Inequality in the U.S. Is Rising Most Rapidly Among Asians.” Pew Research Center (2018). https://www.pewresearch.org/social-trends/2018/07/12/income-inequality-in-the-u-s-is-rising-most-rapidly-among-asians/
- 4 ^ Ibid.
- 5 ^ The term “bamboo ceiling” was coined by author Jane Hyun in her 2005 book “Breaking the Bamboo Ceiling”, in which she explores barriers Asian Americans face to attaining management positions in corporate America.
- 6 ^ The EEOC requires all private sector employers with 100+ employees to disclose demographic workforce data. The EEOC data provide information on race but not on country of origin.
- 7 ^ Ideally, isolating for the effect of unexplained factors (e.g., discrimination) would require longitudinal data tracking the career progression of otherwise similar Asian and white Americans.
- 8 ^ Lu, Jackson, Richard E. Nesbit, and Michael W. Morris. “Why East Asians but not South Asians are underrepresented in leadership positions in the United States.” Proceedings of the National Academies of Sciences Vol. 117, No. 9 (2020): 4590-4600. https://www.pnas.org/content/117/9/4590
- 9 ^ Thank you to Professor Richard Zweigenhaft of Guilford College for graciously contributing data on Asian American Fortune 500 CEOs to this report.
- 10 ^ We estimate the share of Fortune 500 CEOs with a graduate degree using data from Fortune which shows that 70% of Fortune 500 CEOs with a degree have a graduate degree and the observation that 94.2% of Fortune 500 CEOs report some degree.
- 11 ^ See Donald J. Schepker, Youngsang Kim, Pankaj C. Patel, Sherry M.B. Thatcher, and Michael C. Campiona, "CEO succession, strategic change, and post-succession performance: A meta-analysis", The Leadership Quarterly, Volume 28, Issue 6, December 2017, Pages 701-720.
- 12 ^ Gundemir, Seval, Astrid C. Homan, and Andrew M. Carton. “The Impact of Organizational Performance on the Emergence of Asian American Leaders.” Journal of Applied Psychology Vol. 104, No. 1 (2019): 107-122. https://www.apa.org/pubs/journals/releases/apl-apl0000347.pdf
- 13 ^ Chang, Xin (Simba), R. David McLean, Bohui Zhang, and Wenrui Zhang. “Do Patents Portend Productivity Growth? Global Evidence from Private and Public Firms.” (2018). https://papers.ssrn.com/sol3/papers.cfm?abstract_id=2371600
- 14 ^ Hunt, Jennifer and Marjolaine Gauthier-Loiselle. “How Much Does Immigration Boost Innovation?” American Economic Journal: Macroeconomics Vol. 2, No. 2 (2010): 31-56. https://www.aeaweb.org/articles?id=10.1257/mac.2.2.31
- 15 ^ Measurement error in Asian American population shares would bias estimates downward.
- 16 ^ The F-statistic, a measure of fit, for our instrument and other control variables is approximately 48 for Asian Americans and 68 for skilled (college-educated) Asian Americans. The threshold for a strongly predictive instrument is typically an F-statistic of at least 10.
- 17 ^ We combine survey data on patenting from the National Survey of College Graduates and Census population data to arrive at our estimates for college-educated Asian Americans, replicating a trivial equation from Hunt and coauthors (2010). For all Asian Americans, we assume that 90% of patenting is driven by college graduates (in line with Hunt’s data on all college educated immigrants) to predict patenting by the group as a whole.
- 18 ^ Hunt, Jennifer and Marjolaine Gauthier-Loiselle. “How Much Does Immigration Boost Innovation?” American Economic Journal: Macroeconomics Vol. 2, No. 2 (2010): 31-56. https://www.aeaweb.org/articles?id=10.1257/mac.2.2.31
The Bigger Picture is a publication series from Goldman Sachs Global Investment Research devoted to longer-term economic and policy issues, which complements our more market-focused analysis. For other important disclosures, see the Disclosure Appendix.