Goldman Sachs Research
The Credit Line
CRE: Will this time be different? (Karoui/Viswanathan)
10 April 2023 | 9:16AM EDT | Research | Credit Strategy| By Lotfi Karoui and others
More

Why the narrative has shifted from inflation hedge to financial distress

For most of 2022, the commercial real estate (CRE) market was praised for its strong fundamentals and its ability to provide multi-asset portfolios a decent hedge against rising inflation risk. One quarter into the year, the narrative has turned much more negative. The rapid run-up in CRE valuations over the past two years has made the asset class vulnerable to a higher for longer funding cost environment. This vulnerability has been further exacerbated by the downward pressure on net operating income from declining rent growth and, in some cases, rising vacancy rates. All in all, this backdrop has left CRE borrowers exposed to a higher risk of a payment shock on their liabilities, more so than households and non-financial corporations.

Not all property types are created equal

A one-size-fits-all approach to the CRE market loses sight of important fundamental nuances between the various property types. Office has been the subject of high investor focus in recent months, and rightly so, in our view. Many of this segment’s fundamental headwinds preceded last year’s back-up in policy rates. Other property types, however, have more favorable dynamics at play. While multifamily fundamentals have weakened over the past 6 months, the significant growth in apartments’ net operating income over the prior two years raises the bar for defaults. Similarly, industrial fundamentals remain strong.

Losses and contagion: Could this time be different?

While losses on commercial real estate loan portfolios can be large, the evidence from the last two decades shows that they typically follow a multiyear process. Whether the same pattern will prevail in this cycle is, however, up for debate. The good news is that the current headwinds facing the office property sector are not symptomatic of years of loose underwriting standards as was the case pre-S&L and global financial crises. The bad news is that relative to the last two decades, the office property sector has never been as oversupplied as it is today. Coupled with elevated funding costs, this reduces borrowers’ incentives to extend and modify existing loans, potentially resulting in more front-loaded losses relative to previous cycles. While smaller banks are particularly vulnerable to such a scenario, the risk of a vicious cycle of large leveraged losses and undercapitalized balance sheets is nevertheless low, given healthier fundamentals in other CRE subsectors and strong capital positions among the large money center banks. That said, a potentially more front-loaded path for losses could constrain risk appetite in other spread products, given the overlap with the CRE investor base.

CRE: Will this time be different?

Why last year’s friend has become this year’s foe

Until a few months ago, the commercial real estate (CRE) market was praised for its strong fundamentals and its ability to provide multi-asset portfolios a decent hedge against rising inflation risk. As a real asset, higher CRE transaction prices are generally offset by higher rental income, driving a positive historical correlation between inflation and CRE total returns. This textbook pattern played out remarkably well in 2022, with the asset class proving to be a valuable source of diversification for multi-asset portfolios, delivering superior returns to public markets. Data collected from the National Council of Real Estate Investment Fiduciaries show CRE delivered a 5.5% total return in 2022; a significant outperformance when compared to the -15.8% vs. a 60%/40% portfolio that comprises the S&P 500 and the Bloomberg Agg index (Exhibit 1).

Exhibit 1: Private CRE vehicle outperformed the public fixed income and equity markets in 2022

Annual total returns for the NCREIF private real estate index vs. a 60%/40% portfolio that comprises the S&P 500 and the Bloomberg Agg indices
1. Private CRE vehicle outperformed the public fixed income and equity markets in 2022. Data available on request.
Source: Bloomberg, NCREIF, Goldman Sachs Global Investment Research
On the fundamental side, the market was also in a position of strength, at least relative to the run-up to the global financial crisis or the S&L crisis of the late 1980s. Owing to tighter underwriting standards, a tougher regulatory environment that introduced risk retention rules for CMBS issuers and affiliated parties, lower loan-to-value and higher debt service coverage ratios (Exhibit 2), credit quality notably improved in the decade that followed the aftermath of the global financial crisis. This fundamental strength has also kept delinquencies in benign territory. Using the universe of securitized commercial real estate loans in CMBS portfolios as a proxy, Exhibit 3 shows that delinquency rates have reverted to their pre-COVID lows in 2022. Granted, some of this fundamental strength mechanically reflected the tailwind from years of near-zero policy rates. Still, many of the lessons of the 2008/2009 episode appear to have been learned, especially as it pertains to underwriting standards.

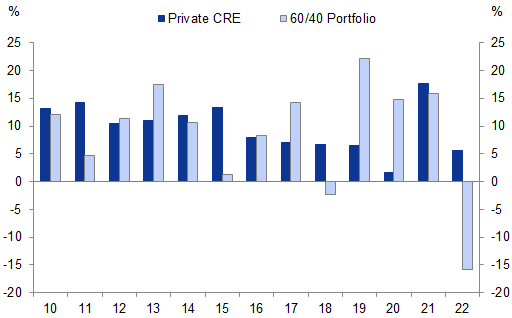
Exhibit 2: Leverage on CMBS has fallen over the past decade while debt coverage has improved

Average loan-to-value (LTV) and debt service coverage ratios (DSCR) on conduit commercial mortgage-backed securities (CMBS) by vintage year
2. Leverage on CMBS has fallen over the past decade while debt coverage has improved. Data available on request.
Source: Trepp, Goldman Sachs Global Investment Research

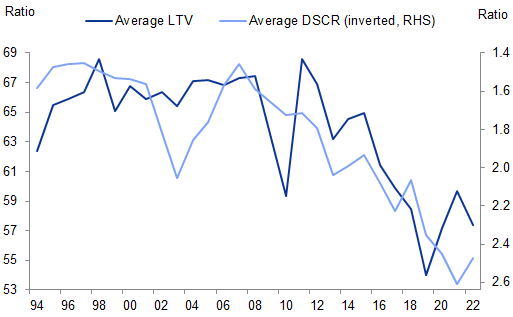
Exhibit 3: Delinquencies remain in benign territory

30-day delinquency rates on conduit commercial mortgage-backed securities (CMBS)
3. Delinquencies remain in benign territory. Data available on request.
Source: Intex, Goldman Sachs Global Investment Research
One quarter into the year, the narrative vis-à-vis the CRE market has turned much more negative (Exhibit 4). So why have the tides shifted so quickly? The rapid run-up in CRE valuations over the past two years has prompted many market participants to question the asset class’s vulnerability to a higher for longer funding cost environment (Exhibit 5). Recent headlines about a few strategic defaults among office property landlords, coupled with growing downward pressure on net operating incomes (NOI) from declining rent growth and, in some cases, rising vacancy rates have further exacerbated these concerns. As we discussed a few months ago, CRE borrowers, more so than households and non-financial corporations, do face a higher risk of a payment shock on their liabilities, given the aggressiveness of this hiking cycle.

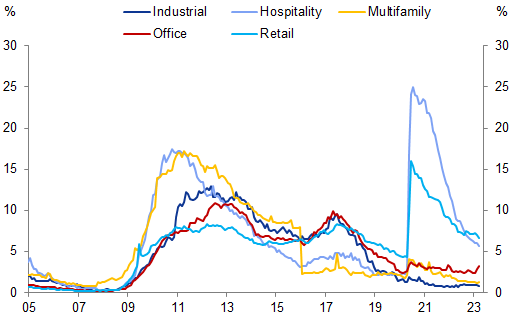
Exhibit 4: CMBS spreads have materially underperformed in recent weeks

4. CMBS spreads have materially underperformed in recent weeks. Data available on request.
Source: Bloomberg, Goldman Sachs Global Investment Research

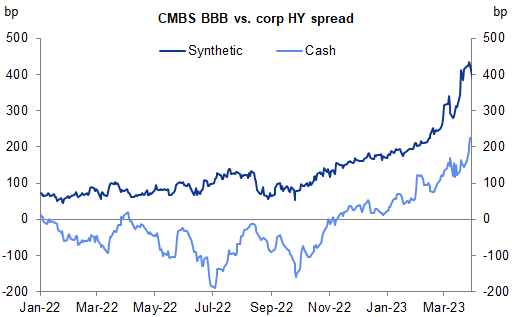
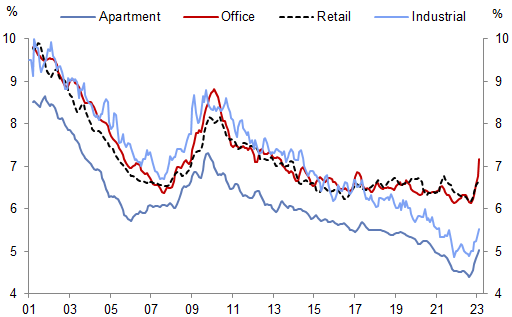
Exhibit 5: The rapid run-up in CRE valuations over the past two years has many market participants questioning vulnerability to a higher for longer funding cost environment

5. The rapid run-up in CRE valuations over the past two years has many market participants questioning vulnerability to a higher for longer funding cost environment. Data available on request.
Source: RCA, Goldman Sachs Global Investment Research
More specifically, three drivers make the transition to a higher funding cost environment more challenging in the CRE market:
  • First, although greater guardrails have been put in place to contain systemic risk, CRE borrowers have increased their exposure to floating rate liabilities over the past few years. Using the universe of securitized commercial real estate loans in the CMBS market as a proxy, Exhibit 6 shows that the issuance of floating rate CRE loans has materially increased in recent years. While lenders often require floating rate loans to be paired with interest rate caps (tied to SOFR), borrowers are still exposed to higher rates up to the cap’s strike. Perhaps more importantly, the duration of the cap is generally shorter than the duration of the mortgage at full extension, which means that hedges would need to be reset at a higher cost.

  • Second, in addition to the borrowers’ greater sensitivity to floating rate liabilities, near-term refinancing needs are also elevated. On our estimates, $1.07 trillion worth of mortgage loans will come due before year-end 2024 (Exhibit 7). Unlike residential mortgages, which tend to be fully amortizing, commercial mortgages generally have balloon maturities. This means that barring a dovish pivot by the Fed in upcoming quarters, many borrowers will likely have to refinance their fixed rate loans at higher rates. And while the recent significant widening of CMBS spreads may incentivize borrowers to extend their mortgages, such a move would come at the detriment of resetting the strike of their SOFR cap higher. Coupled with the ongoing pressure on NOI growth, this will likely diminish the ability and willingness of borrowers’ ability to refinance or extend loans, especially for beleaguered segments like mid- and low-tier Offices and brick-and-mortar Retail properties.

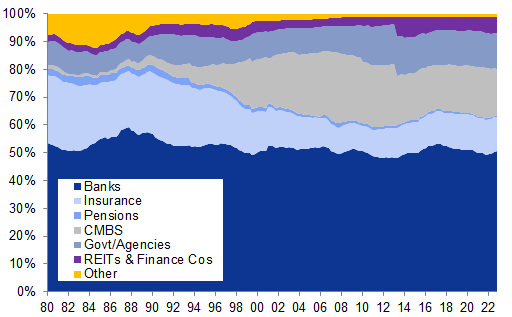
  • Third, financing conditions are likely to further tighten, going forward. Banks play an instrumental role in facilitating CRE transactions. Through the end of 2022, the amount outstanding of commercial mortgage loans in the US stood at $5.6 trillion. Over half of this stock sits directly on commercial bank balance sheets, with small banks capturing a much larger share than large banks (Exhibit 8). Small banks are particularly important to the CRE market: 70% of bank commercial mortgage holdings sit outside the top 25 largest banks (by assets). The potential for disruptions to US commercial real estate activity from a pullback in small bank credit availability is substantial, unaided by the fact that the segments most dependent on bank financing – offices and retail properties – are also facing the strongest risk of functional obsolescence. Outside of banks, the securitization market has also come under pressure, with the CMBS new issue pipeline drying up significantly. Year-to-date supply has declined materially vs. last year: -72% for conduit, -86% for single-asset/single-borrower, and -92% for CRE CLO.

Exhibit 6: The share of floating rate loans in CMBS portfolios has risen in recent years

Floating rate mortgages as a share of CMBS issuance
6. The share of floating rate loans in CMBS portfolios has risen in recent years. Data available on request.
Source: Trepp, Goldman Sachs Global Investment Research

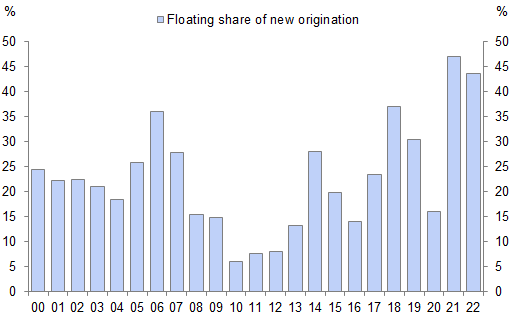
Exhibit 7: Refinancing needs are elevated over the next two years

Annual maturity walls on CRE loans
7. Refinancing needs are elevated over the next two years. Data available on request.
Source: RCA, Goldman Sachs Global Investment Research

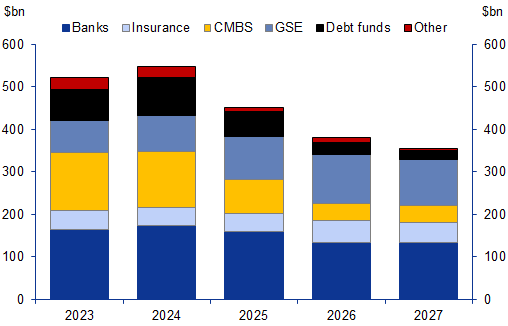
Exhibit 8: Over half of the CRE loans outstanding is owned by banks

Ownership structure of the CRE loan market
8. Over half of the CRE loans outstanding is owned by banks. Data available on request.
Source: Federal Reserve Board, Goldman Sachs Global Investment Research

Not all properties are created equal

A one-size-fits-all approach to the CRE market loses sight of important fundamental nuances between the various property types, the largest being office, retail, multifamily, industrial, and lodging properties. Office has been the subject of high investor focus in recent months, and rightly so, in our view. The segment’s fundamental headwinds preceded last year’s increase in funding costs. As shown in Exhibit 9, occupancy rates in office properties have been declining over the last few quarters, more so than in other property types. Office utilization, a more precise measure of office attendance is also down 51% nationwide relative to the pre-COVID period, according to data collected from Kastle Systems. Data on lease absorptions, i.e., the amount of new lease inventory net of vacancies and non-renewed leases, is now deeply negative, which points to a weak demand backdrop (Exhibit 10). At the same time, rent growth has also been more mediocre than in other property types (Exhibit 11), putting downward pressure on NOI and fueling a 25% year-over-year decline in property values, according to appraisal estimates from Green Street, as well as an uptick in defaults.
Other property types have more favorable dynamics at play. Multifamily properties were a favored segment from 2020Q3 through 2022Q3 for three key factors, First, the post-GFC undersupply of housing benefited apartment property values. Second, the policy-induced shock to mortgage affordability made rental housing a more compelling option for many prospective homeowners. Third, the relatively short lease terms for apartments allowed landlords to pass higher costs through to rents as inflation ran hot. And while multifamily fundamentals have weakened over the past 6 months, as evidenced by weak absorption of new leases on the market, the significant growth in apartments’ net operating income over the prior two years raises the bar for defaults. The main risk in our view is supply, particularly as new construction continues to accelerate, particularly in the Sun Belt region.
Retail properties entered the pandemic in a challenging position, as shifting consumer tastes and e-commerce were driving foot traffic away from traditional brick-and-mortar properties. While a retail default cycle has already materialized, particularly for regional malls, recent data suggests stabilization in vacancy rates and rent growth (again, Exhibits 9 and 11).
The lodging industry was similarly disrupted by the reduction in travel through the pandemic. While hotels tailored for business travel continue to struggle, many other types of hotels have seen a steady recovery in demand. Lastly, industrial properties (e.g., warehouse and logistics facilities) saw the strongest rent growth within commercial real estate. Industrial fundamentals remain strong given the lingering strength in industrial production, though the property type’s cyclical nature could leave it more exposed to a growth shock.

Exhibit 9: The decline in occupancy rates has been more pronounced for office vs. other types of properties

9. The decline in occupancy rates has been more pronounced for office vs. other types of properties. Data available on request.
Source: CoStar, Goldman Sachs Global Investment Research

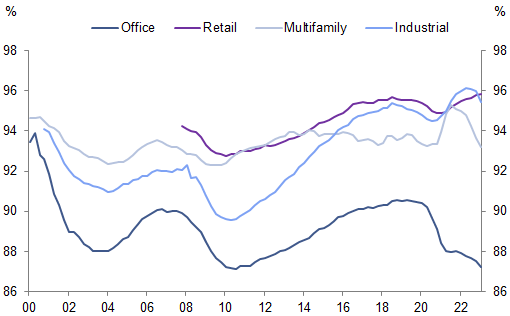
Exhibit 10: The trajectory of lease absorptions points to further spare capacity ahead for office properties

Office net lease absorptions are measured as the amount of new lease inventory net of vacancies and non-renewed leases
10. The trajectory of lease absorptions points to further spare capacity ahead for office properties. Data available on request.
Source: CoStar, Goldman Sachs Global Investment Research

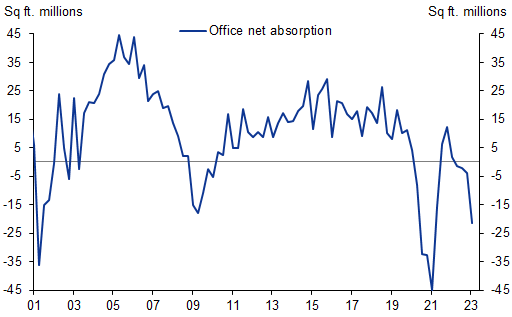
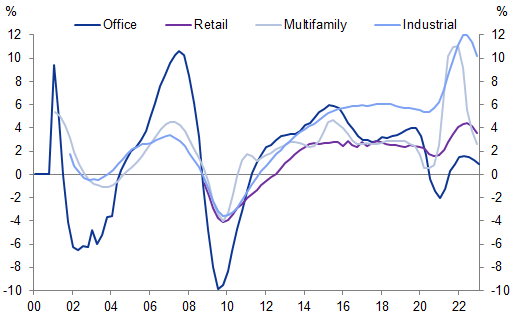
Exhibit 11: Rent growth has slowed down across the board

11. Rent growth has slowed down across the board. Data available on request.
Source: CoStar, Goldman Sachs Global Investment Research

Losses: Typically, a slow burn but this time could be different

We expect delinquencies on office loans to materially increase from today’s low levels, given rising interest expenses, elevated near-term refinancing needs, and declining occupancy rates, especially in the office property sector. However, the timing and the magnitude of losses stemming from delinquent CRE loans relative to previous cycles remains uncertain. The evidence from the last two decades shows while losses on commercial real estate loan portfolios can be large, they typically follow a multiyear process. Exhibit 12 shows that even following recessions, loss rates over a one-year period tend to stay muted, picking up only materially over longer horizons like 5 or 7 years. For example, losses on the 2007 and 2008 vintages of commercial loan mortgages started to accelerate almost four years later (Exhibit 13). This lag reflects the time-consuming nature of the process that takes place between the default event (i.e.: when a borrower stops servicing debt) and the collateral liquidation event (i.e.: when the collateral is liquidated). Often, borrowers and lenders are also incentivized to amend and extend the loans, which also spreads out the trajectory of losses over time.

Exhibit 12: Losses on CRE loans are typically a slow-motion process

1, 3, 5, and 7-year cumulative loss rates on annually refreshed CMBS vintages
12. Losses on CRE loans are typically a slow-motion process. Data available on request.
Source: Intex, Goldman Sachs Global Investment Research

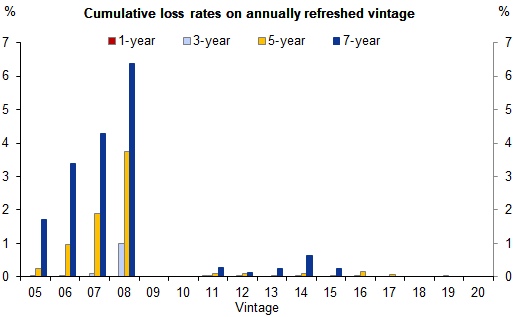
Exhibit 13: Losses in the 2007 and 2008 vintages were large but played over a long timeframe

Cumulative loss rates on the 2007 and 2008 CMBS vintages
13. Losses in the 2007 and 2008 vintages were large but played over a long timeframe. Data available on request.
Source: Intex, Goldman Sachs Global Investment Research
Could this time be different? The good news is that the current headwinds facing the office property sector are not symptomatic of years of loose underwriting standards as was the case in the run-up to the global financial crisis or prior to that in the late 1980s. Investors in CMBS 2.0 senior tranches also have higher loss subordination levels relative to the pre-global financial crisis period. All else equal, the higher credit quality of today’s cohort of borrowers should provide a decent offset to the current long list of headwinds that are pressuring the sector. The bad news is that relative to the last two decades, the office property sector has never been as oversupplied as it is today (again Exhibit 10). As old leases expire, office landlords will likely be forced to lower rents and/or accept lower square footage from tenants, which will further pressure NOIs and create more spare capacity. The more this negative loop persists, the less incentivized borrowers are to extend and modify existing loans and the more incentivized they are to strategically default and look to liquidate their properties. Under the surface, the market will likely be bifurcated between class A/A+ properties that can still command strong NOIs, vs. class B and C which face the highest risk of obsolescence. For the lowest quality offices, the most compelling course of action may be repurposing for other usages.
Beyond losses on CRE loan portfolios, another key area of concern relates to potential contagion to other parts of credit markets. Banks have been in focus as a potential channel for contagion. Smaller banks are particularly vulnerable to losses, which will likely fuel more pressure on balance sheets and credit availability in the broader economy. That said, we think the risk of a vicious cycle of large leveraged losses and undercapitalized balance sheets that would pose a threat to financial stability is still limited, given healthier fundamentals in other CRE subsectors, strong capital positions among the large money center banks, and the ability of banks to curtail office exposure going forward. Profitability will likely be challenged but the risk of a systemic shock that would emanate from large banks is limited, in our view. That said, a more front-loaded profile for losses could (and likely will) constrain risk appetite in other spread products, given the overlap with the CRE investor base (again Exhibit 9).

Investors should consider this report as only a single factor in making their investment decision. For Reg AC certification and other important disclosures, see the Disclosure Appendix, or go to www.gs.com/research/hedge.html.