Exhibit 1: Our weekly composite increased (+9.3% w/w) in the most recent week
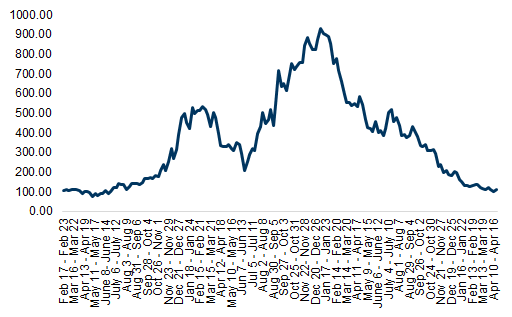
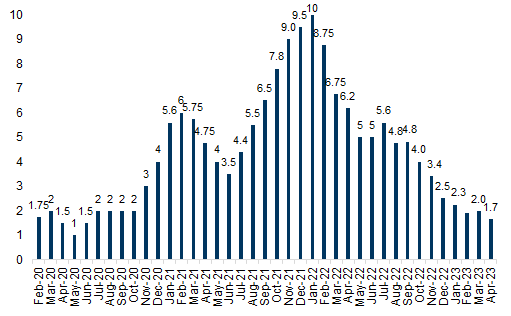
Exhibit 2: Our average bottleneck score for April is 1.7 - down significantly from the Dec21/Jan22 peak, and nearly in line with pre-pandemic levels
Transport Subsectors to Watch as Congestion Eases
Indicator Updates
Exhibit 3: Tracked Congestion Metrics
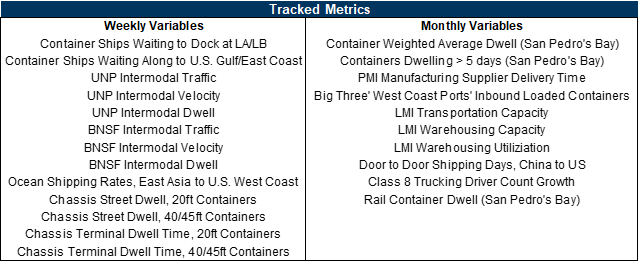
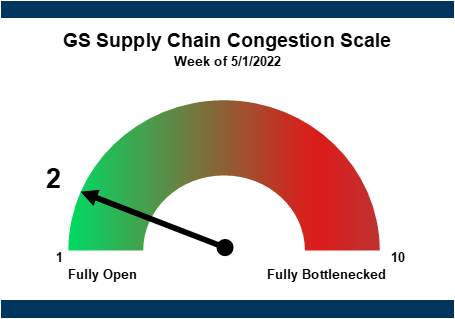
Exhibit 4: Bottleneck metrics were more mixed this week; certain overweighted variables (Ship Backlog, dwell times) deterioarted, pushing the index back slightly above '1'
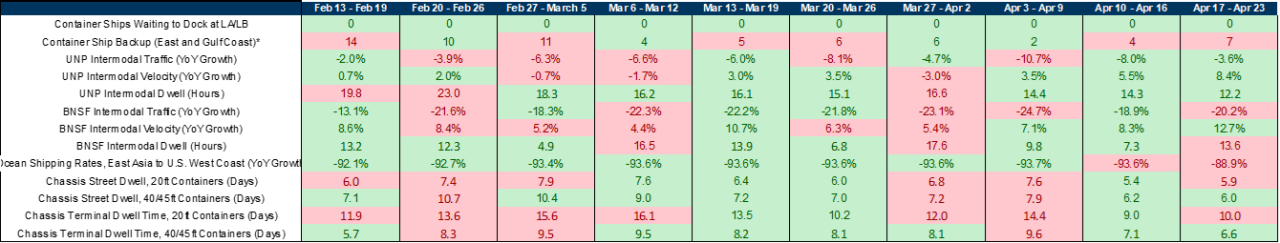
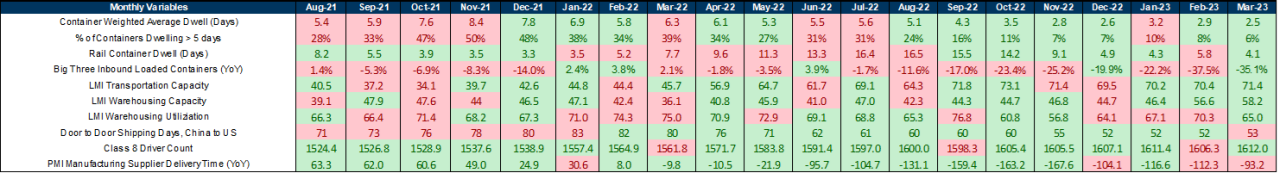
Exhibit 5: Most monthly bottleneck metrics improved sequentially in March
Weekly Indicator Update
Anchored Container Ships
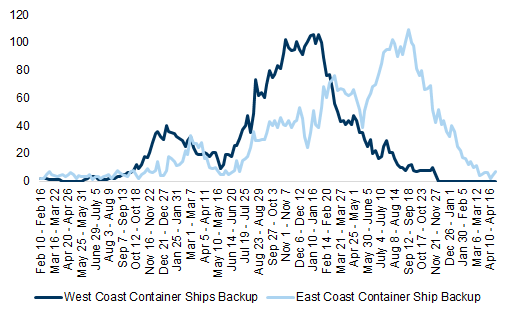
West Coast backlogs remained unchanged at 0 this week but East Coast backlogs increased from 4 to 7.
Exhibit 6: 7/0* container ships backed up this week on the East/West Coast
Rail Intermodal Trends
West Coast Class 1 Rails' (Union Pacific and Burlington Northern Santa Fe) combined intermodal traffic was largely unchanged in terms of YoY growth in reporting week 16 of 2023, as better traffic at UNP was offset by worse traffic at BNSF.
BNSF intermodal traffic at -20.2% YoY this week vs. -18.9% YoY last week; UNP intermodal traffic at -3.6% YoY vs. -8.0% YoY last week.
Note that intermodal volume declines have continued into April (Exhibit 8).
Exhibit 7: West Coast Class 1 Rails' Intermodal Volume Growth, Week 1 - Week 52
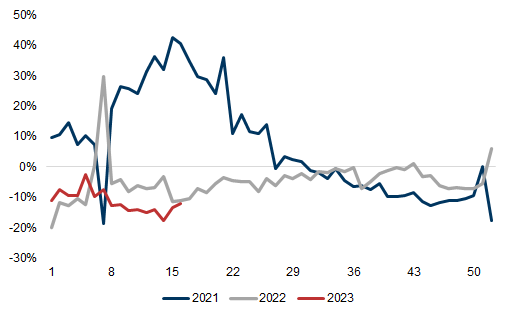
Exhibit 8: Intermodal volume declines (UNP and BNSF) have continued into April
West Coast Class 1 Rail intermodal speed improved, but dwell was mixed, in the most recent week.
BNSF intermodal dwell up to 13.6 hours from 7.3 last week; UNP dwell down to 12.2 hours from 14.3.
On intermodal velocity, BNSF +12.7% YoY vs. +8.3% YoY last week; UNP at +8.4% YoY vs. +5.5% YoY last week.
Chassis Dwell Time
Chassis dwell is showing sequential improvement when comparing the April data to the March average – as per Exhibit 9. Dwell metrics improved in the most recent week.
Average street dwell time for 20ft shipping container chassis was 5.9 days in reporting week 16, up from 5.4 hours in week 15.
Street dwell for 40/45ft container chassis was 6.0 days in week 16, down from 6.2 days week 15.
Chassis terminal dwell time for 20/40ft containers was at 10.0/6.6 days in week 16 versus 9.0/7.1 days in week 15.
Exhibit 9: Dwell for the more typical 20ft container chassis is showing sequential improvement in April
Ocean Shipping Rates
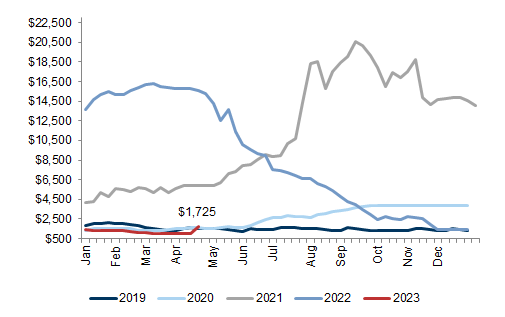
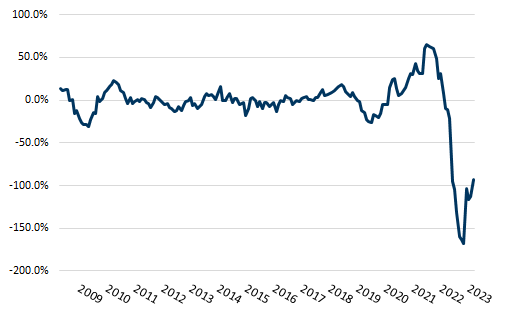
Ocean rates' YoY growth was better than -90% YoY for the first time in 14 weeks. The third week of April saw ocean rates tick back up to ~$1.7k (-89% YoY) from ~$1k, implying levels slightly above to more inline with Pre-Covid (versus below Pre-Covid levels for the last two months).
China to North America West Coast: ocean shipping rates -89% YoY in reporting week 16 versus -94% in week 15.
Exhibit 10: Ocean Container Shipping Rates, China/East Asia to North America West Coast
Monthly Indicators (March Data)
San Pedro's Bay Container Dwell
Container weighted average dwell time declined slightly to 2.5 days in March from 2.9 days in February at San Pedro's Bay, implying dwell down 60% YoY.
6% of the San Pedro's Bay containers were dwelling for more than 5 days in March -- this is down from ~50% at peak congestion levels and down slightly from February.
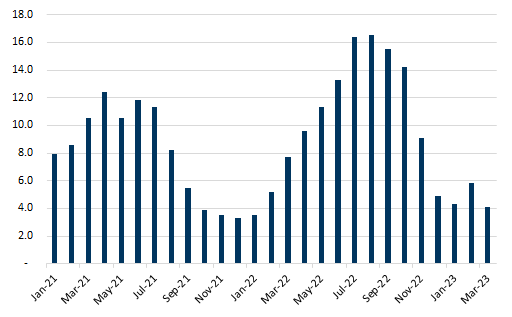
Rail container dwell moved down to 4.1 days in March from 5.8 days in February.
Exhibit 11: Container Weighted Average Dwell Time at San Pedro's Bay, Days
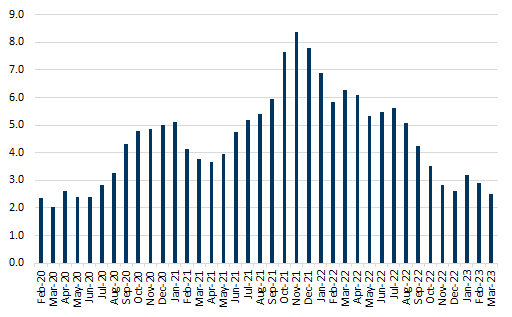
Exhibit 12: % of Containers Dwelling More than 5 Days
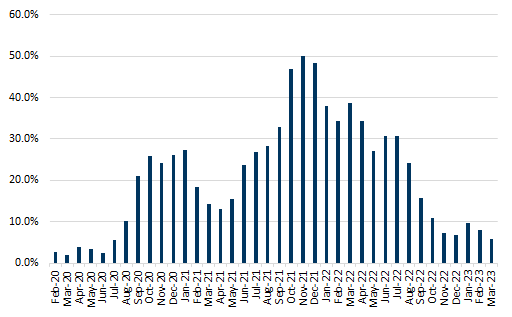
Exhibit 13: Rail Container Dwell Time, Days
"Big Three" West Coast Ports' Inbound Loaded Containers
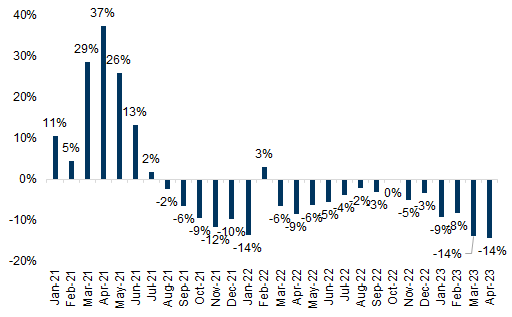
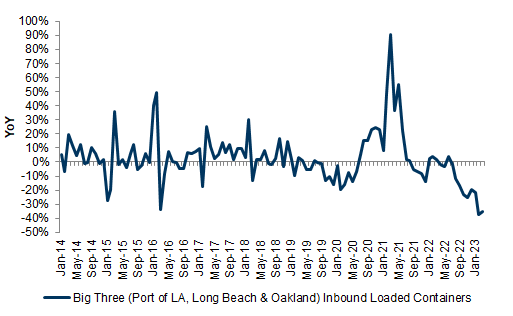
Total inbound containers for the Ports of LA, Long Beach, and Oakland -35% YoY in March.
Exhibit 14: West Coast Ports' Inbound Loaded Containers -35% YoY in March
Door to Door Shipping, China to US
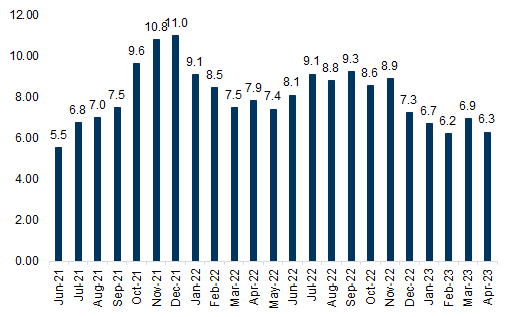
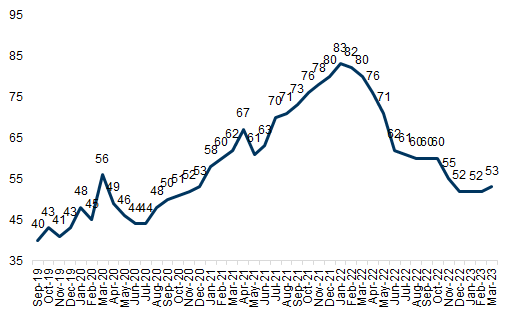
It was taking an average of 53 days to ship (door-to-door) from China to the US in March, largely unchanged from the prior 3 months.
Exhibit 15: Door to Door Shipping Days, China to US
Trucking Employee Count
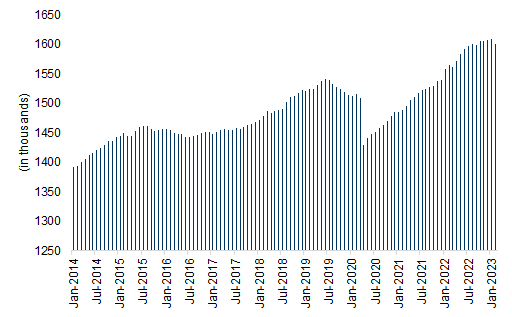
Truck transportation employee count remains above pre-pandemic highs (+4.7% above), with YoY growth averaging about 4% over the past six months. March's employee count increased 0.4% sequentially after declining 0.3% in February.
Exhibit 16: Total Truck Transportation Employee Count, Seasonally Adjusted
LMI Capacity and Utilization
LMI Transportation Capacity Index
Transportation capacity remained in expansionary territory in March, and the rate of expansion accelerated relative to February. March's reading was 71.4 versus 70.4 in February.
LMI Warehouse Capacity Index
Warehouse capacity remained expansionary in March after February rose above contraction territory for the first time in nearly 2.5 years. March's reading of 58.2 expanded from 56.6 in February.
LMI Warehouse Utilization Index
Warehouse utilization continued to increase in March with an above-50 reading. March's 65 reading fell from February's 70.3 reading, indicating a slower rate of utilization growth.
PMI Supplier Delivery Times
Delivery times contracted on an absolute basis (i.e., above 50 indicates contracting delivery times) given the 55.1 reading in March; this implies delivery times are growing nearly 2x slower than at this same time last year.
Exhibit 17: PMI: Manufacturing Suppliers' Delivery Times, YoY, Seasonally Adjusted
Appendix
Exhibit 18: The weekly composite index (light blue) leads the monthly (dark blue); expect future monthly updates to confirm recent weekly trends
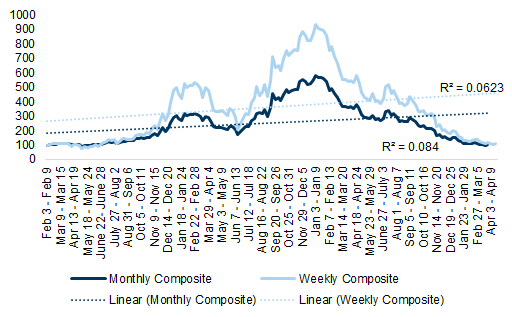
Exhibit 19: Our March monthly reading averaged 104, indicating a bottleneck score just above '1' when looking at all metrics (weekly and monthly combined)
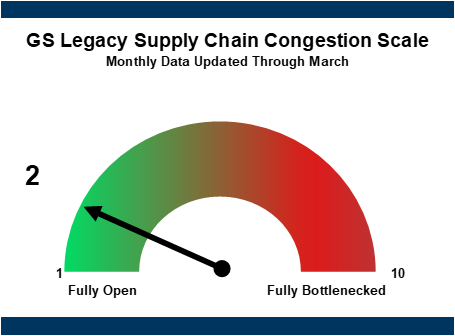
Exhibit 20: GS Legacy Supply Chain Congestion Scale (incorporates monthly and weekly data)
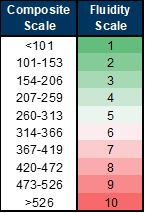
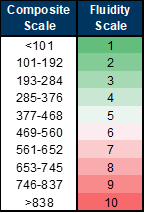
Exhibit 21: GS Weekly Supply Chain Congestion Scale (High-Frequency Data)
Glossary:
West Coast container ship backlog: tracks the number of container ships waiting to dock at the ports of LA and Long Beach; we add the number of ships anchored within 40 miles of the coast to the number of ships slow-steaming to port (AKA: ships loitering farther offshore) to get a better depiction of the true container ship backlog.
East Coast container ship backlog: estimates the number of container ships waiting to dock at the East and Gulf Coast ports in the US; based on satellite image data technology (Eikon), we add the number of container ships sitting for at least three days within 140 miles of a US port (accounts for ships to the right of 100 degrees of longitude to account for East Coast).
Intermodal traffic: tracks Y/Y intermodal carload volume growth for West Coast Class 1 Rails (BNSF and UNP). Accelerating volumes would indicate a more fluid supply chain for our purposes as more goods get moved through the system.
Intermodal velocity: tracks the average speed of the intermodal railcars (BNSF and UNP).
Intermodal dwell: tracks the average number of hours an intermodal railcar is idle (i.e., how long the car spends waiting at a terminal).
Chassis dwell: refers to the average time for chassis waiting on-terminal and on-street.
Rail container dwell: refers to the number of days a container waits to depart from a rail facility after being unloaded from an ocean carrier.
Container weighted average dwell: refers to the number of days a container stays at a marine terminal after being unloaded from an ocean carrier and taken off the premises by a truck.
Ocean shipping rates: refers to the average cost of shipping a container by ocean; we specifically track the cost of shipping from East Asia to the US West Coast via the FBX01 index from Freightos.
Big Three West Coast Ports' inbound loaded containers: refers to the Y/Y growth that the Big Three West Coast ports (LA, Long Beach, and Oakland) see in inbound loaded containers (i.e., how many more goods are moving through the port versus the same period last year).
PMI manufacturing supplier delivery time index: readings of 50 indicate no change in delivery times versus the prior month; readings above 50 indicate delivery times improved (faster supply chain) and readings below 50 indicated delivery times deteriorated sequentially (more delayed supply chain). The index is a result of IHS Markit's PMI business survey which asks purchasing managers, "Are your suppliers' delivery times slower, faster or unchanged on average than one month ago?"
China-to-US door-to-door shipping transit time: sourced from Freightos, this metric tracks the number of days it takes for a good to reach final destination (on average) once an order is placed and accepted (i.e., door-to-door shipping is not necessarily port-to-port as it also captures delivery times from port to final destination).
GS Data Works leverages alternative data sources and advanced analysis techniques to create unique data-driven insights across Global Investment Research. GS Data Works analysis (East Coast container ship backlog estimates) provided by Dan Duggan, Ph.D., Aditi Singh, and Parag Agrawal.
Goldman Sachs does and seeks to do business with companies covered in its research reports. As a result, investors should be aware that the firm may have a conflict of interest that could affect the objectivity of this report. Investors should consider this report as only a single factor in making their investment decision. For Reg AC certification and other important disclosures, see the Disclosure Appendix, or go to www.gs.com/research/hedge.html. Analysts employed by non-US affiliates are not registered/qualified as research analysts with FINRA in the U.S.