Goldman Sachs Research
The Credit Line
US Housing market crash turns not-so-sweet 16 (Ashworth)
10 October 2023 | 2:24PM EDT | Research | Credit Strategy| By Lotfi Karoui and others
More

Higher home prices and challenging affordability: How long can it last?

Despite mortgage rates now above 7% for nearly two months, home prices remain more robust than many might have imagined. While initial rounds of monetary policy tightening served to cool home price appreciation (HPA), the market seems to be recovering in a low demand and even lower supply environment. Two concerns have recently emerged. For investors, the impressive price appreciation since mid-2020 coupled with current significant affordability challenges have fueled concerns over the risk of a large drop in prices. For policymakers, the continued resilience of house prices in the face of higher mortgage rates has raised the question of whether monetary policy is tight enough.

History shows the current market has more stable fundamentals

Looking back to the last housing market crash, we compare conditions which led to a sharp correction in home prices and find market conditions to be far more stable currently. Credit availability, for example, remains relatively tight in the post-pandemic period and many of the other issues that plagued the 2004-07 housing market, like affordability mortgage products, no longer exist. The impact of tighter monetary policy has also been weaker because so many borrowers had already refinanced into attractive financing rates. That said, while housing and more generally consumer fundamentals are in a much stronger position today, affordability for the incremental buyer is worse than it was at the peak in 2006 before the crash. Absent any negative shocks to the broader economy that would either boost excess supply of homes on the market or fuel an uptick in unemployment, we continue to expect home prices to rise at a slow pace for the medium term by 1.8% by year-end 2023 and by 3.5% by year-end 2024 on a Q4/Q4 basis.

US Housing market crash turns not-so-sweet 16

Fifteen years ago, the government sponsored enterprises (GSEs) Fannie Mae and Freddie Mac entered conservatorship on September 6, 2008. This marked the finale of the housing market crash in the United States which picked up pace around a year earlier. Below we walk through some of the key drivers of that crash and compare to today’s environment. Many of the risks are no longer present in our reformed home lending system. And with limited inventory for sale and a large part of the mortgage population with attractive financing rates, housing appears robust for now. Still, two concerns have recently emerged. For investors, the impressive price appreciation since mid-2020 coupled with current significant affordability challenges have fueled concerns over the risk of a sudden large decline in prices. For policymakers, the continued resilience of house prices could argue for further monetary policy tightening.

Supply and demand are unsurprising core drivers of home prices

The US housing market is just like any other and pricing is subject to the simple mechanics of supply and demand, but perhaps further compounded by the fact that home purchases are also influenced by the supply and demand for financing. The interaction of these two curves is what we will try to explain below. First looking at the moves in home prices and using the 2004-09 period as an example (Exhibit 1); home supply started growing in mid-2005 and home price appreciation slowed eventually to a negative year-over-year growth rate by mid-2007, ultimately reaching the most negative run rate by late 2008. Only when months' supply of homes dropped did home price depreciation recover. The current low home inventory could help explain why home prices appear to be resilient despite the challenging affordability environment we find ourselves in.
Looking at the demand side of the equation in Exhibit 2, home price depreciation was also amplified by a drop in demand as seen in new and existing home sales. Home price depreciation started to recover to positive territory after government attempts to spur demand in the form of first-time buyer tax credits (the two spikes in the 2009 period) and an eventual loosening of credit conditions for mortgages. During the depths of the pandemic, the fall in demand was relatively short lived and ultimately spiked as the implied value of shelter rose during the shutdown period.

Exhibit 1: Sharp rise in supply of homes for sale put downward pressure on home prices

Months' supply of new and existing homes vs. % year-over-year change in home prices
1. Sharp rise in supply of homes for sale put downward pressure on home prices. Data available on request.
Source: US Census, National Assoc. of Realtors, S&P Case Shiller Corelogic, Goldman Sachs Global Investment Research

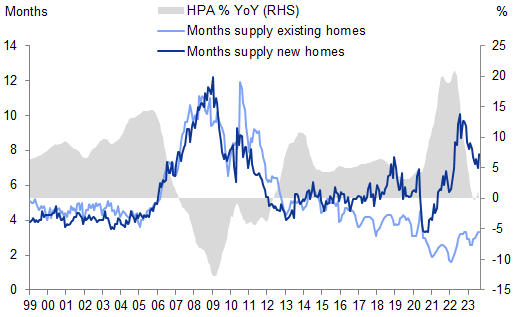
Exhibit 2: Demand helped drive home prices higher

New and existing home sales vs. % year-over-year change in home prices
2. Demand helped drive home prices higher. Data available on request.
Source: US Census, National Assoc. of Realtors, &P Case Shiller Corelogic, Goldman Sachs Global Investment Research
When thinking about home prices, it is also important to keep the supply and demand of credit in mind. Exhibit 3 shows that credit was readily available during 2004-07 and quickly dropped to historically scarce conditions by 2008. This widespread extension of credit allowed for home prices to rise despite home prices reaching a level of unaffordability which was only eclipsed by the recent high interest rate environment. Credit availability generally loosened until 2019, but quickly reversed during the pandemic, and tightened again as interest rates rose over the past couple years. We now find ourselves with home prices at their most unaffordable level on record combined with generally tight credit conditions.

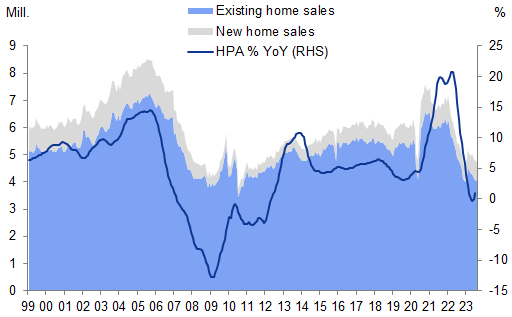
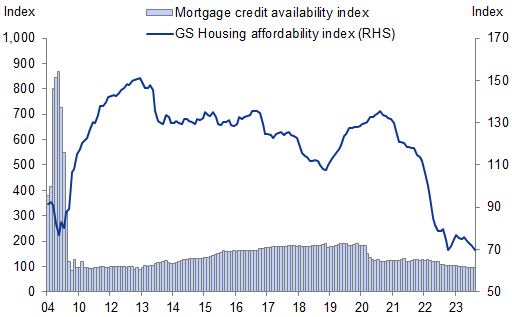
Exhibit 3: Despite tight housing affordability, very loose credit standards allowed home prices to rapidly rise

Mortgage credit availability and GS housing affordability indices
3. Despite tight housing affordability, very loose credit standards allowed home prices to rapidly rise. Data available on request.
Source: National Association of Realtors, Mortgage Bankers Association, Goldman Sachs Global Investment Research

The sequence of events that led to the last crash

Looking back at the ‘housing bubble’ time period, the share of MBS issuance that went to the private market rose from ~20% up to ~55% at its peak. This share fell to effectively 0% in the depths of the Great Recession and slowly recovered to less than 5% annually in the following decade. In our view, Exhibit 4 broadly reflects the credit availability metric in Exhibit 3. Below we will try to frame the conditions of the 2004-2007 period, focusing on dynamics in the private lending markets that helped create and subsequently pop the bubble in US home prices.

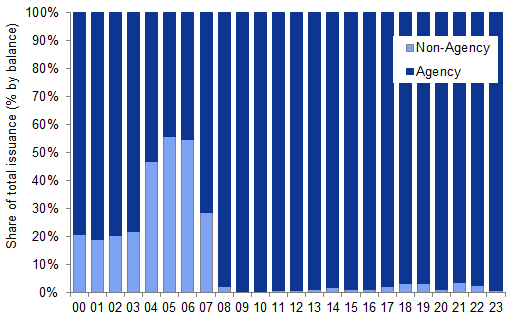
Exhibit 4: Non-Agency MBS share of issuance rose (and fell) dramatically from 2003 to 2007

Share of non-agency vs. agency MBS over time
4. Non-Agency MBS share of issuance rose (and fell) dramatically from 2003 to 2007. Data available on request.
Source: eMBS, Corelogic, Goldman Sachs Global Investment Research
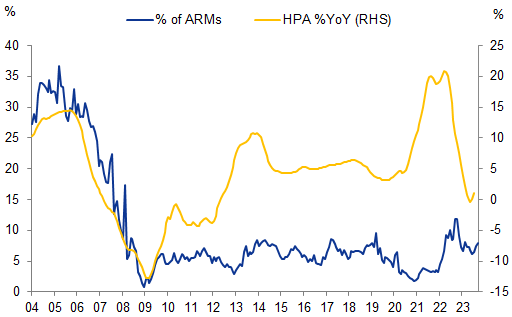
  • Affordability products and taking cash out of home equity helped home prices rise. To further highlight the looseness of credit conditions leading up to the GFC, Exhibit 5 shows that nearly 50% of the loans issued into non-agency MBS were for borrowers refinancing to take out equity, thereby allowing home prices to continue their rise. Additionally, initial borrower payments were lower than for 30-year fixed rate loans at the time. Most originations were adjustable rate mortgages (ARMs) which reached a peak of 80% of all non-agency MBS and 30% of all mortgages (Exhibit 6). Home prices were spurred on with these ‘affordability’ products. Looking to recent experience in both cases, the recent sharp rates selloff served the purpose of limiting cashout refinances and the inverted yield curve (along with post-GFC lending standards) has limited the origination share of ARMs.

Exhibit 5: Taking cash out of one’s home was common as home prices rose

Cashout refinance share of MBS originations
5. Taking cash out of one’s home was common as home prices rose. Data available on request.
Source: eMBS, Goldman Sachs Global Investment Research

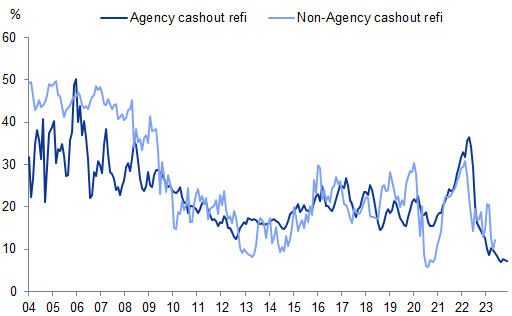
Exhibit 6: Affordability mortgage products were common in the private market

Adjustable rate mortgage (ARM) share of total originations and YoY home price appreciation
6. Affordability mortgage products were common in the private market. Data available on request.
Source: Mortgage Bankers Association, Goldman Sachs Global Investment Research
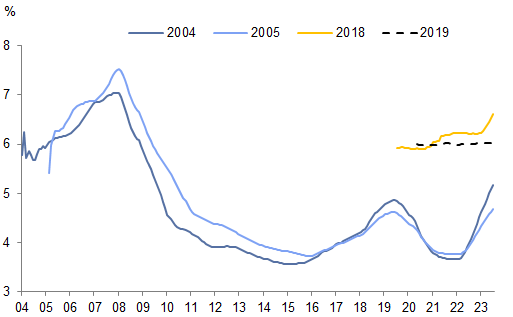
  • Mortgage rates started to adjust. Before the local home price peak in 2006, ARM rates started to adjust higher as loans reached the end of their initial, fixed-rate period of 2-3 years. Using the 2004 origination year as an example, the weighted average coupon (WAC) of loans rose to nearly 9% on these ARMs (Exhibit 7). Higher loan payments started to translate into weaker home prices. Again, in the relatively small non-agency MBS market of ARMs today, mortgage rates tend to be fixed for 5 years or more.

Exhibit 7: Mortgage rates adjusting higher happened around the peak in home prices

Non-agency MBS weighted average coupon (WAC) by origination year
7. Mortgage rates adjusting higher happened around the peak in home prices. Data available on request.
Source: Corelogic, Goldman Sachs Global Investment Research
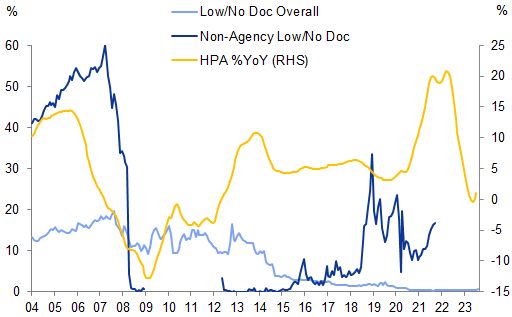
  • Credit availability pulled back sharply. After rate resets, home prices experienced another negative impulse in the form of a sharp pullback in credit availability. Using the non-agency share of loans with either limited or no borrower underwriting documentation as a proxy for underwriting standards rapidly pulled back over the second half of 2007 into 2008 (Exhibit 8). Borrowers were facing far fewer options for financing as the market effectively shut down and home prices fell further. Today, most loans originated in the mortgage market have fully-documented borrowers.

Exhibit 8: Credit availability rapidly tightened, further pressuring home prices

Percentage of low/no documentation mortgage origination share of non-agency MBS and overall market relative to today and YoY home price appreciation
8. Credit availability rapidly tightened, further pressuring home prices. Data available on request.
Source: Corelogic, Black Knight, Goldman Sachs Global Investment Research
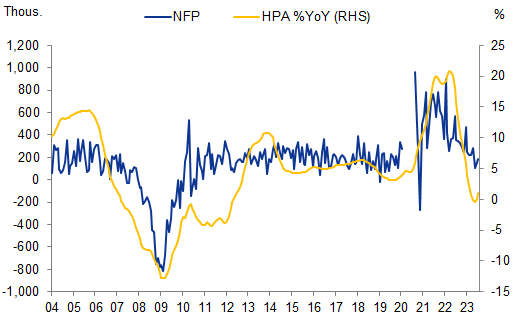
  • Excess supply was building off market and job losses drove prices to the depths. Around the same time that credit availability tightened in 2007, delinquency rates, which were already rising from previously mentioned trends like ARM resets, took another leg higher as borrowers were faced with fewer financing options (Exhibit 9). Not only was the months' supply of homes high as in Exhibit 1, there was also a buildup in ‘shadow’ inventory of homes of borrowers facing foreclosure even before job losses started (Exhibit 9). And then, as non-farm payrolls shifted into materially negative territory, home prices were pushed to the depths as lending markets seized and borrower demand fell (Exhibit 10).

Exhibit 9: Seriously delinquent borrowers were another form of excess supply of home inventory

2004 and 2005 non-agency MBS 60+ day borrower delinquency rates (% by balance) vs. recent private market origination
9. Seriously delinquent borrowers were another form of excess supply of home inventory. Data available on request.
Source: Corelogic, Goldman Sachs Global Investment Research

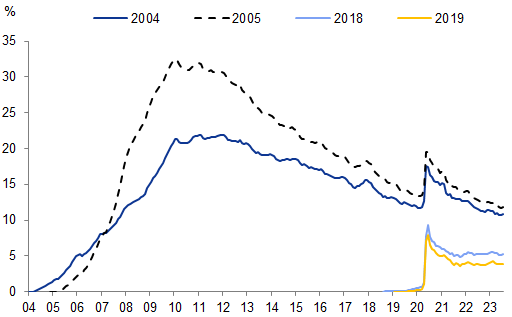
Exhibit 10: Material job loss removed home demand and drove prices to the depths

Non-farm payrolls (‘000) and YoY home price appreciation
10. Material job loss removed home demand and drove prices to the depths. Data available on request.
Source: Bureau of Labor Statistics, Goldman Sachs Global Investment Research

Affordability is offset by low inventory and the ‘lock-in’ effect today

Looking to today’s conditions, we see few of the same issues that contributed to the home price crash, but affordability from high interest rates remains a key area of concern. These concerns are generally offset by very limited supply of homes for sale and the fact that many mortgage borrowers have far lower fixed rates than the current ~7%, 30-year fixed rate mortgage. We continue to hold the view that home prices are not on the brink of collapse despite current interest rates; instead we project them to slowly rise. Absent a broader economic shock, we expect this trend of stable home prices to continue.
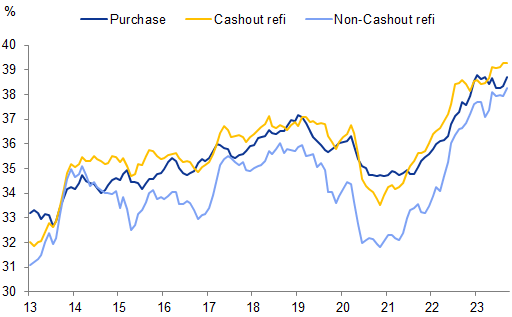
  • Borrowers are stretching on payment. One notable trend is that borrowers are stretching on mortgage payment relative to their income. Exhibit 11 shows borrower debt-to-income (DTI) ratios at origination over time for agency mortgages. Home purchaser mortgage payments are now averaging ~39% of income according to agency loan level data. Approximately one third of borrowers have a DTI over 43%, the initial threshold set up under the first iterations of the qualified mortgage rules in the post-GFC period. This DTI should be alleviated, however, as our economists project ~3% real income growth next year.

Exhibit 11: Borrowers are stretching on payment relative to their income

Debt-to-income ratios of agency MBS issuance by type of origination over time
11. Borrowers are stretching on payment relative to their income. Data available on request.
Source: eMBS, Freddie Mac, Goldman Sachs Global Investment Research
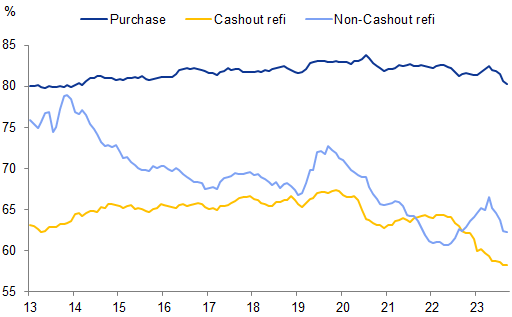
  • Borrowers are not taking as much leverage when taking cash out of the home. And while borrowers are stretching on their mortgage payment and cashout refinances do occur, borrower leverage is relatively low. LTV at origination for agency mortgage cashouts are now below 60%. Credit standards appear to be holding firm in this metric (Exhibit 12).

Exhibit 12: While cashout refinancings are happening, the level of leverage is far lower

Average loan-to-value (LTV) of agency MBS originations over time
12. While cashout refinancings are happening, the level of leverage is far lower. Data available on request.
Source: eMBS, Freddie Mac, Goldman Sachs Global Investment Research
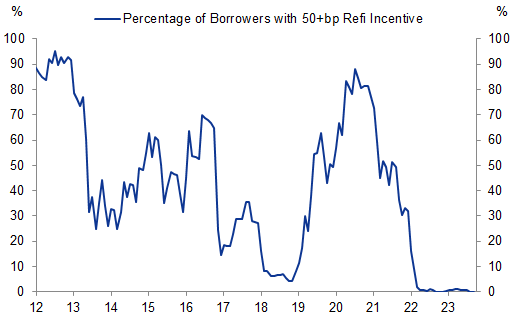
  • Affordability is challenged by high rates: Regardless of current credit standards, affordability remains challenging for the incremental home buyer. To put this in context in the simplest form we know of, Exhibit 13 stacks up the median sale price of an existing home vs. a theoretically ‘affordable’ home price. This affordable home is calculated by assuming a borrower spends 25% of gross household income on a mortgage payment, uses a 15% down payment, and borrows the remainder with a 30-year fixed rate mortgage. Looking over the time series, homes traded rich during 2004-07 because of the previously mentioned issues and subsequently fell as excess supply hit the market. Because interest rates fell and household income was relatively flat in the post-GFC period, there was a general pull upward on home prices that could partly be accounted for by tight credit conditions. But now that interest rates have reversed course and are now far higher, affordability for the incremental home buyer is more challenged than during the 2004-07 period. But, the limited supply of homes for sale remains very low and most of the mortgage market has mortgage rates far below current levels (Exhibit 14). Additionally, borrower delinquency rates remain very low, further highlighting the fact there is little distress in the system. As a result, we continue to expect home prices to rise at a slow pace over the medium term.

Exhibit 13: Home prices are materially disconnected to affordability due to high rates

Median existing home sale prices vs. a simplified ‘affordable’ home
13. Home prices are materially disconnected to affordability due to high rates. Data available on request.
Source: National Association of Realtors, Freddie Mac, Bureau of the Census, Goldman Sachs Global Investment Research

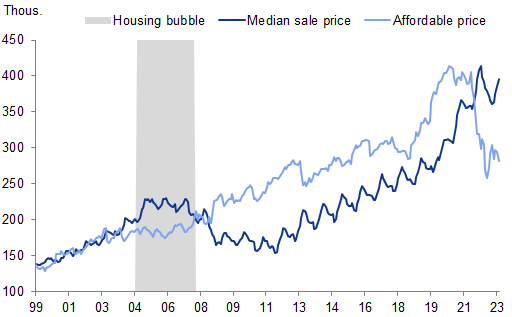
Exhibit 14: Percentage of outstanding 30-year conventional mortgages with at least a 50bp incentive to refinance

14. Percentage of outstanding 30-year conventional mortgages with at least a 50bp incentive to refinance . Data available on request.
Source: eMBS, Goldman Sachs Global Investment Research

Investors should consider this report as only a single factor in making their investment decision. For Reg AC certification and other important disclosures, see the Disclosure Appendix, or go to www.gs.com/research/hedge.html.