The Credit Line
US CRE, one year later: Volatile, dispersed, but not systemic (Viswanathan/Karoui)
Table of Contents
What have we learned a year later?
We take stock of the key trends that have emerged in the US CRE market over the past few quarters and assess the implications going forward. Overall, debt capital remains available for borrowers that can withstand more restrictive and costlier financing options. Refinancing needs have also been partially addressed via loan modifications – a trend we think will persist. From a credit performance standpoint, the share of loans behind on their debt service payments or being worked out by lenders has increased. But this increase is yet to translate into higher losses on loan portfolios, keeping systemic concerns in check. Lastly, aside from office properties, property operating performance has generally remained resilient, though dispersion across and within property types has been elevated. Save for apartments, newer and higher-quality properties will likely continue to outperform older properties, in our view. And while some regional supply overhang will keep weighing on near-term net operating income, the historically low level of construction starts bodes well for longer-term rent growth in apartment and industrial properties.
Cross-asset performance: No dislocation but a few pockets of value
Across public REIT equities, senior unsecured REIT bonds, and CMBS, valuations have somewhat normalized, though the gap with pre-COVID levels remains significant (and rightly so). Zooming in on single-asset/single-borrower (SA/SB) CMBS, outside of office collateral, bond performance has been strong over the past 12 months, mirroring a similar trend in public REIT equities. And while, much of the ‘easy money’ has been made in the new issue CMBS market, the opportunity set in the secondary market remains attractive. We see the best value in the SA/SB market in mezzanine bonds collateralized by retail or luxury hotel collateral while seeing compelling value in AAA CRE CLOs.
US CRE, one year later: Volatile, dispersed, but not systemic
A year ago, the US commercial real estate (CRE) market was caught in a perfect storm of headwinds. Aside from a higher cost of capital, concerns around credit availability (particularly from the banking system) have proliferated while post-pandemic shifts in consumer and corporate behavior, such as work-from-home and the continued growth of e-commerce, have driven higher utilization in some commercial properties and much lower utilization in others. Over the past few months, financial conditions have eased, and a key lesson has emerged: one size does not fit all when it comes to the US CRE market. With this backdrop in mind, this Credit Line takes stock of the current state of play and discusses the path forward. We focus on four areas: the debt financing backdrop, the credit performance of loan portfolios, property operating performance, and the cross-asset performance in public equity and fixed income markets.
As we discuss in more details below, we draw four key conclusions. The first is that credit availability has been resilient, suggesting the risk of a credit crunch is still remote and leaving us comfortable with our view that the likelihood of a systemic shock from the CRE market is low. The second is that modifications and extensions will likely remain a key channel through which borrowers address their refinancing needs. The third is that the resilience of the debt financing backdrop will likely continue to stabilize property performance, especially outside of the office sector. Lastly, on the market side, we think the magnitude and speed of erosion in the risk premium provided by the new issue CMBS market has shifted the opportunity set to bond selection in older vintages in the secondary market. We continue to favor exposures to single-asset/singe-borrower bonds collateralized by retail and luxury resort properties while also seeing value up the capital structure in AAA CRE CLO AAA floaters.
The debt financing backdrop: Healthy, all things considered
With over a year's worth of data since stress erupted in the regional banking system in March of 2023, we can now quantify the impact on credit availability across various lending channels. Using the Mortgage Bankers Association’s data on lenders’ balance sheets, Exhibit 1 shows that loan growth has slowed down but not contracted. Non-bank lenders (e.g., mortgage REITs) and CMBS have seen slightly negative net loan origination on a year-over-year basis. But life insurance companies have expanded their CRE loan portfolios.
Exhibit 1: In aggregate, banks have grown their CRE loan books on a year-over-year basis
Year-over-year percentage change in commercial mortgage debt outstanding by investor type
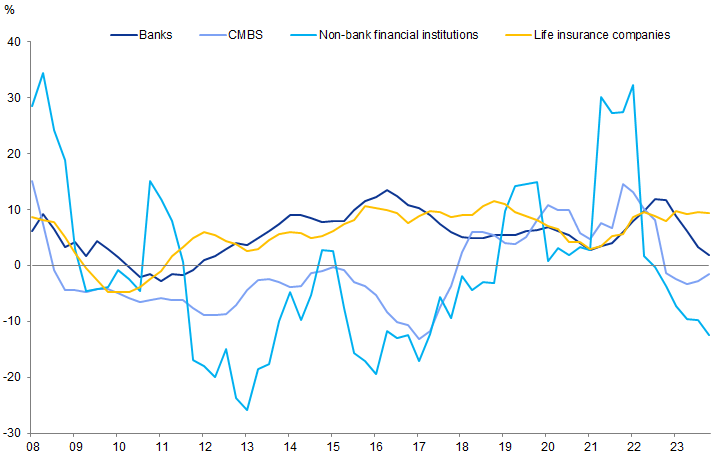
Source: Mortgage Bankers Association, Goldman Sachs Global Investment Research
For banks, the picture is more nuanced. Year-over-year CRE loan growth has remained positive despite last year's regional banks' failures. Perhaps more surprisingly, this growth appears to have been primarily driven by small banks. The 25 largest banks (in terms of domestic assets) have seen non-residential commercial and multifamily mortgage books shrink by 4% and 1%, respectively, on a year-over-year basis. By contrast, smaller banks have seen non-residential and multifamily mortgage books grow by 5% and 10%, respectively. Interestingly, while large banks have posted weaker loan growth, the most recent Federal Reserve Board’s Senior Loan Officer Opinion Survey showed that a higher share of smaller banks are tightening lender standards vs. large banks. We suspect that this puzzle is explained by the pullback of very small banks (with less than $100 million in assets), consistent with holdings data from FDIC call reports.
While loan growth has held up well overall, underwriting standards have remained tight. Using the CMBS market as a real-time proxy, the data shows a still largely lender-friendly backdrop. The primary market has recovered, with over $30 billion in year-to-date non-agency CMBS issuance vs. $10 billion year to date last year, on track for our full-year 2024 forecast of $60 billion. But as Exhibit 2 shows, the average loan-to-value ratio of CMBS loans remains very low vs. history. The single-asset/single-borrower market has also taken a larger share of issuance, with generally strong assets collateralizing these loans.
Exhibit 2: The average loan-to-value ratio for CMBS loans remains low by historical norms
Weighted-average conduit CMBS loan-to-value at-issuance
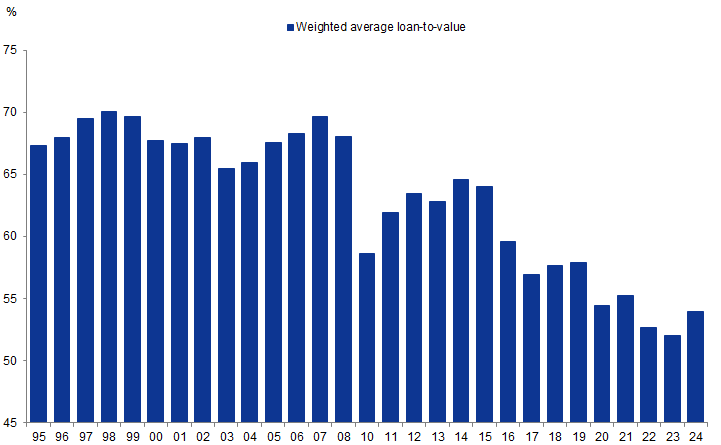
Source: Trepp, Goldman Sachs Goldman Investment Research
Overall, the data supports a clear message: financing options remain plentiful for assets that fit lenders’ standards and sponsors are willing to pay the current cost of capital. This conclusion, in our view, suggests that risk of a credit crunch is still remote and leaves us comfortable with our view that the risk of a systemic shock from the CRE market is low.
Credit performance: Higher delinquencies, but contained losses
While credit performance has generally continued to weaken, dispersion has been elevated across both lenders and borrowers. As shown in Exhibit 3, the share of office loans in CMBS portfolios that are either behind on their payments or in special servicing has continued to rise over the past year and a half. The multifamily and retail segments saw particularly large loans transfer into special servicing in April, though office collateral continues to drive the most delinquencies across all CMBS deal types. On the other hand, non-CMBS portfolios have generally seen lower delinquency rates based on the Mortgage Bankers Association data (Exhibit 4). Here again, somewhat surprisingly, small banks’ CRE loan portfolios have posted lower delinquencies vs. large banks.
Exhibit 3: The share of office loans in CMBS portfolios that are either behind on their payments or in special servicing has continued to rise over the past year and a half
The share of CMBS conduit loans that are 30+ day delinquent (left panel) and in special servicing (right panel)
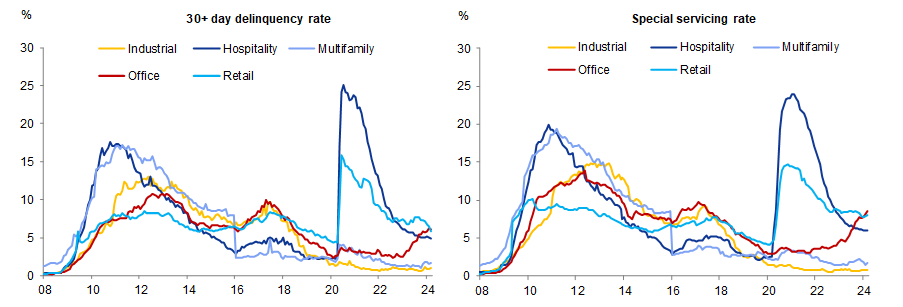
Source: Trepp, Goldman Sachs Global Investment Research
Exhibit 4: Small banks have demonstrated lower CRE delinquency rates than their larger peers
30+ day delinquency rates for balance sheet loans by lender type
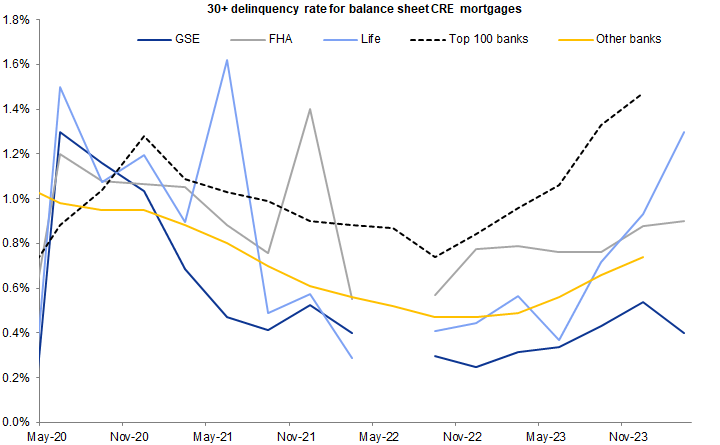
Source: Mortgage Bankers Association, Goldman Sachs Goldman Investment Research
For CMBS investors, higher delinquency rates have not yet translated into an uptick in losses. For context, the evidence from past cycles shows that CMBS cumulative losses typically peak roughly seven years after the first cracks emerge. This lag reflects the large share of balloon maturities and interest-only periods, long leases in some property types like office and industrial, and frequent workout periods before the loans are foreclosed. That said, one key difference today is the large wall of commercial mortgage debt maturities (Exhibits 5 and 6). The large share of near-term maturities is partly reflective of a notable uptick in extensions from loans maturing last year. Many of these modifications have involved more lender-friendly adjustments, such as the contribution of additional equity by the sponsor, a step-up in the loan’s coupon, and even the inclusion of a recourse guaranty by the sponsor (as was the case of a recent large Midtown NYC office loan in special servicing).
Exhibit 5: This year almost $1 trillion of commercial mortgages set to mature will need to be paid down, refinanced, or modified/extended
Total amount of commercial mortgage loan principal due at maturity by year, split by property type
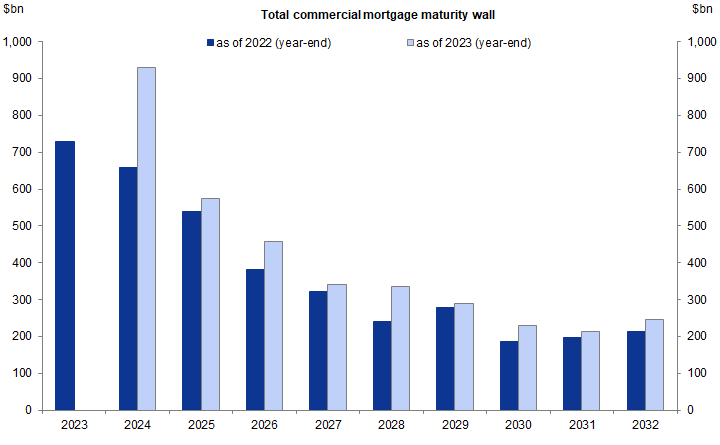
Source: Goldman Sachs Goldman Investment Research
Exhibit 6: The highest share of loans on record have initial maturities in the next two years
Share of loans maturing over the following two years (annually since 2008)
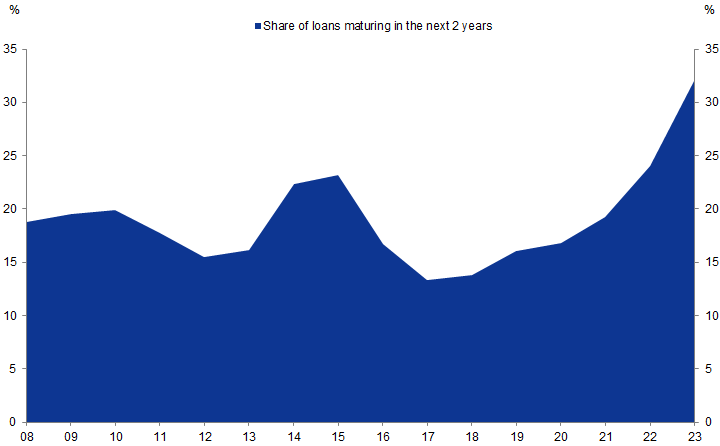
Source: Mortgage Bankers Association, Goldman Sachs Global Investment Research
We expect that this trend of modifications and extensions will continue over the near term, though added balance sheet pressure for banks or an incremental decline in property prices could eventually weaken lenders’ accommodative posture. We also continue to think current elevated funding needs will present an opportunity for non-bank lenders like private credit funds and insurance companies to deploy dry powder at attractive all-in yields.
Property operating performance: Signs of stabilization
Contrary to much of the negative sentiment around the CRE market, property operating performance has been resilient outside of offices, with industrial, retail, multifamily, and hotel/lodging properties all delivering positive net operating income growth on a year-over-year basis. Within property types, dispersion has been elevated. As an example, the worst performing subtype of commercial real estate in terms of rental income growth has been central business district (CBD) office buildings (Exhibit 7). Yet, recently constructed, LEED-certified CBD offices have boasted an impressive +8% rental income growth since 2022Q4, only trailing the performance of industrial logistics properties. For most property types, including hotels, retail spaces, and offices, lower-quality assets have generally underperformed higher-quality assets, while in the multifamily segment, low-rise and garden apartments have seen sturdier rent growth and occupancy rates vs. mid- and high-rise apartments.
Exhibit 7: While central business district offices are among the worst performing subtypes of CRE, recently constructed offices with LEED certification are among the best performing subtypes
Changes in market cap rate, sales price per square foot, occupancy rate, rent per square foot, and rental income per square foot since 2022Q4
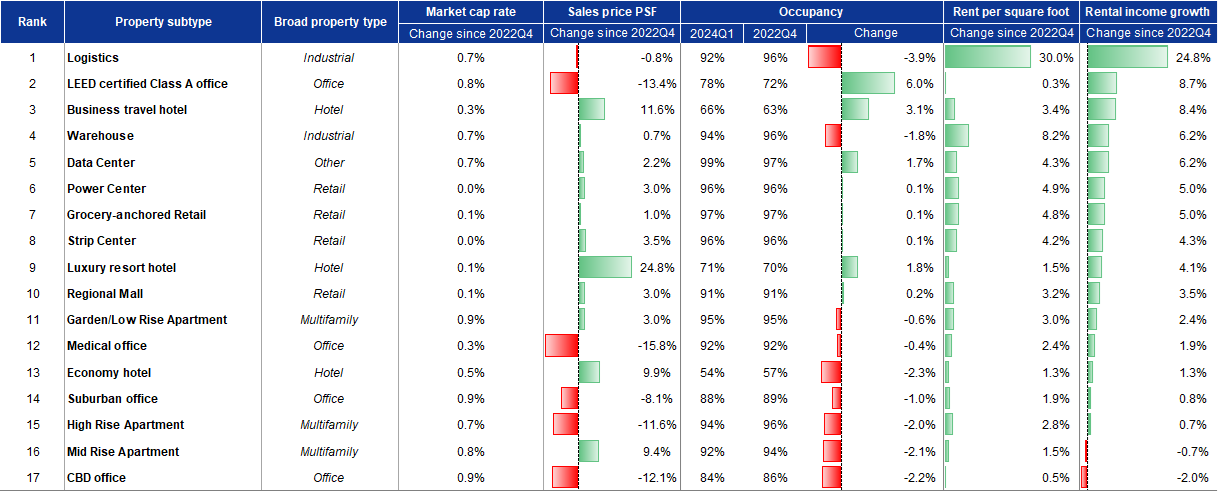
Source: CoStar, Goldman Sachs Goldman Investment Research
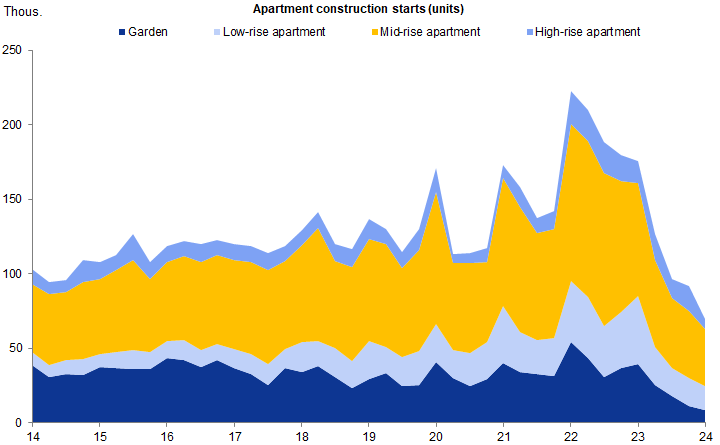
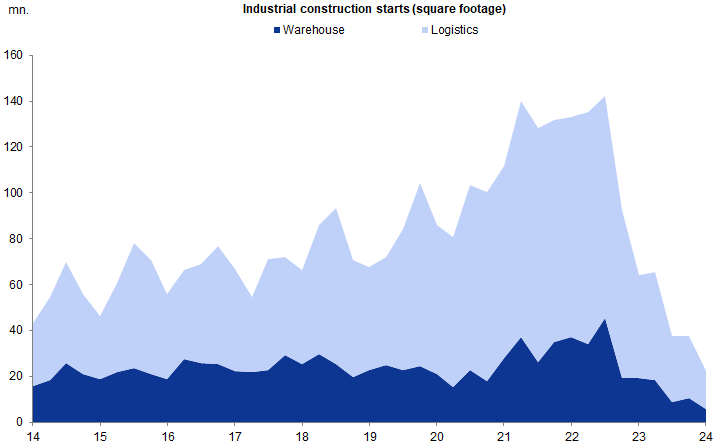
The dispersion in rent growth across and within property types has been largely driven by supply-demand imbalances (Exhibit 8). In fact, one of the most frequently asked questions on Q1 REIT earnings calls was whether a growing supply overhang for industrial and multifamily properties could tip the scales for supply vs. demand. While we think a growing supply overhang in the near term for the multifamily and (to a lesser extent) industrial segments is likely, we think it will remain concentrated across regions. This trend is already visible in apartment net absorption which is high in the supply-constrained Northeast but lower in the supply-laden Southeast. Looking past 2025, however, we think the construction environment will become more supportive for rent growth since construction starts for industrial properties and apartments have declined to 10-year lows (Exhibit 9 to 11). Our baseline forecast is for multifamily starts to inch up to pre-COVID levels by the end of next year, though a growing average time-to-completion for apartment developments could further delay new supply.
Exhibit 8: Leasing demand is outpacing supply for retail, industrial, and multifamily properties in aggregate
Quarterly CRE net absorption (in non-seasonally adjusted square footage terms)
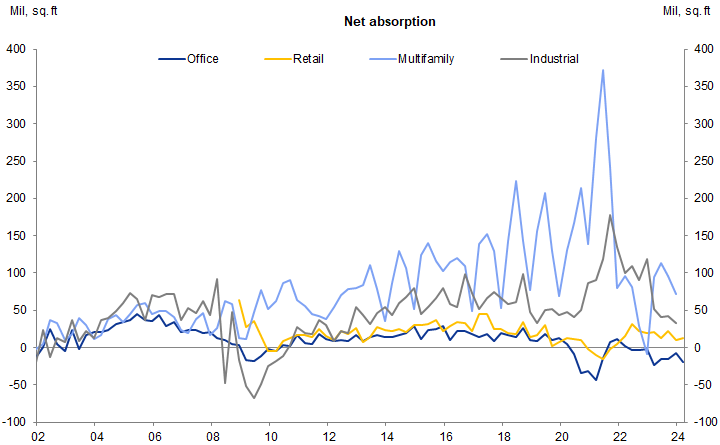
Source: CoStar, Goldman Sachs Global Investment Research
Exhibit 9: Multifamily, industrial, and hotel properties currently have the largest construction pipelines
Quantity of commercial property space under construction (measured in terms of rooms for hotels and square footage for other property types)
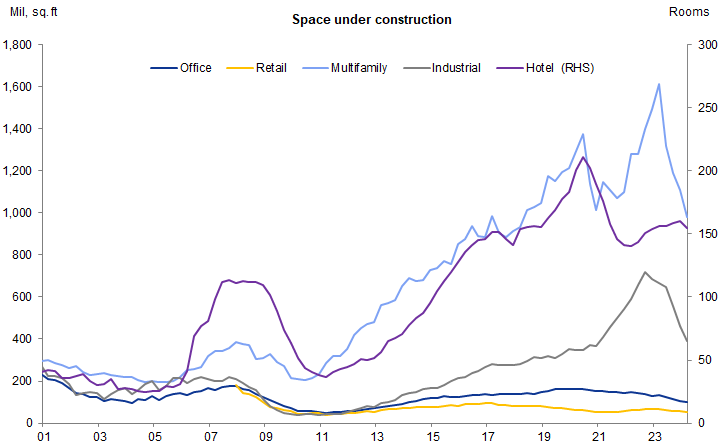
Source: CoStar, Goldman Sachs Global Investment Research
Exhibit 10: Construction starts have fallen sharply for apartments…
Quarterly construction starts for garden, low-rise, mid-rise, and high-rise apartments (nationwide in non-seasonally adjusted terms)
Source: CoStar, Goldman Sachs Global Investment Research
Exhibit 11: …and for industrial properties
Quarterly construction starts for warehouse and logistics properties (nationwide in non-seasonally adjusted terms)
Source: CoStar, Goldman Sachs Goldman Investment Research
Cross-asset performance in public markets: What a difference a year can make
Across both public equity and fixed income markets, investor sentiment has sharply recovered. Public REITs have closed a decent portion of the valuation gap vs. private REITs that opened in 2022, while corporate bond and new issue CMBS spreads moved sharply tighter (Exhibit 12). The one notable exception has been the secondary CMBS market, which unlike new issue CMBS, has not benefitted from any positive selection bias from tight underwriting standards.
Exhibit 12: Valuations of commercial real estate across the capital structure have returned to pre-SVB levels
Relative value of spreads for HY/IG REITs, BBB-/AAA cash CMBS, BBB-/AAA on-the-run CMBX, and Bloomberg P/E ratio for the S&P 1500 REIT index
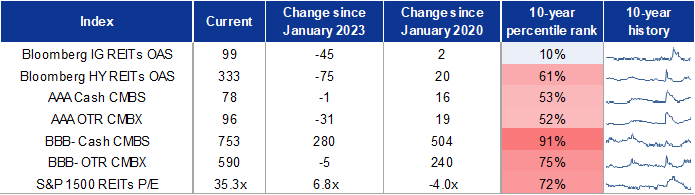
Source: Goldman Sachs Goldman Investment Research
Underneath the surface, the dispersion in credit and property performance has naturally spilled over to the CMBS and equity markets. This is illustrated in Exhibit 13 which shows cumulative total returns on single-asset/single-borrower (SA/SB) CMBS by collateral type: Office, Hotel, Industrial, Retail, and Multifamily. The immediate takeaway here is the large performance gap between office loans and the rest of the commercial mortgage market. Since the start of 2023, office SA/SB CMBS has delivered a cumulative total return of -12%, vs. +9% for other property types. The same pattern has prevailed within REIT equities, with strong outperformance of retail properties and sharp underperformance of office properties (Exhibit 14).
Exhibit 13: Using the SA/SB CMBS market as a gauge, office mortgages have delivered a negative total return over the past three years while the rest of the commercial mortgage market has delivered a positive total return
Cumulative total return for BBB- rated single-asset/single-borrower commercial mortgage backed securities (SA/SB CMBS) since January 2021 by property type, aggregated across deals by current balance
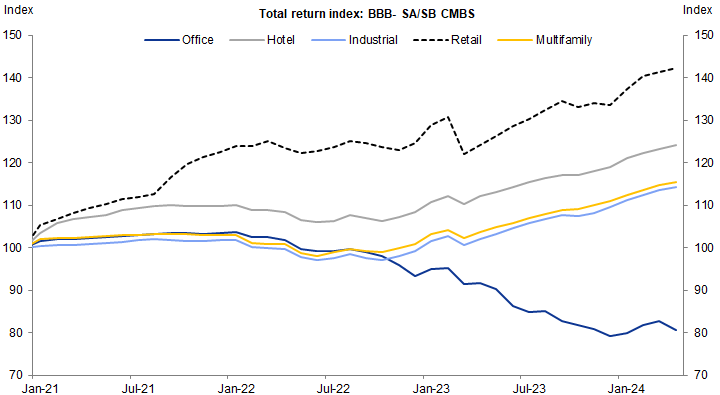
Note: We calculate total return using IDC bond prices, assuming that principal and interest payments are reinvested into cash
Source: IDC, Trepp, Goldman Sachs Goldman Investment Research
Exhibit 14: Equity REIT total returns paint a similar picture to SA/SB CMBS
Cumulative total return for S&P 1500 equity REITs since January 2021 by property type
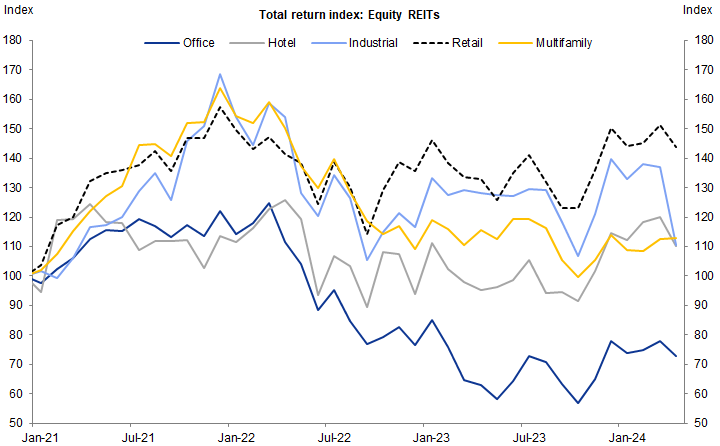
Source: Bloomberg, Goldman Sachs Goldman Investment Research
Where to from here? With a significant leg of CMBS spread tightening behind us, we think the ‘easy money’ has been made. In our view, the opportunity set has shifted to bond selection in older vintages in the secondary market. We continue to favor exposures to single-asset/singe-borrower bonds collateralized by retail and luxury resort properties, while also seeing value up the capital structure in CRE CLO AAA tranches.
Investors should consider this report as only a single factor in making their investment decision. For Reg AC certification and other important disclosures, see the Disclosure Appendix, or go to www.gs.com/research/hedge.html.