Global Markets Daily: Recession Risk when Potential Growth Rate is Low (Shan/Pandl)
- Potential GDP growth has declined from 3% during 1982-2002 to 1.5% in 2016 ...
- … raising the question of whether economic contractions are more likely to take place when potential growth is low.
- Historical experience of OECD countries suggests that this may indeed be the case.
- However, we think negative GDP growth may not be a useful definition of recessions when potential growth is low ...
- … as unemployment rates do not seem to rise sharply more often at low levels of potential growth.
1. Market Update
Yesterday in the US, both headline and core CPI increased less than consensus expectations in March. Relative to a year ago, headline CPI rose 0.9% (vs. 1.0% consensus) and core CPI rose 2.2% (vs. 2.3% consensus). Based on CPI and PPI data, our US Economics team forecasts year-over-year core PCE inflation (which is the Federal Reserve’s preferred inflation measure) of 1.5% in March (“USA: Core CPI Softens; Jobless Claims at Multi-Decade Low,” April 14, 2016).
Outside of the US, the BoE MPC voted unanimously for unchanged policy at its April meeting. The main news from policy communications is that the MPC acknowledges greater caution in interpreting data over the next few months owing to Brexit-related uncertainty. The Committee also noted that a vote to leave the EU may require a more fundamental reassessment of the outlook (“UK-BoE MPC unanimous in no policy change, while Minutes convey additional caution before the EU referendum,” April 14, 2016).
2. Are economic contractions more frequent when potential growth is low?
Recession risks in the US are still low at this point of the business cycle, both by examining the unconditional probability of recessions and by estimating regression models controlling for current economic and financial market conditions (see “Going the Distance,” US Daily, November 9, 2015 and “Doing the Numbers on DM Recession Risk,” Global Economics Analyst, February 5, 2016). At the same time, the Congressional Budget Office (CBO) estimates that the potential GDP growth rate (i.e., the maximum non-inflationary growth rate) has declined from over 3% during 1982-2002 to 1.5% now. Our forward-looking estimate of potential growth remains similarly low at 1.75% (see “Observing the Output Gap,” US Daily, September 14, 2015). This raises the question of whether the odds of negative GDP growth and an economic contraction are mechanically higher in a regime of low potential growth.
The answer depends on whether growth volatility declines along with potential growth. Given the same growth volatility, negative growth rates will be more likely when potential GDP growth is at 1.5% than when it is at 3%. On the other hand, if lower potential GDP growth coincides with lower growth volatility, then it is unclear whether we should expect more episodes of negative GDP growth when the potential growth rate is low.
3. Historical experience of OECD countries suggests negative GDP growth is more likely
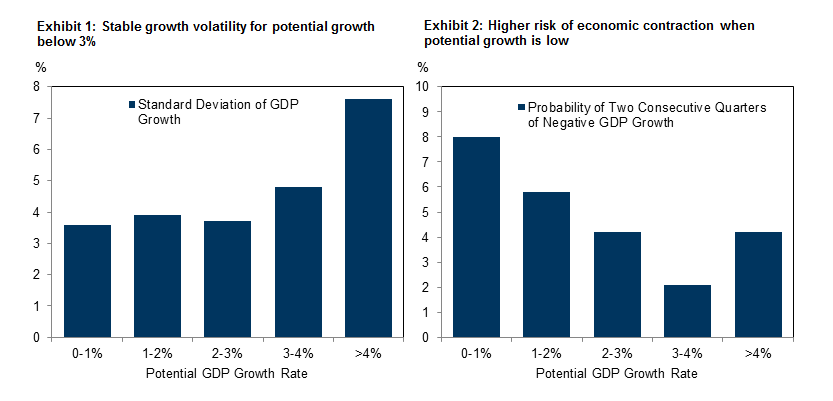
We examine evidence on the relationship between growth volatility and potential GDP using data on 25 OECD countries over the period of 1985-2015. First, we calculate the standard deviation of real GDP growth at different levels of potential growth. Exhibit 1 shows that growth volatility is indeed higher when potential GDP growth is above 4%. But the relationship is non-linear: when potential growth is in the 0-3% range, growth volatility is roughly constant regardless of whether potential growth is 1% or 3%.
Consistent with the observation that growth volatility is stable for potential growth in the 0-3% range, Exhibit 2 shows that the odds of economic contraction are higher when potential growth drops from 3% to 1%. In our analysis sample, in any given quarter, the probability for a country to experience two consecutive quarters of negative GDP growth (a rule of thumb used by many market participants as the definition of recessions) is 4.2% when potential growth is 2-3%, compared with 5.8% when potential growth falls to 1-2%. Interestingly, economic contractions are more frequent when potential growth climbs from 3-4% to above 4%, likely driven by the higher growth volatility associated with the above 4% potential growth.
Source: OECD and Goldman Sachs Global Investment Research.
4. Negative GDP growth may not be a useful definition of recessions
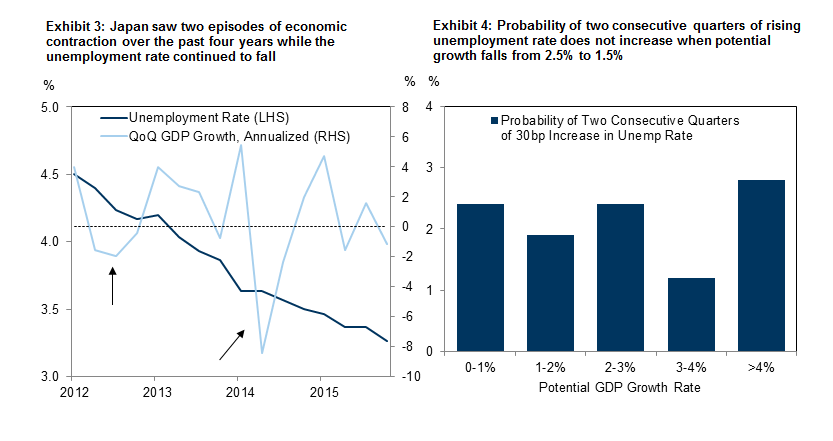
The results shown above suggest that recessions, when defined as negative GDP growth, are more likely when potential growth is low. However, they also call into question whether it is appropriate to use two consecutive quarters of negative GDP growth to identify recession episodes as many market participants typically do. In Japan, for example, potential growth has been below 0.5% since 2009 and the economy has experienced two recessions over the past four years. However, it makes little sense to call these negative growth episodes “recessions” given that the unemployment rate in Japan fell consistently from 4.5% in 2012Q1 to 3.3% in 2015Q4 (Exhibit 3). Indeed, if we define recessions as two consecutive quarters of the unemployment rate rising at least 30bp, we do not find evidence of increasing recession risks when potential growth falls from 2.5% to 1.5% in our OECD sample (Exhibit 4)[1]. While some alternative recession definitions address the problem to certain degree—for example, the International Monetary Fund (IMF) defines a recession as a decline in annual per capita real GDP—they still overstate the frequency of recessions at low potential growth.
Source: OECD and Goldman Sachs Global Investment Research.
Market movements also suggest that negative GDP growth may not be a useful definition of recessions when potential growth is low. In the case of Japan, in 2012 and 2014 when the economy contracted, both the stock market and the credit market rallied. For example, the Nikkei 225 index increased 23% in 2012 and 7% in 2014, while spreads on Japanese corporate bonds moved sideways in 2012 and tightened in 2014. Taken together, although it is true that the economy is more likely to experience negative GDP growth when potential GDP growth is closer to zero, unemployment rates do not appear to rise sharply more frequently and asset markets do not seem to sell off more often in these cases.
5. Tactical Trading Views
The following trading ideas from the Global Markets Group reflect shorter-term views, which may differ from the longer-term ‘structural’ positions included in our ‘Top Trades’ list further below.
On Rates:
1. Receive 1-year and pay 3-year Swedish swap rates, opened at 32bp on 20 November 2015 with a target spread of 70bp and stop loss below 10bp, currently trading at 28bp.
6. Recommended Top Trades for 2016
Longer-term structural views are expressed in our Top Trade recommendations. These are typically managed with a wide stop, and assessed on the basis of whether the fundamentals continue to support the medium-term investment theme.
1. Close long USD against an equally weighted basket of EUR and JPY on 9 February 2016, opened on 19 November 2015 at 100, with a potential loss of around 5%.
2. Close long 10-year US break-even inflation (USGGBE10 Index) on January 18, opened on 10 November 2015 at 1.60%, with a target 2.0% and a stop on a close below 1.40%, with a potential loss of 21bp.
3. Close long an equally-weighted basket of MXN and RUB versus short an equally-weighted basket of ZAR and CLP on 21 January 2016, opened on 19 November 2015 an entry level of 100, with a potential loss of 6.6% including carry.
4. Close long a basket of 48 non-commodity exporters (GSEMEXTD Index) and short a basket of 50 EM banks stocks (GSEMBNKS Index) on 4 March 2016, opened on 19 November 2015 at 1.12 with a gain of 3.9%.
5. Close long 5-year 5-year forward Italian sovereign yields vs short 5-year 5-year forward German yields on 9 February 2016, opened on 19 November 2015 with an entry level of 160bp and a stop loss of 190bp. At close of trade, the spread was at 219bp. The potential loss is 59bp.
6. Close long large cap US banks through the BKX Index relative to the S&P500 on 11 Jan 2016, opened on 19 November 2015 at 100, with a potential loss of 5.4%.
- 1 ^ The results remain qualitatively similar if we use the country-specific standard deviation of quarterly changes in the unemployment rate as the threshold instead of 30bp.
Investors should consider this report as only a single factor in making their investment decision. For Reg AC certification and other important disclosures, see the Disclosure Appendix, or go to www.gs.com/research/hedge.html.