Productivity levels are relatively low across CEEMEA economies. As a percentage of US levels, labour productivity in Israel is 59%, Poland 43%, Turkey 42%, Czech Republic 39%, Hungary 30%, Russia 26%, South Africa 23%, Romania 20%, Ukraine 15% and Nigeria only 11%.
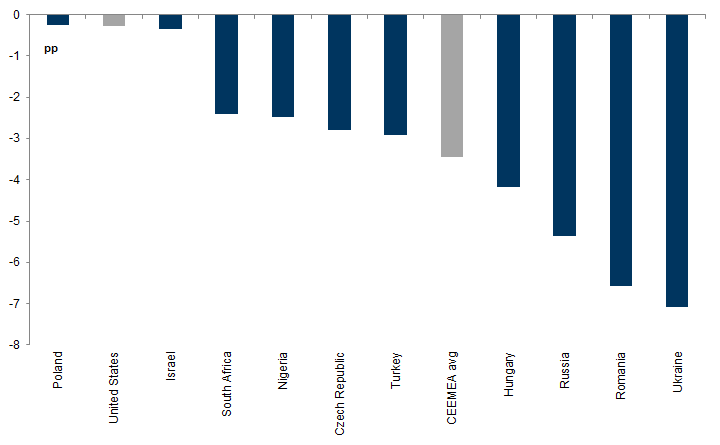
And, while productivity levels in CEEMEA economies are relatively low, productivity growth rates have also slowed since the financial crisis. From 2008, productivity growth has averaged close to zero in Israel, Turkey, the Czech Republic, Hungary, Russia, South Africa and Ukraine. Only Poland, Romania and Nigeria have recorded any meaningful increase in productivity levels.
The disappointing post-crisis performance of productivity in CEEMEA has important implications for economic welfare and asset prices in these economies. Had productivity growth been sustained at its pre-crisis pace, real income levels in CEEMEA countries would be around one-third higher, on average, than they currently are and equilibrium real effective exchange rates (REER) would be significantly higher.
That productivity growth has slowed so significantly in CEEMEA (and across emerging market economies more generally) also reveals something about the causes of the global productivity slowdown.
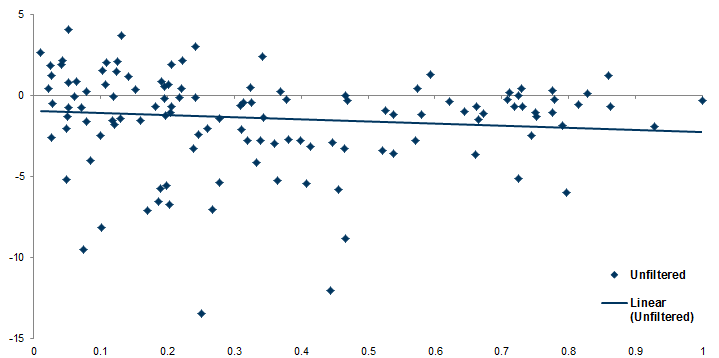
According to one influential school of thought, global productivity growth has slowed because of a reduction in the pace of technological innovation. However, if the slowdown in productivity growth had been due to slower tech innovation, one would expect this effect to be felt most acutely in economies that are close to the productivity/technological 'frontier'. Farther away from the frontier, where there are substantial productivity gains to be won by simply implementing and replicating pre-existing technologies, one would expect productivity growth to have continued relatively unimpeded.
Using data for 122 countries, we show that this has not been the case. This argues against the ‘techno-pessimist’ view of the productivity slowdown and implies that the problem lies more in the diffusion of technological progress.
Productivity growth in CEEMEA stalls
Exhibit 1: The level of productivity is less than half that of US productivity in CEEMEA economies
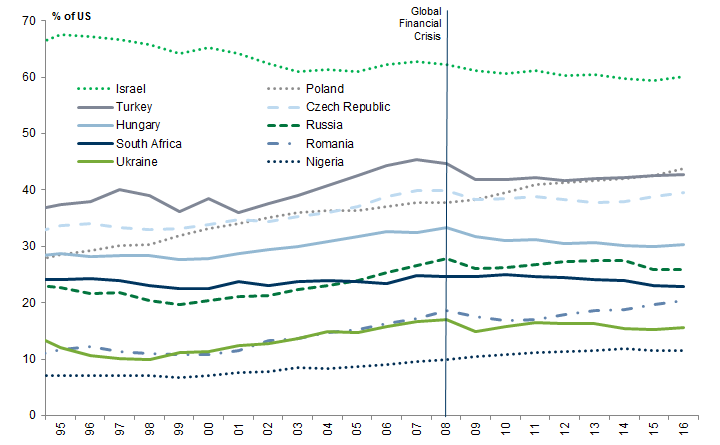
Exhibit 2: Productivity growth has stalled in most CEEMEA economies since the Global Financial Crisis (with the exception of Poland, Nigeria and Romania)
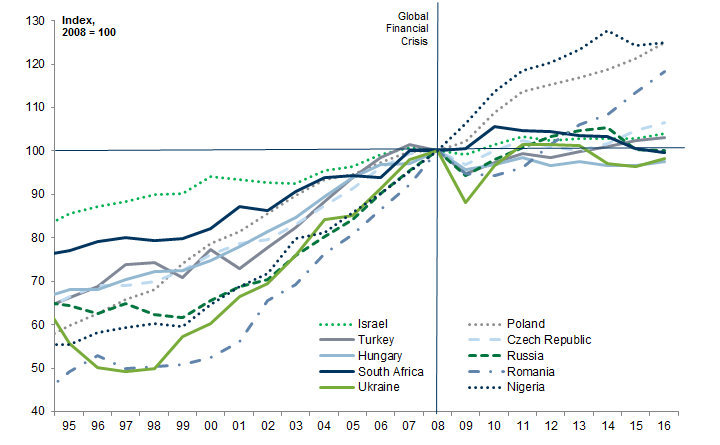
Exhibit 3: Productivity growth has slowed significantly in CEEMEA economies since the Global Financial Crisis (with the exception of Poland and Israel)
Global lessons from the EM productivity slowdown
Supply-side optimists, who argue that the slowdown in productivity growth has been due to a combination of insufficient demand and problems related to the provision of finance in the aftermath of the Global Financial Crisis. According to this view, if appropriate measures are taken to boost demand and alleviate the headwinds that have persisted in the aftermath of the crisis, productivity growth is likely to accelerate over time.
Supply-side pessimists, who argue that the slowdown in productivity growth is due to a reduction in the pace of technological innovation, one which is likely to be relatively permanent in nature and which policymakers can do little to alleviate.[3]
Exhibit 4: No significant relationship between the change in productivity growth and the distance from the productivity 'frontier'
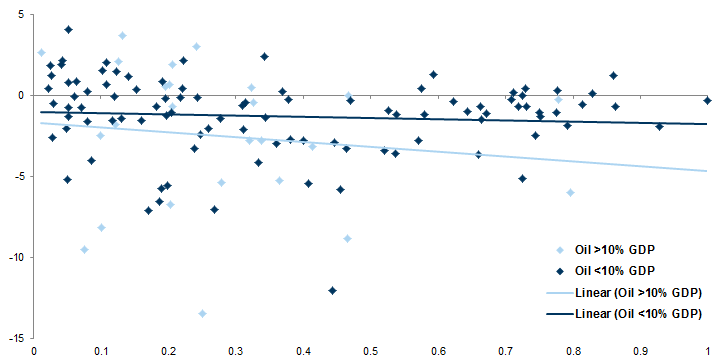
First, to control for potential distortions from the 2006-2014 boom in commodity prices, we separate the sample into countries whose oil revenues have represented more than 10% of GDP during the post-crisis period and those that did not (Exhibit 5). No clear picture emerges, however, as neither subgroup exhibits a statistically significant relationship between change in productivity growth and the relative productivity level.
Exhibit 5: Conditioning on oil production as a fraction of GDP does not lead to a signficant relationship
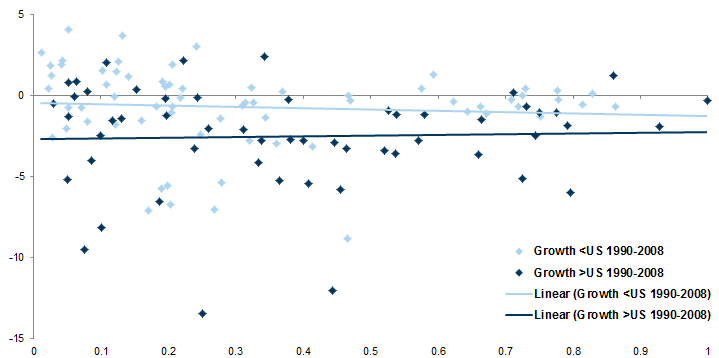
Second, in order to consider countries displaying evidence of convergence or divergence separately, we split the sample into countries that exhibited higher and lower rates of productivity growth than the US in the period preceding the crisis (Exhibit 6). While it is the case that productivity growth tended to slow more in economies that exhibited relatively rapid growth prior to the crisis, there is no evidence in either sample of a statistically significant relationship between the extent of the slowdown and the level of productivity.
Exhibit 6: Splitting the sample into convergent and divergent economies does not result in a significant relationship
A breakdown in productivity diffusion
Conviction Macro Views
Turkey: Closing our constructive view on rates
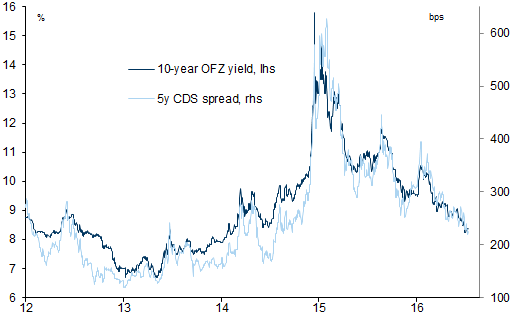
Russia: Still constructive on Ruble, carry adjusted, and positive on equities as growth surprises to the upside
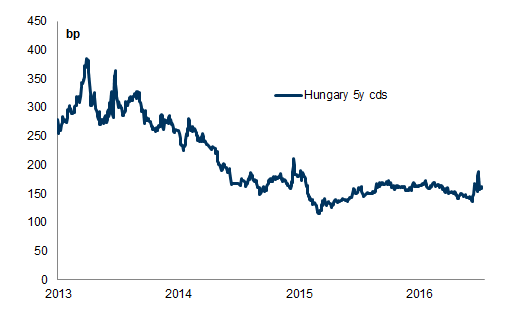
Hungary: Bullish on sovereign credit
Russia: 5-year CDS spread, 10-year OFZ yield
Hungary: 5-year CDS spread
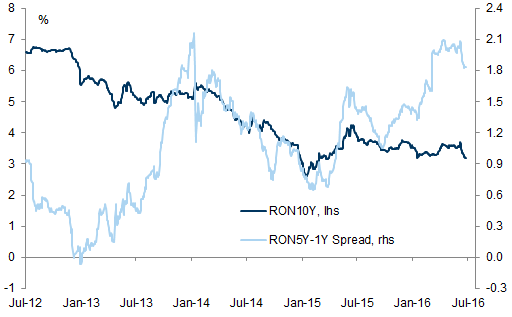
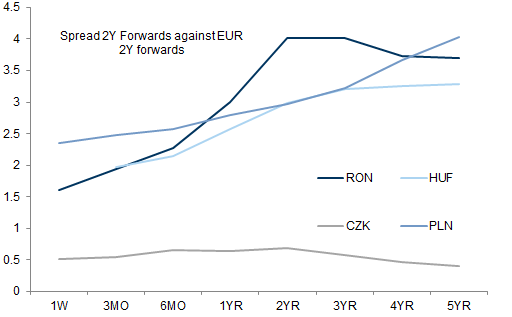
Romania: Steeper curves and cautious on duration
Poland: Assets to remain sensitive to political uncertainties, while macro outlook remains solid
Romania: 10-year bond yield, 5y-1y slope
Poland: FX and rates remain sensitive to risk sentiment and policy measures, despite solid macro backdrop and ECB easing
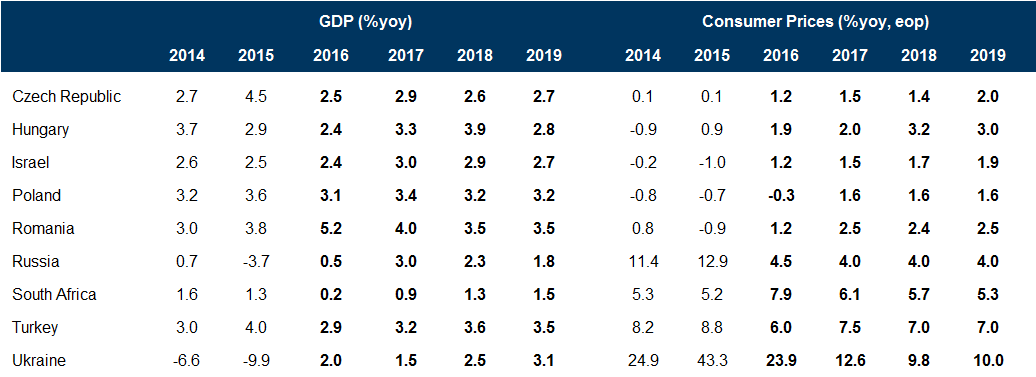
Macroeconomic forecasts
CEEMEA Main Macro Forecasts
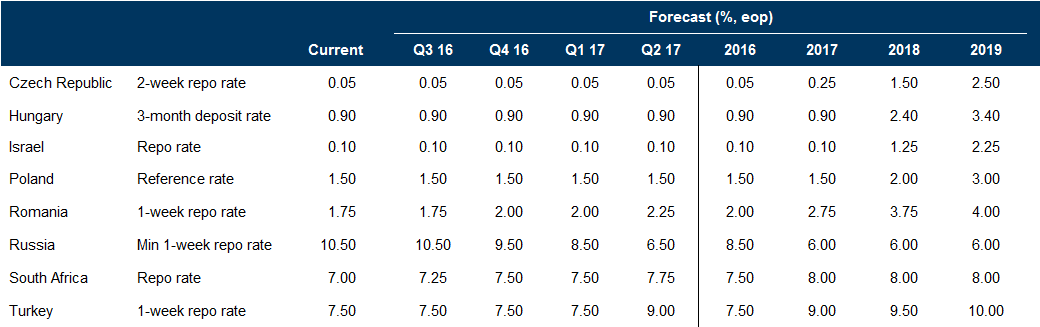
CEEMEA Policy Rate Forecasts
Interest rate and exchange rate forecasts
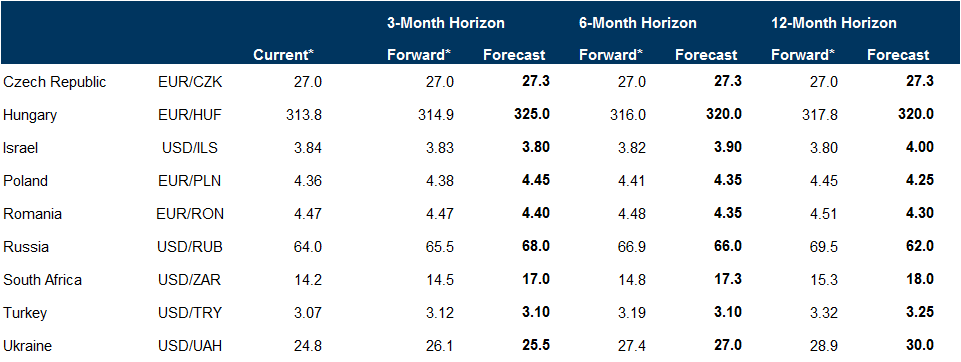
CEEMEA Exchange Rate Forecasts
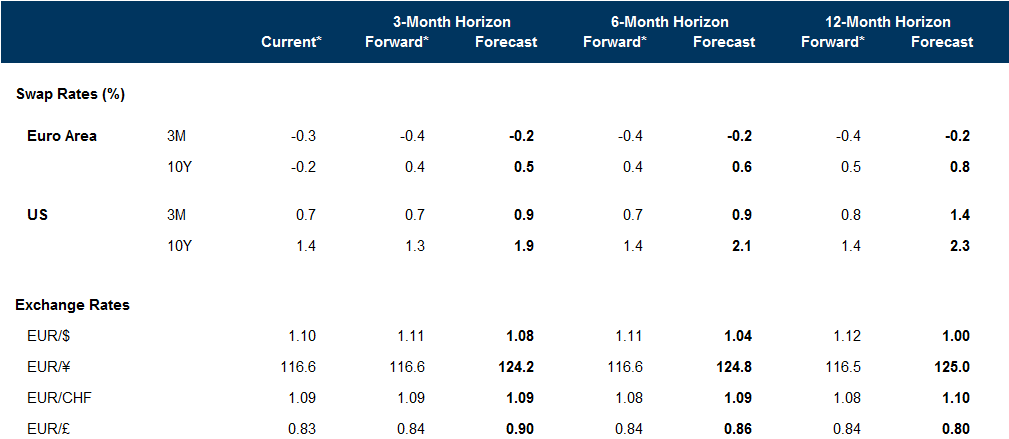
Global Interest and Exchange Rate Forecast
- 1 ^ The source data used in this comparison and in all the subsequent analysis in this paper is taken from The Conference Board's Total Economy Database.
- 2 ^ Paul Krugman, The Age of Diminishing Expectations (1994)
- 3 ^ The leading proponent of the techno-pessimist view is the economic historian Robert Gordon. His argument is essentially that, for all the technological wizardry of recent innovations (such as smart phones and social media), their contribution to productivity growth is more limited than the generation of innovations that preceded them.
- 4 ^ A recent OECD report – "The Future of Productivity" – provides a good summary of the academic literature underlying this view.
Investors should consider this report as only a single factor in making their investment decision. For Reg AC certification and other important disclosures, see the Disclosure Appendix, or go to www.gs.com/research/hedge.html.