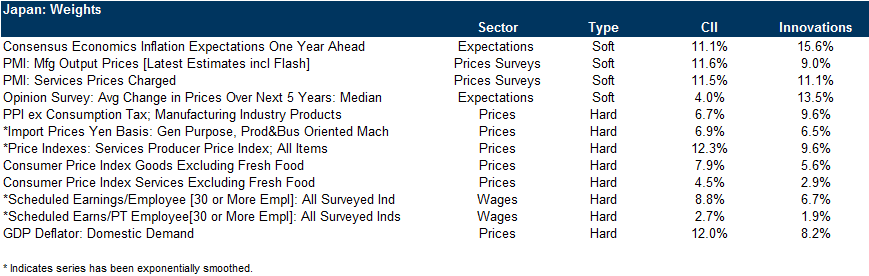
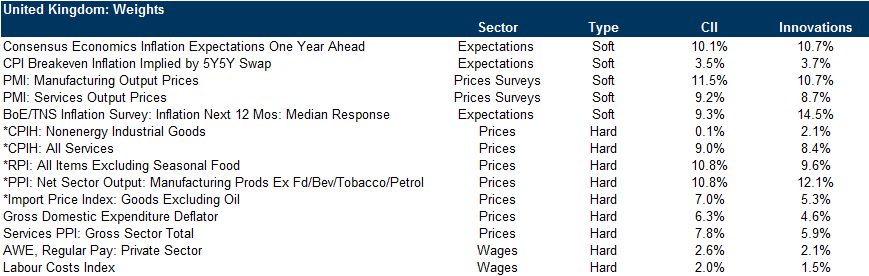
Today we introduce a new tracker of underlying inflationary pressure, the Current Inflation Indicator (CII), for four economies: the US, Euro area, Japan, and the UK. It follows our Current Activity Indicators—which help us escape the confines of GDP as a narrow measure of economic activity—and uses a range of inputs to provide a broad measure of the pace of price pressures that are not subject to erratic components or methodological considerations, in contrast to the consumer price indices. The CIIs are updated daily and are available on Bloomberg.
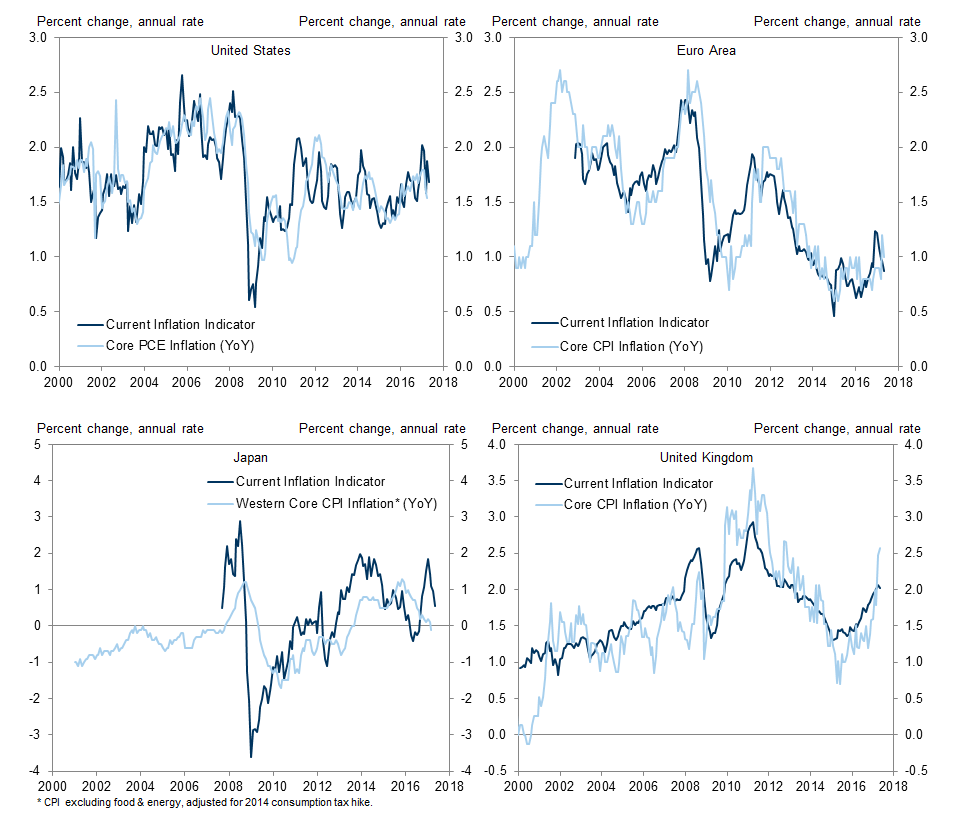
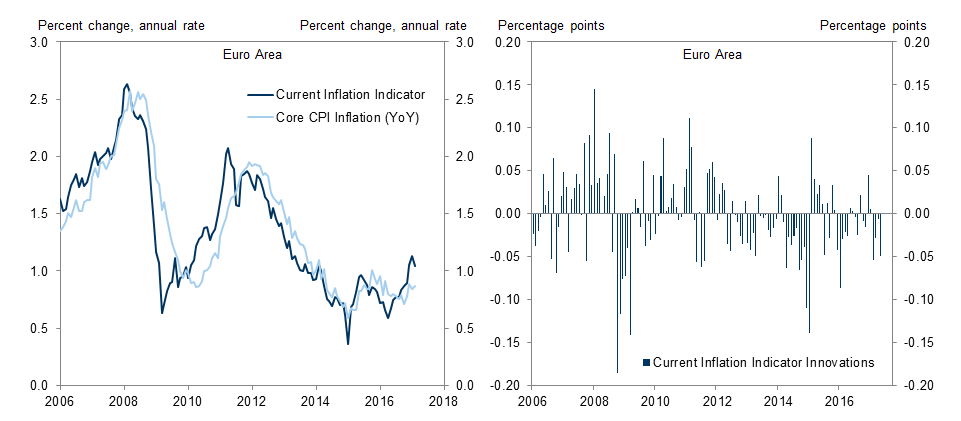
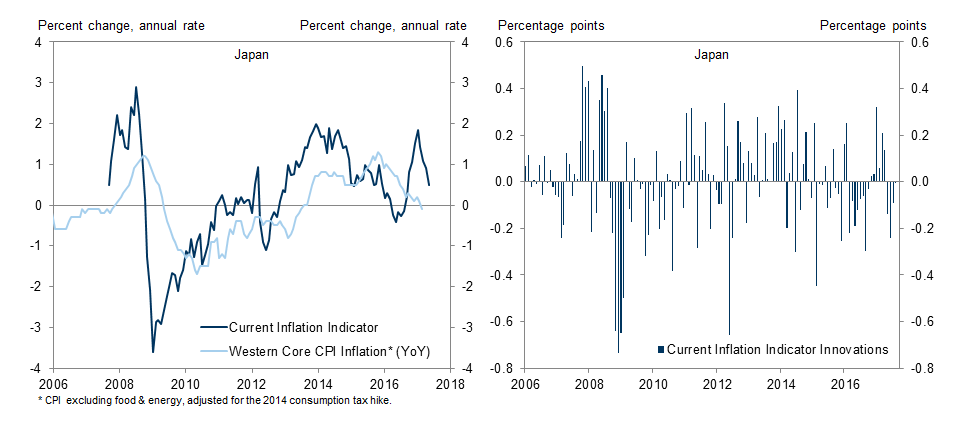
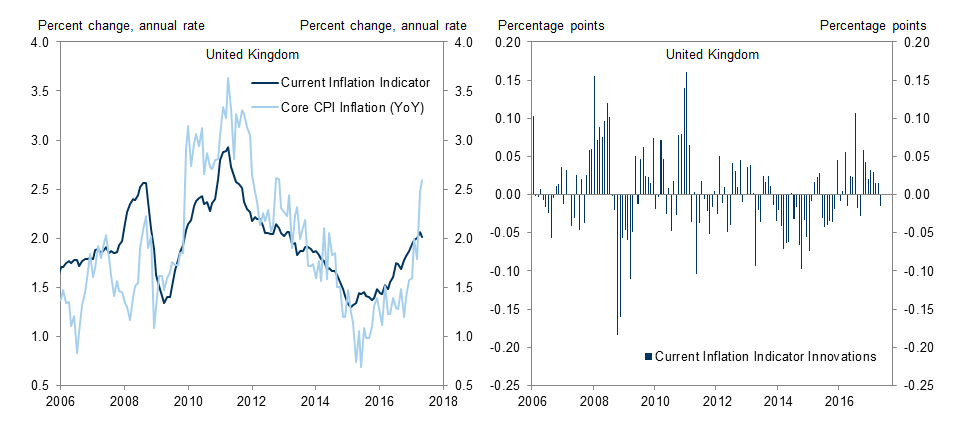
The CIIs have picked up recently in all four economies, and this signal emerges from a range of different indicators. That said, the gap between underlying inflation and central banks’ targets differs markedly across economies and points to inflation close to target in the US and the UK.
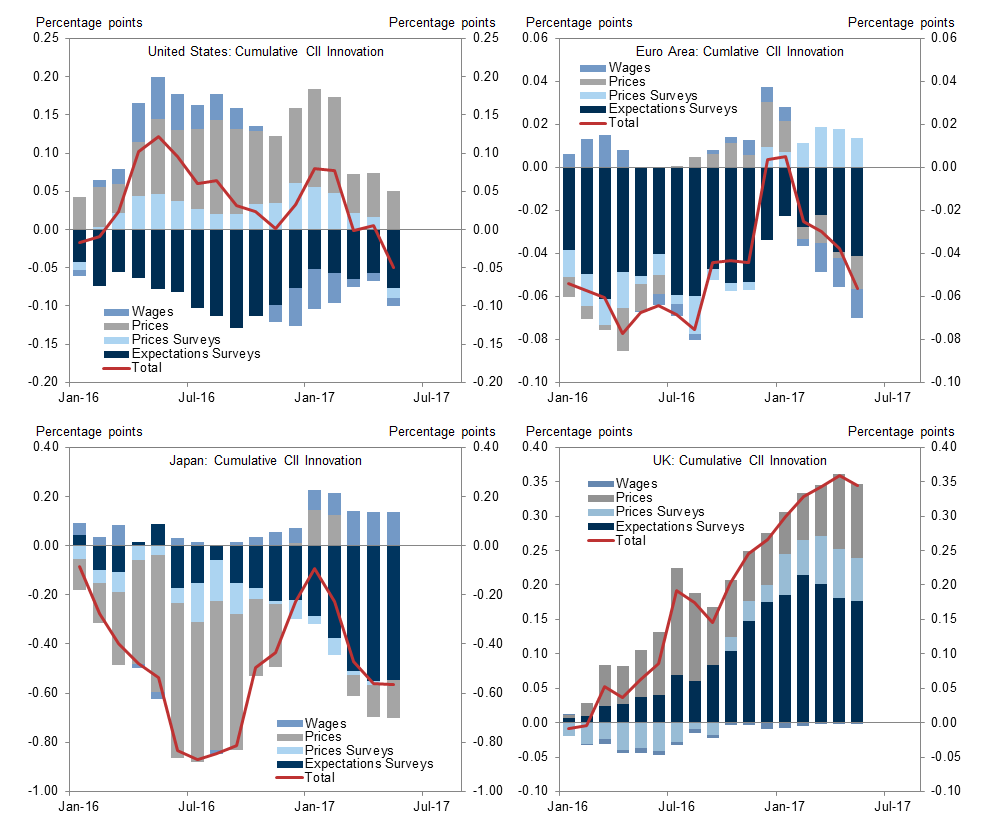
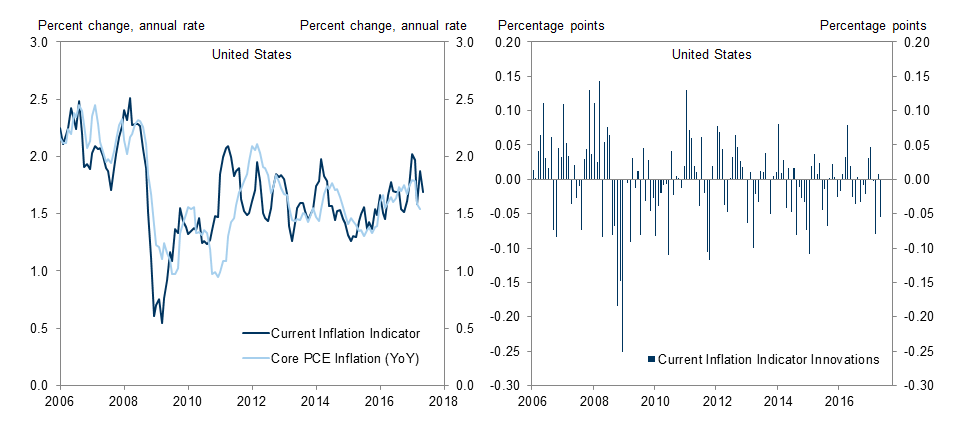
The CII framework, in keeping with the CAIs, also generates a set of “CII innovations”, which measures the economic news content of data releases relative to expectations. Looking at the recent picture, realized inflation expectations have differed the most from our forecasts, turning out weaker in the US, Euro area, and Japan but stronger in the UK.
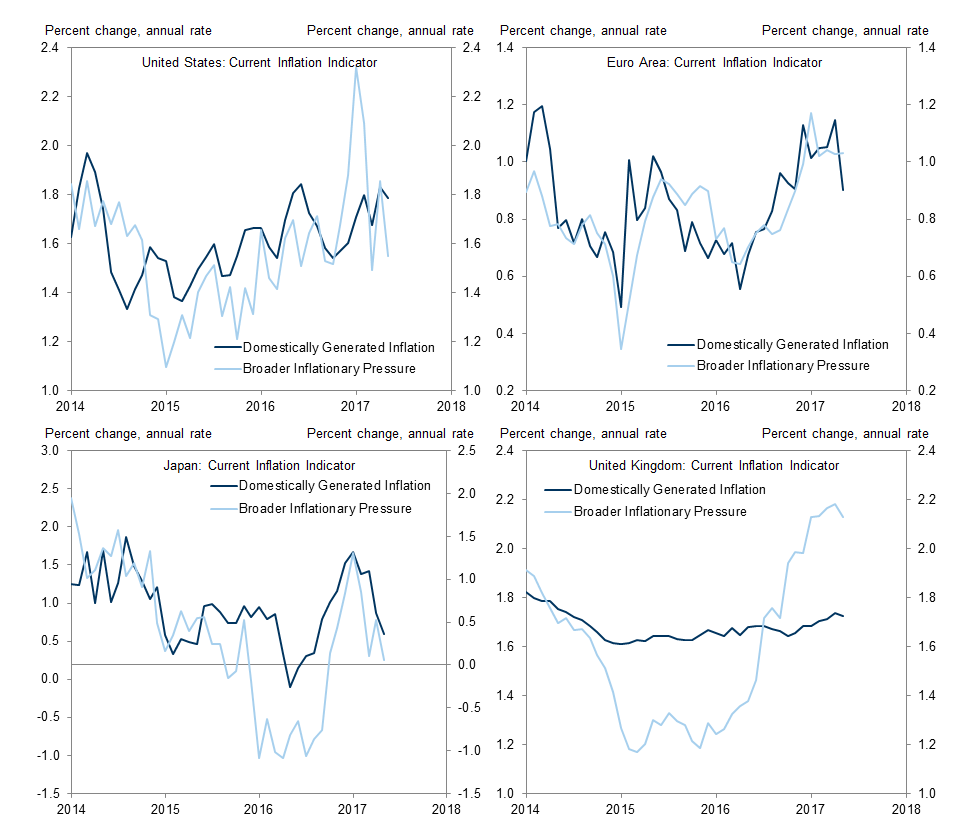
The signal from “domestically generated” sources of inflationary pressure (DGI)—which could be a more reliable indicator of medium-term pressures, less sensitive to transitory factors–supports our policy outlooks for all four economies. The steady pickup in US price pressures—especially when focusing on DGI—supports the current FOMC view that recent hard inflation weakness is transitory. Meanwhile, Euro area core inflation still falls short of target and does not look likely to catch up. Similar weakness in Japan underlines the need for continued policy accommodation. Stable—if below target—UK DGI has underpinned easy policy of late, but the large gap with broader inflation brings into sharp relief the MPC’s judgment about whether to tolerate a possibly persistent overshoot of its inflation target.
Exhibit 1: Our New Current Inflation Indicators
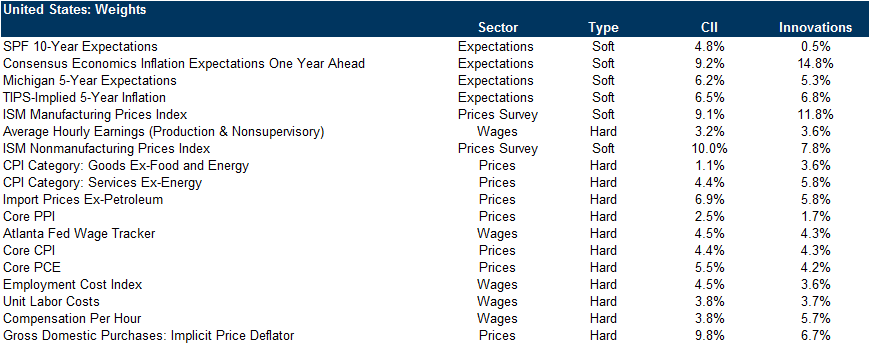
Constructing the Current Inflation Indicator

Exhibit 2: A Modest Pickup in G4 Inflationary Pressure, But Still Below Pre-Crisis Average
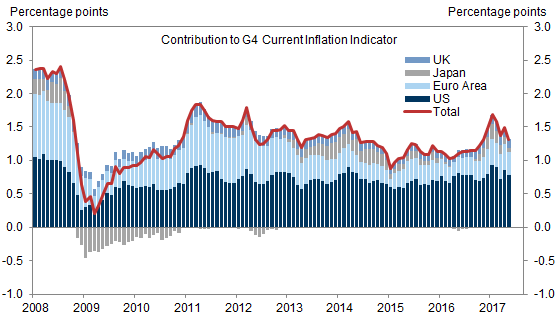
Exhibit 3: The Recent CII Moves Are Broadly Based
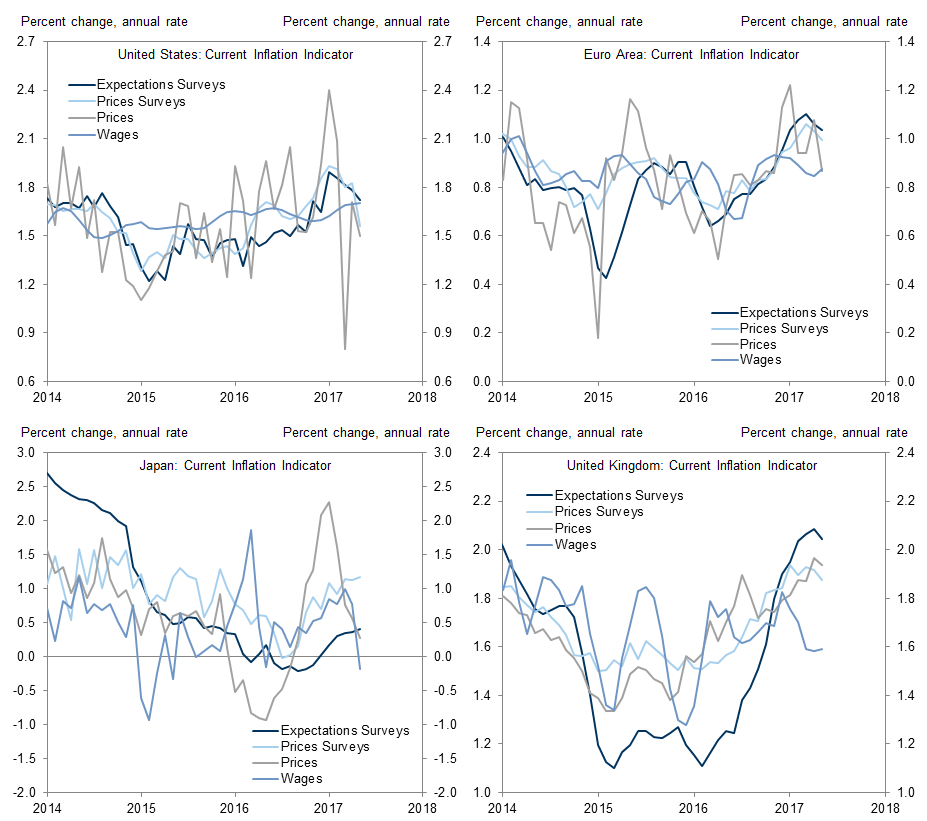
Exhibit 4: Inflation Expectations Have Surprised the Most
Feeding through into policy
Exhibit 5: Euro area and Japan Are Furthest—and Most Consistently—Away From Target
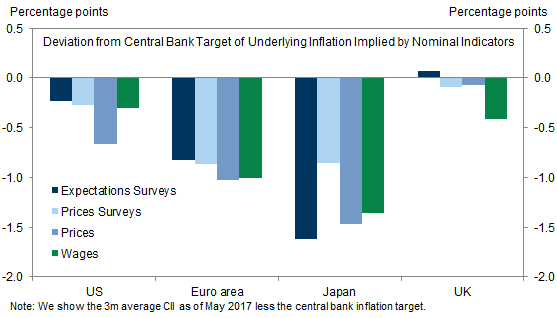
Exhibit 6: Domestically Generated Inflation Has Been More Stable Than General Measures
Nicholas Fawcett
Karen Reichgott
Appendix
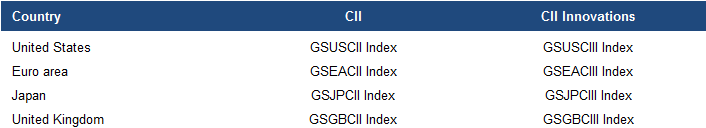
Current Inflation Indicator Bloomberg codes

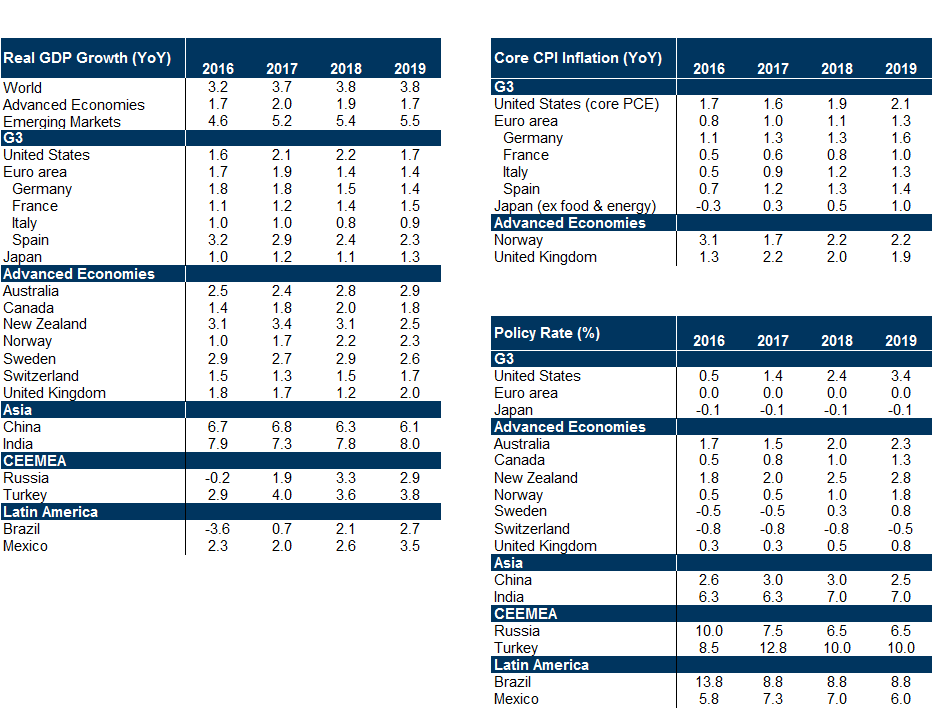
Global Economic Forecasts
- 1 ^ See, for example, “Trackin’ All Over the World: Our New Global CAI”, Global Economics Analyst, February 25, 2017.
- 2 ^ Our US economics team has recently discussed methodological changes in the CPI, observing that such changes provide no new information about structural factors such as equilibrium unemployment; see Daan Struyven and Jan Hatzius, “The Return of the Missing Growth”, US Economics Analyst, April 21, 2017 and Jan Hatzius, “Weaker Core Inflation, and What It Means for the Fed”, US Daily, May 15, 2017.
- 3 ^ For example, some inflation expectations series relate to price changes over 12 months. Separately, where indicators are only available at a quarterly frequency, we interpolate into monthly observations.
- 4 ^ The Appendix provides details of the tickers.
- 5 ^ See, for example, the Bank of England Inflation Report, May 2017; Kristin Forbes, "When, why and what's next for low inflation?: No magic slippers needed", speech, June 17, 2015; and European Central Bank Economic Bulletin, issue 4, 2017.
- 6 ^ See in particular, Pierre Vernet, “The ECB and the ‘German inflation cap’”, European Economics Analyst, April 28, 2017.
Investors should consider this report as only a single factor in making their investment decision. For Reg AC certification and other important disclosures, see the Disclosure Appendix, or go to www.gs.com/research/hedge.html.