Goldman Sachs Research
Global Economics Analyst
Still More Cyclical than Secular
26 February 2018 | 11:35AM EST | Research | Economics| By Jan Hatzius and others
More
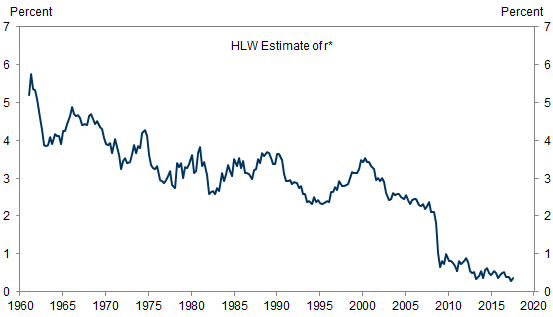
  • Although markets have recently upgraded their Fed view in light of stronger growth and inflation, longer-term expectations for the funds rate remain very low by historical standards. This downbeat assessment is consistent with the well-known model of Fed economists Kathryn Holston, Thomas Laubach and John Williams (HLW), which currently produces an estimate of just 0.3% for the real neutral funds rate, r*.

  • However, the HLW model is based on some strong assumptions. First, it backs out potential GDP from an “accelerationist” Phillips curve, which has worked poorly in the past decade, and it relies exclusively on GDP data to identify the economic cycle without an explicit role for labor market information. As a result, it produces an implausible estimate of the output gap, with the economy back to potential as early as 2011Q2.

  • Second, the HLW model does not explicitly allow for any transitory forces that might affect r*, such as disruptions in the housing and banking sector that were long-lasting but not permanent.

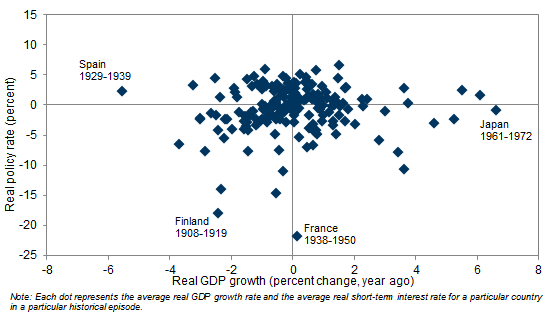
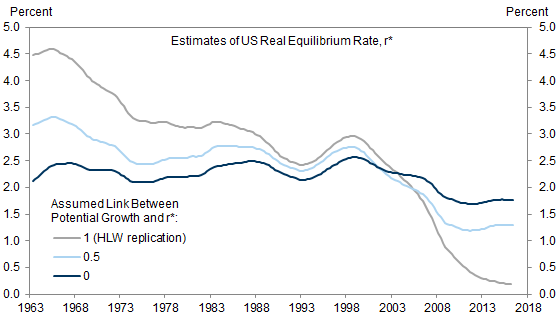
  • Third, the HLW model assumes that r* moves 1-for-1 with potential growth. However, long-term cross-country data show that this link is much weaker empirically than suggested by simple theoretical models.

  • Modifying these assumptions leads to very different results, even within an otherwise standard HLW model. If we use a Phillips curve with anchored inflation expectations, include labor market information to help identify the output gap, and allow for transitory headwinds, the r* estimate becomes ¾% now and is projected to rise to 1¼% over coming years. If we alternatively lower the impact of potential growth on r*, the estimate becomes 1¼%-1¾%.

  • This more upbeat view of r* is consistent with the recent performance of the economy. Despite 125bp of funds rate hikes and the beginning of Fed balance sheet adjustment, growth has accelerated sharply, the unemployment rate has fallen to very low levels, and inflation has started to firm. This is consistent with our view that the post-crisis weakness was more cyclical than secular.

Still More Cyclical than Secular

Secular stagnation—a concept introduced by Alvin Hansen in 1938 and revived by Larry Summers in 2013—implies a chronic shortage of aggregate demand, barring exceptionally low real interest rates, or equivalently a chronically depressed neutral real interest rate, r*. We have long been skeptical of secular stagnation as a description of the post-crisis environment.[1] In our view, exceptionally low real rates and exceptionally accommodative monetary policy were needed during the recovery from the financial crisis, but this was mostly because of long-lasting cyclical headwinds rather than truly secular forces.
Markets have recently upgraded their Fed view in light of stronger growth and inflation. However, expectations of r* remain very low by historical standards. Although the exact numbers vary, Exhibit 1 shows that measures of distant funds rate expectations—both in nominal and real terms—fell sharply in the early years of the crisis and have made up little or none of that drop since.[2] Both the FOMC and private-sector forecasters have likewise cut their long-term funds rate expectations substantially, without any reversal to date.

Exhibit 1: Market Measures of r* Show a Sustained Fall Since 2007

1. Market Measures of r* Show a Sustained Fall Since 2007. Data available on request.
Source: Bloomberg, Haver Analytics, Goldman Sachs Global Investment Research
This downbeat assessment of r* is consistent with the well-known estimates of Fed economists Kathryn Holston, Thomas Laubach and John Williams (HLW) shown in Exhibit 2.[3] Using statistical techniques, the HLW model extracts an estimate of r* from the behavior of real GDP growth and core PCE inflation in a quarterly sample back to the 1960s. Their latest estimates suggest that r* has fallen from about 2.5% before the crisis to 0.3% at the end of 2017.

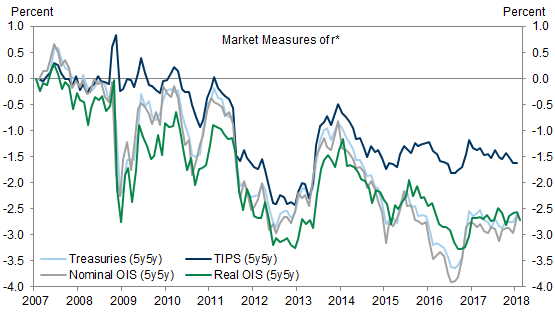
Exhibit 2: Holston-Laubach-Williams Model Produces a Pessimistic View of r*

2. Holston-Laubach-Williams Model Produces a Pessimistic View of r*. Data available on request.
Source: Holston, Laubach and Williams (2016), Goldman Sachs Global Investment Research

Questions about the HLW Model

The HLW model makes three strong assumptions that are open to question. First, it backs out potential GDP from an “accelerationist” Phillips curve, which assumes that the change in inflation depends on the level of the output gap. This formulation was popular before the financial crisis but has since fallen out of favor. This is because it would have predicted a much sharper fall in inflation than actually occurred, when combined with the dramatic output decline in the crisis. On a related note, HLW also do not explicitly take into account the performance of the labor market. The unemployment rate, however, played a crucial role during the crisis, rising sharply as the economy contracted and falling rapidly as the recovery gained steam. By not taking into account the behavior of the labor market, the HLW model understates the long-lasting cyclical nature of the crisis and the subsequent recovery. As a result of these choices, the HLW model produces an implausible estimate of the output gap, with the economy back to potential as early as 2011Q2 (Exhibit 3).

Exhibit 3: Accelerationist Phillips Curve in HLW Generates an Implausible Output Gap

3. Accelerationist Phillips Curve in HLW Generates an Implausible Output Gap. Data available on request.
Source: Holston, Laubach and Williams (2016), Congressional Budget Office, Federal Reserve, Goldman Sachs Global Investment Research,
Second, the HLW model assumes that any deviations of r* from potential growth are permanent (a “random walk”). This specification does not explicitly allow for any transitory forces (or “headwinds”) that might affect r* temporarily.[4] But we believe that such headwinds—including credit constraints, housing weakness, fiscal drag and slow global growth—played an important role in slowing the recovery.
Third, the HLW model assumes that r* moves one-for-one with potential growth. Although a close link is implied by most macroeconomic models, there is little empirical evidence for a strong link in practice. We constructed a history of short-term interest rates in a sample of 17 developed countries stretching back mostly to the 1800s. If we average the data over entire business cycles to isolate any low-frequency relationship between growth and real rates, we find that the link is statistically insignificant and numerically close to zero—as illustrated by the scatter plot of Exhibit 4. This conclusion is robust to more rigorous statistical tests, such as controlling for a variety of country-specific and global factors.[5]

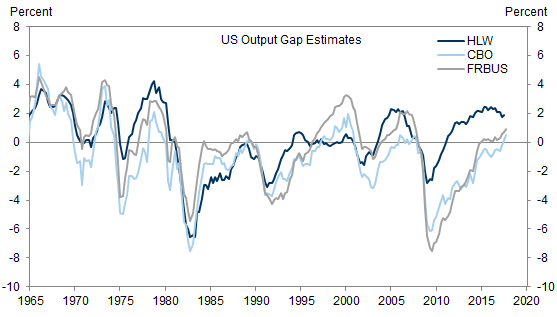
Exhibit 4: No Strong Link Between Growth and r*

4. No Strong Link Between Growth and r*. Data available on request.
Source: Jordà, Schularick and Taylor (2017) , Goldman Sachs Global Investment Research

Other Choices Lead to Higher r* Estimates

We can illustrate the importance of the discussion in the preceding section by re-estimating the HLW model under different and (we think) more realistic assumptions.
Our first set of modifications abandons the accelerationist Phillips curve and includes long-term inflation expectations, adds the unemployment rate to help identify the output gap, and allows for temporary headwinds such as housing or banking disruptions. Exhibit 5 shows that this generates a significantly more cyclical path for r*.[6] After falling to -3% in the crisis, it has rebounded to ¾% now and is projected to rise to around 1¼% over the next few years.

Exhibit 5: r* with Temporary Headwinds

5. r* with Temporary Headwinds. Data available on request.
Source: Holston, Laubach and Williams (2016), Goldman Sachs Global Investment Research
Our second modification assumes a smaller impact of potential growth on r* than in the standard version of HLW, consistent with the long-term evidence. Exhibit 6 shows that this implies a much smaller decline in r*.[7] If we assume an impact of 0.5, the current r* estimate becomes 1¼%. If we assume no impact at all—perhaps an extreme assumption but one that cannot be rejected in the long-term data—the current estimate of r* becomes 1¾%.

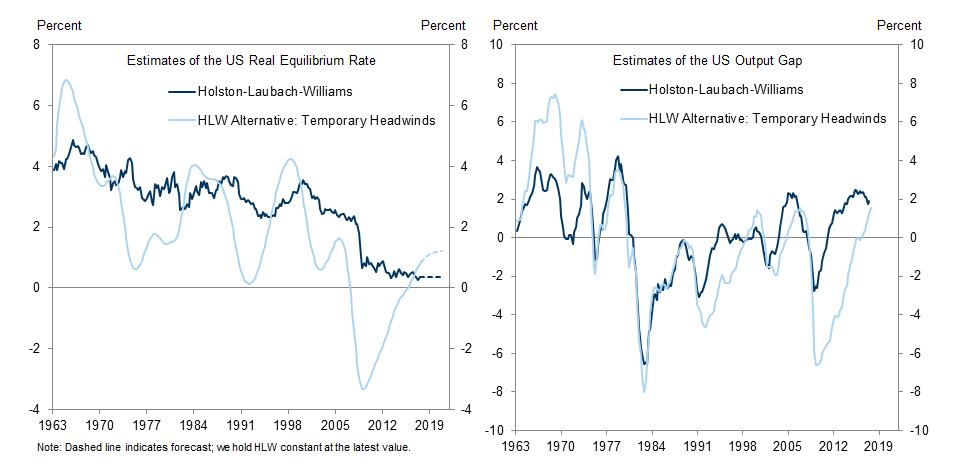
Exhibit 6: A Shallower Path for r*

6. A Shallower Path for r*. Data available on request.
Source: Holston Laubach and Williams (2016), Goldman Sachs Global Investment Research

The r* Discussion and Economic Reality

Beyond these technical modeling questions, the depressed HLW estimates also seem inconsistent with the recent performance of the economy. Following 125bp of hikes since late 2015, the real funds rate has risen to just under 0%. This means that the HLW policy rate gap—the difference between the real funds rate and r*—has narrowed from -2% in 2015 to -½% now. If the r* concept is to be meaningful, this reduction in policy accommodation should arguably have started to exert a drag on the performance of the economy, or at least on the performance of the financial markets. Yet, growth has accelerated, the unemployment rate has fallen to very low levels, and inflation is now also starting to firm. At least so far, the economy is not behaving as one would expect under the depressed HLW estimate of r*. The implication is either that r* is higher than implied by HLW or that the neutral funds rate concept is not very meaningful for the performance of the economy.
The most tangible implication of our analysis is that a depressed neutral funds rate should be less of a constraint on the terminal level of the funds rate than suggested by either market pricing or the Fed’s dots. Our forecast remains that the Fed will hike in quarterly 25bp increments until the funds rate reaches 3¼%-3½% at the end of 2019, well above the Fed’s own estimates in the dot plot and the forwards. And while the risks around our forecast look evenly balanced, our analysis suggests that further hikes in subsequent years that push the funds rate well above prevailing estimates of neutral are a significantly bigger risk than suggested by current market pricing.

Jan Hatzius

Sven Jari Stehn

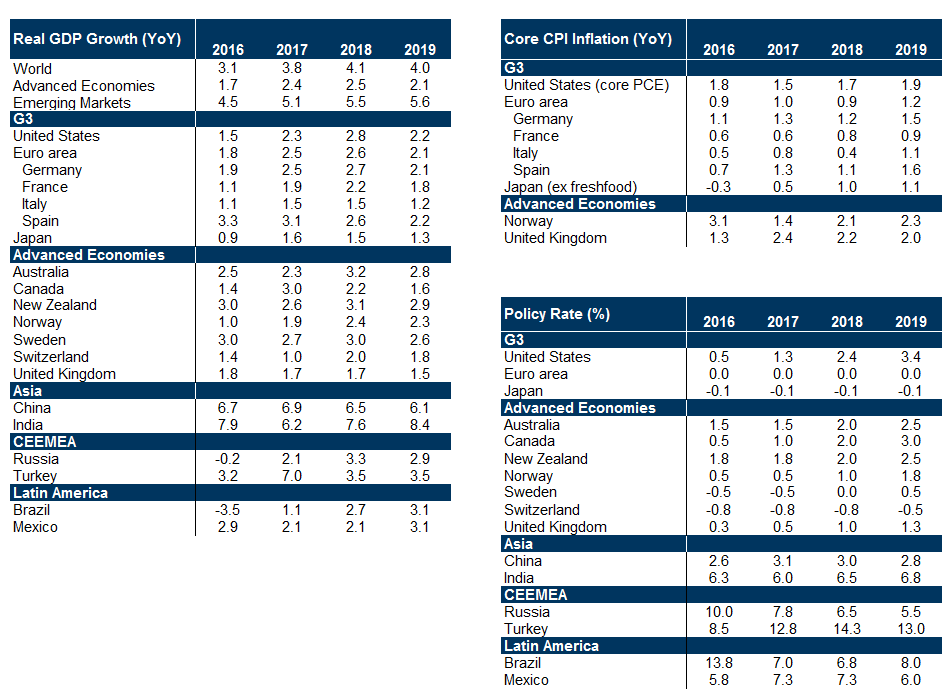
Global Economic Forecasts

Data available on request.
Source: Goldman Sachs Global Investment Research
  1. 1 ^ See Jan Hatzius and David Mericle, “More Cyclical than Secular,” US Economics Analyst, December 6, 2013; Jan Hatzius and Sven Jari Stehn, “The Rebound in the Equilibrium Funds Rate,” US Economics Analyst, May 29, 2015; Nicholas Fawcett, Sven Jari Stehn, and Jan Hatzius, “Depressed r* Narrative: On Shaky Ground,” Global Economics Analyst, November 29, 2016; and Sven Jari Stehn, “A More Optimistic View of the Equilibrium Funds Rate,” Global Economics Analyst, March 24, 2017.
  2. 2 ^ Estimates of the market’s view of r* are somewhat higher when the term premium is stripped from long-term yields instead of taking real distant forward rates. See David Mericle and Alex Demyanets, “The Market’s View of the Neutral and Terminal Rates,” US Daily, February 15, 2018.”
  3. 3 ^ See Kathryn Holston, Thomas Laubach and John Williams, “Measuring the Natural Rate of Interest: International Trends and Determinants,” forthcoming in Journal of International Economics. The model is similar to the original paper by Thomas Laubach and John Williams, "Measuring the Natural Rate of Interest," Review of Economics and Statistics , Vol. 85, No. 4 (November 2003).
  4. 4 ^ This assumption implies that the model treats any changes in r* as permanent until the data prove otherwise.
  5. 5 ^ For details see Nicholas Fawcett, Jan Hatzius and Sven Jari Stehn, “The Depressed r* Narrative: On Shaky Ground,” Global Economics Analyst, November 29, 2016.
  6. 6 ^ This is an update of a model we first estimated in mid-2015. For details, see Sven Jari Stehn and Jan Hatzius, “The Rebound in the Equilibrium Funds Rate,” US Economics Analyst, May 29, 2015. We also include a measure of survey inflation expectations in the Phillips curve.
  7. 7 ^ Exhibit 6 shows our replications of the HLW estimates under different coefficients on potential growth using a two-sided filter to smooth the estimates.

Investors should consider this report as only a single factor in making their investment decision. For Reg AC certification and other important disclosures, see the Disclosure Appendix, or go to www.gs.com/research/hedge.html.