Goldman Sachs Research
US Economics Analyst
Recession Risk Report: A Narrow Runway for a Soft Landing
  • The expansion is now the second longest in US history and will become the longest if it survives another year. So far, the odds look good. But with monetary and eventually fiscal tightening on the agenda in the years ahead and concern about trade wars and spillovers from vulnerable foreign economies growing, markets have begun to grumble about the risks down the road.

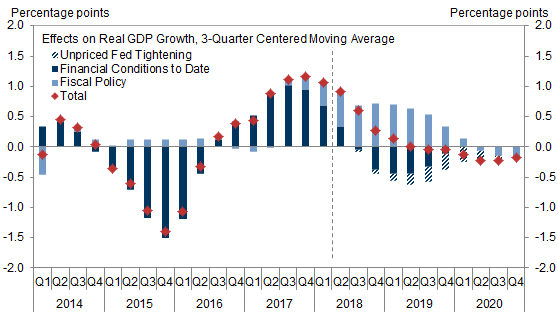
  • We see the popular thesis that a recession is coming in 2020 as a bit hasty. We do expect a passive fiscal tightening, tighter financial conditions, and supply constraints to leave growth ½pp below potential in 2020 at 1.25%. This implies greater risk of at least a technical recession in 2020, but it is not our base case.

  • We see little evidence that the trade war has hurt US growth so far, and we are skeptical that trade policy uncertainty alone will weigh appreciably on aggregate investment spending. Even in the case of a larger trade war than we expect, both our global macro model and the relevant historical experience suggest that the direct economic effects would be limited.

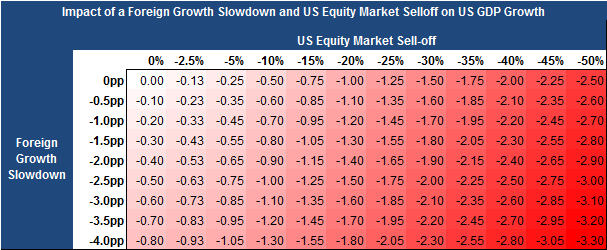
  • We likewise see little recession risk from purely economic spillovers from a potential foreign slowdown. But the greater synchronization of global equity markets raises the risk that the US could “import” a recession via financial channels in a more adverse scenario. Indeed, this is the most plausible channel through which a trade war or foreign slowdown could tip the US into recession.

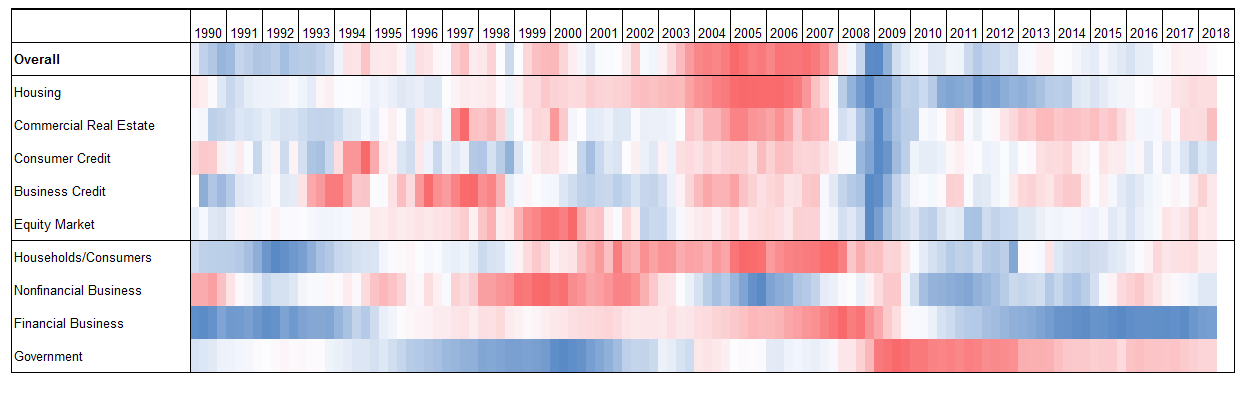
  • Turning to the usual suspects of US recessions, overheating and financial excess, we find little risk so far. Inflation, unit labor costs, and inflation expectations show no sign of overheating yet, but a historically tight labor market will pose risk. Our financial excess monitor also remains reassuring, with asset valuations mostly at moderate levels and few signs of private sector financial imbalances.

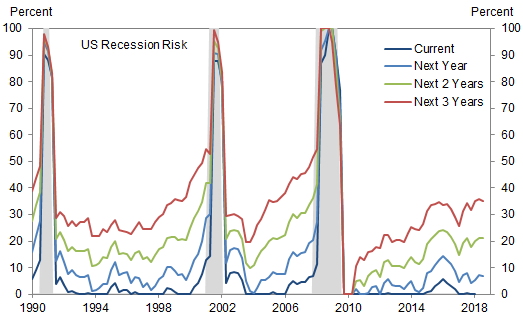
  • How long can the expansion last? The good news is that the lack of financial imbalances likely mitigates the overheating risk. But the bad news is that labor market overshoots have been very good predictors of US recession risk, and the current overshoot has a ways to go. The further it extends, the more difficult it will be to return the economy to a sustainable place. This implies an increasingly narrow runway for a soft landing.

Recession Risk Report: A Narrow Runway for a Soft Landing

The current expansion is now the second longest in US history and will become the longest if it survives another year. So far, the odds look good. Our cross-country recession model, which uses economic and financial data from 20 advanced economies to estimate recession odds, puts the probability of recession at under 10% over the next year and just over 20% over the next two years, below the historical average (Exhibit 1). Our recession risk dashboard—a collection of the most valuable leading indicators drawn from our research and academic studies—also continues to send a comforting message (Appendix).
But with monetary and eventually fiscal tightening on the agenda in the years ahead and concern about trade wars and vulnerable foreign economies growing, markets have begun to grumble about the risks further down the road. In this week’s Analyst, we assess the popular view that recession is coming in 2020, take stock of the danger presented by both the key risks now in focus as well as the more timeless causes of recession, and consider what history tells us about how much longer this expansion can last.

Exhibit 1: Our Recession Probability Model Continues to Indicate Below-Average Recession Risk

1. Our Recession Probability Model Continues to Indicate Below-Average Recession Risk. Data available on request.
Source: Goldman Sachs Global Investment Research

Recession 2020?

The thesis that recession is coming in 2020 has quickly become popular in financial markets. While we expect a meaningful slowdown by then, we do not see recession as the most likely outcome.
By 2020 we expect growth to have dropped off sharply from its current 4%+ pace to a level somewhat below our 1.75% estimate of long-run potential growth. We see three reasons to expect slower growth.
First, the growth impulse from fiscal policy is set to diminish from +0.7pp in 2018 and +0.6pp in 2019 to a slightly negative contribution in 2020, a passive tightening that would become more likely if the Democrats take the House of Representatives in the midterm elections. Second, the recent tightening in financial conditions should begin to slow growth later this year and through 2019, and the additional rate hikes we expect that are not yet reflected in market pricing would imply further tightening that would slow growth into 2020. These first two factors are worth a total of roughly -¼pp in 2020 (Exhibit 2). Third, our earlier estimates suggest that natural deceleration from tighter supply constraints as the labor market moves further beyond full employment is worth a further -¼pp. Taken together, these effects suggest a growth rate roughly ½pp below potential, in line with our 1.25% forecast.

Exhibit 2: The Growth Impulse from Fiscal Policy and Financial Conditions Should Turn Negative in 2020

2. The Growth Impulse from Fiscal Policy and Financial Conditions Should Turn Negative in 2020. Data available on request.
Source: Goldman Sachs Global Investment Research
Lower potential growth implies higher recession risk under the standard if arbitrary definition of a recession as negative growth, and a below-potential 1.25% growth baseline in 2020 provides even less room for error. Historical consensus growth forecast errors a bit more than a year ahead suggest a roughly 25% probability of a 1.25pp downside miss. This implies that a recession, at least a technical one, is much more likely in 2020 than over the next year, but not the base case.

Risks in Focus: The Trade War and Foreign Spillovers

Investors and Fed officials have focused on two key risks recently: the trade war and possible economic or financial spillovers from vulnerable foreign economies. We discuss each below.
A Trade War
The trade war has escalated quickly over the last two months. The US has implemented tariffs targeting nearly $100bn in imports, and we now expect an additional round targeting another $200bn in imports from China to be implemented. We do not expect further tariff rounds on Chinese imports beyond that or tariffs on auto imports, implying that the trade war will only amount to a 1.5pp increase in the effective US tariff rate. The limited decline of our China-exposed US equity basket—down 6% relative to the broader market since its May peak—suggests the market largely agrees.
We see little evidence that the trade war has hurt US growth so far. The most trade-dependent sectors have not underperformed, and business sentiment surveys show only modest concern.
Fed officials have worried that even without larger tariffs, uncertainty about trade policy could reduce investment, the GDP component that has made the largest contributions to recessions historically. Academic research finds some evidence of trade policy uncertainty effects, but it is not clear that they are meaningful at a macroeconomic level. We find that while the overall Economic Policy Uncertainty Index—which is not currently elevated—adds predictive information to a standard model of aggregate investment growth, its trade policy component—which is quite elevated—does not. In the one previous episode in which the trade policy uncertainty index truly spiked, the NAFTA negotiations, investment in factories dropped off temporarily (Exhibit 3), but overall investment was not unusually low.

Exhibit 3: Trade Policy Uncertainty Could Depress Manufacturing Investment, but the Evidence Is Limited

3. Trade Policy Uncertainty Could Depress Manufacturing Investment, but the Evidence Is Limited. Data available on request.
Source: PolicyUncertainty.com, Department of Commerce, Goldman Sachs Global Investment Research
What about the economic impact of a larger-scale trade war? Our global macroeconomic model suggests that the direct economic effects on US growth of even a fairly severe global trade war would be modest, though the impact via the equity market could be more substantial. US history provides few examples of major trade wars, but the most famous one—the Smoot-Hawley Act of 1930—offers a similar lesson. Modern research generally assigns the Smoot-Hawley tariffs a limited direct role in the Great Depression, though tariff-related fears appear to have contributed to the stock market decline.[1]
Global Spillovers
Investors and Fed officials have also highlighted spillovers from vulnerable foreign economies as a potential downside risk. We see little risk so far: our global CAIs show that growth remains above potential in most of the world, and we remain cautiously optimistic on emerging markets.
Historically the US has been fairly immune to foreign spillovers. According to our analysis of the historical causes of US recessions, it has been about a century since the US last “imported” a recession via weak global demand or financial contagion.
But foreign spillovers could hit US growth via both economic and financial channels, and in both cases the risks look higher today. On the economic side, the rising share of exports in GDP has made the US a bit more vulnerable to declines in foreign demand. Our global macro model estimates that a 1pp decline in foreign growth reduces US growth by about 0.2pp over the next year. On the financial side, recent research shows that global equity markets in particular have become more synchronized in recent decades, largely due to co-movement of risk premiums. The surprisingly strong reaction of the US equity market to growth fears in China in late 2015 and early 2016 offered a reminder of this trend. Our rule of thumb is that a 10% decline in the US equity market reduces GDP growth by about 0.5pp.
Exhibit 4 shows how a foreign slowdown coupled with a US equity market sell-off might affect US growth. The estimates show that importing a recession would need to involve a significant equity market correction. But with our baseline for growth at 1.25-1.5% over the next couple years, it would not take an extreme combination of events to knock the US economy into at least a technical recession.

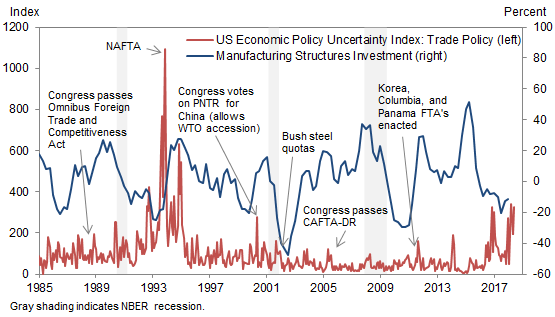
Exhibit 4: Foreign Spillovers Coupled with a Large Equity Market Sell-off Could Tip the US into Recession

4. Foreign Spillovers Coupled with a Large Equity Market Sell-off Could Tip the US into Recession. Data available on request.
Source: Goldman Sachs Global Investment Research

Recession Risks: The Usual Suspects

We turn next from these recent hot topics to the two more common types of modern US recessions, the textbook overheating variety and what Fed Chairman Powell has called the “financial excess” variety.
Overheating
Overheating recessions have occurred historically when the economy moved past potential, a tight labor market boosted wage growth, and elevated demand caused energy and other commodity prices to spike, leading to accelerating inflation and an aggressive tightening response by the Fed. This pattern looks less threatening today than a mechanical reading of history might suggest, both because inflation expectations are better anchored and because the domestic shale industry moderates energy price swings and makes their impact on US GDP more neutral. But we wouldn’t downplay this risk too much. After all, we expect the unemployment rate to fall to its lowest level since the Korean War next year.
Fortunately, overheating risk is straightforward to monitor and looks limited for now. Core inflation remains a touch below target, a trend measure of unit labor cost growth—our GS wage growth tracker minus three-year average productivity growth—also remains below 2%, and both household inflation expectations and market-implied inflation compensation are below average (Exhibit 5). But going forward, both a historically tight labor market and the trade war pose upside inflation risks.

Exhibit 5: Overheating Risks Look Limited for Now

5. Overheating Risks Look Limited for Now. Data available on request.
Source: Department of Commerce, Federal Reserve Board, University of Michigan, Goldman Sachs Global Investment Research
Financial Excess
Under the heading of financial excess we include recessions caused by both boom-bust cycles in asset markets as well as their real economy analogue, cycles of unsustainable debt growth to finance investment and consumption followed by protracted deleveraging.
Our financial excess monitor tracks these two areas of risk: elevated valuations and risk appetite in asset markets, and financial imbalances and vulnerabilities in the household, business, banking, and government sectors. We combine a wide range of risk measures to produce overall scores for each of the five asset classes and four sectors of the economy, showing the results as a heat map in which blue indicates restraint and red indicates elevated risk (Exhibit 6).
The heat map continues to show a restrained level of risk, with the overall financial excess score still lower than before the 2001 recession and much lower than before the 2007-2009 recession. The only noticeable change from Q1 to Q2 was modestly higher risk in commercial real estate as credit standards stopped tightening and CMBS spreads narrowed a touch further. Valuations look only moderately elevated in other asset markets, and we see few signs of private sector financial imbalances. While government debt sustainability remains a long-run concern, we see this less as a risk that could spark the next recession than as a risk that could prolong it if policymakers perceive a lack of fiscal space.

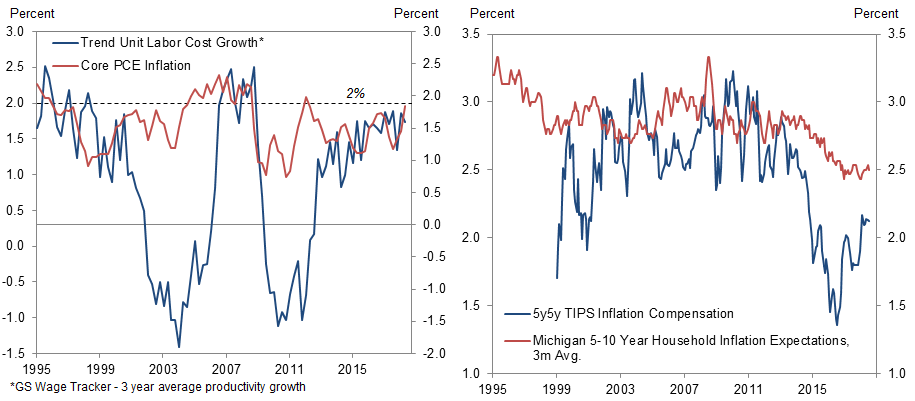
Exhibit 6: Our Financial Excess Monitor Still Shows Only Moderate Risk

6. Our Financial Excess Monitor Still Shows Only Moderate Risk. Data available on request.
Source: Goldman Sachs Global Investment Research
We see these two standard recession risks as complementary—overheating and the associated risks of a more abrupt shift in monetary policy are more threatening when financial imbalances are elevated and less threatening when they are limited. While neither risk is alarming yet, both tend to rise in environments where the economy moves past potential and warrant close monitoring.

Can the Expansion Last?

The expansion is now just a year away from becoming the longest in US history. The good news is that age alone has not been a great predictor of recession risk, and that in any case the age of this expansion looks much less extreme when compared to the broader set of post-war developed market business cycles. In addition, we have some important advantages today, including both a lack of financial imbalances and monetary policymakers who have benefited from the lessons of past cycles.
The bad news is that the output gap and especially the unemployment rate have been very strong predictors of how soon US expansions will end. With job creation still running at double the breakeven pace, the unemployment rate—already ½pp below our estimate of the sustainable rate—is likely to fall significantly further. For the expansion to continue for many years, the Fed will first need to stabilize the unemployment rate and eventually to nudge it somewhat higher without setting off a recession. This is certainly possible in principle, but it is something that the Fed has never achieved before and in fact that few advanced economy central banks have achieved. The further the overshoot extends, the longer the economy will have to operate somewhat below potential to return to a sustainable place. This implies an increasingly narrow runway for a soft landing.

David Mericle

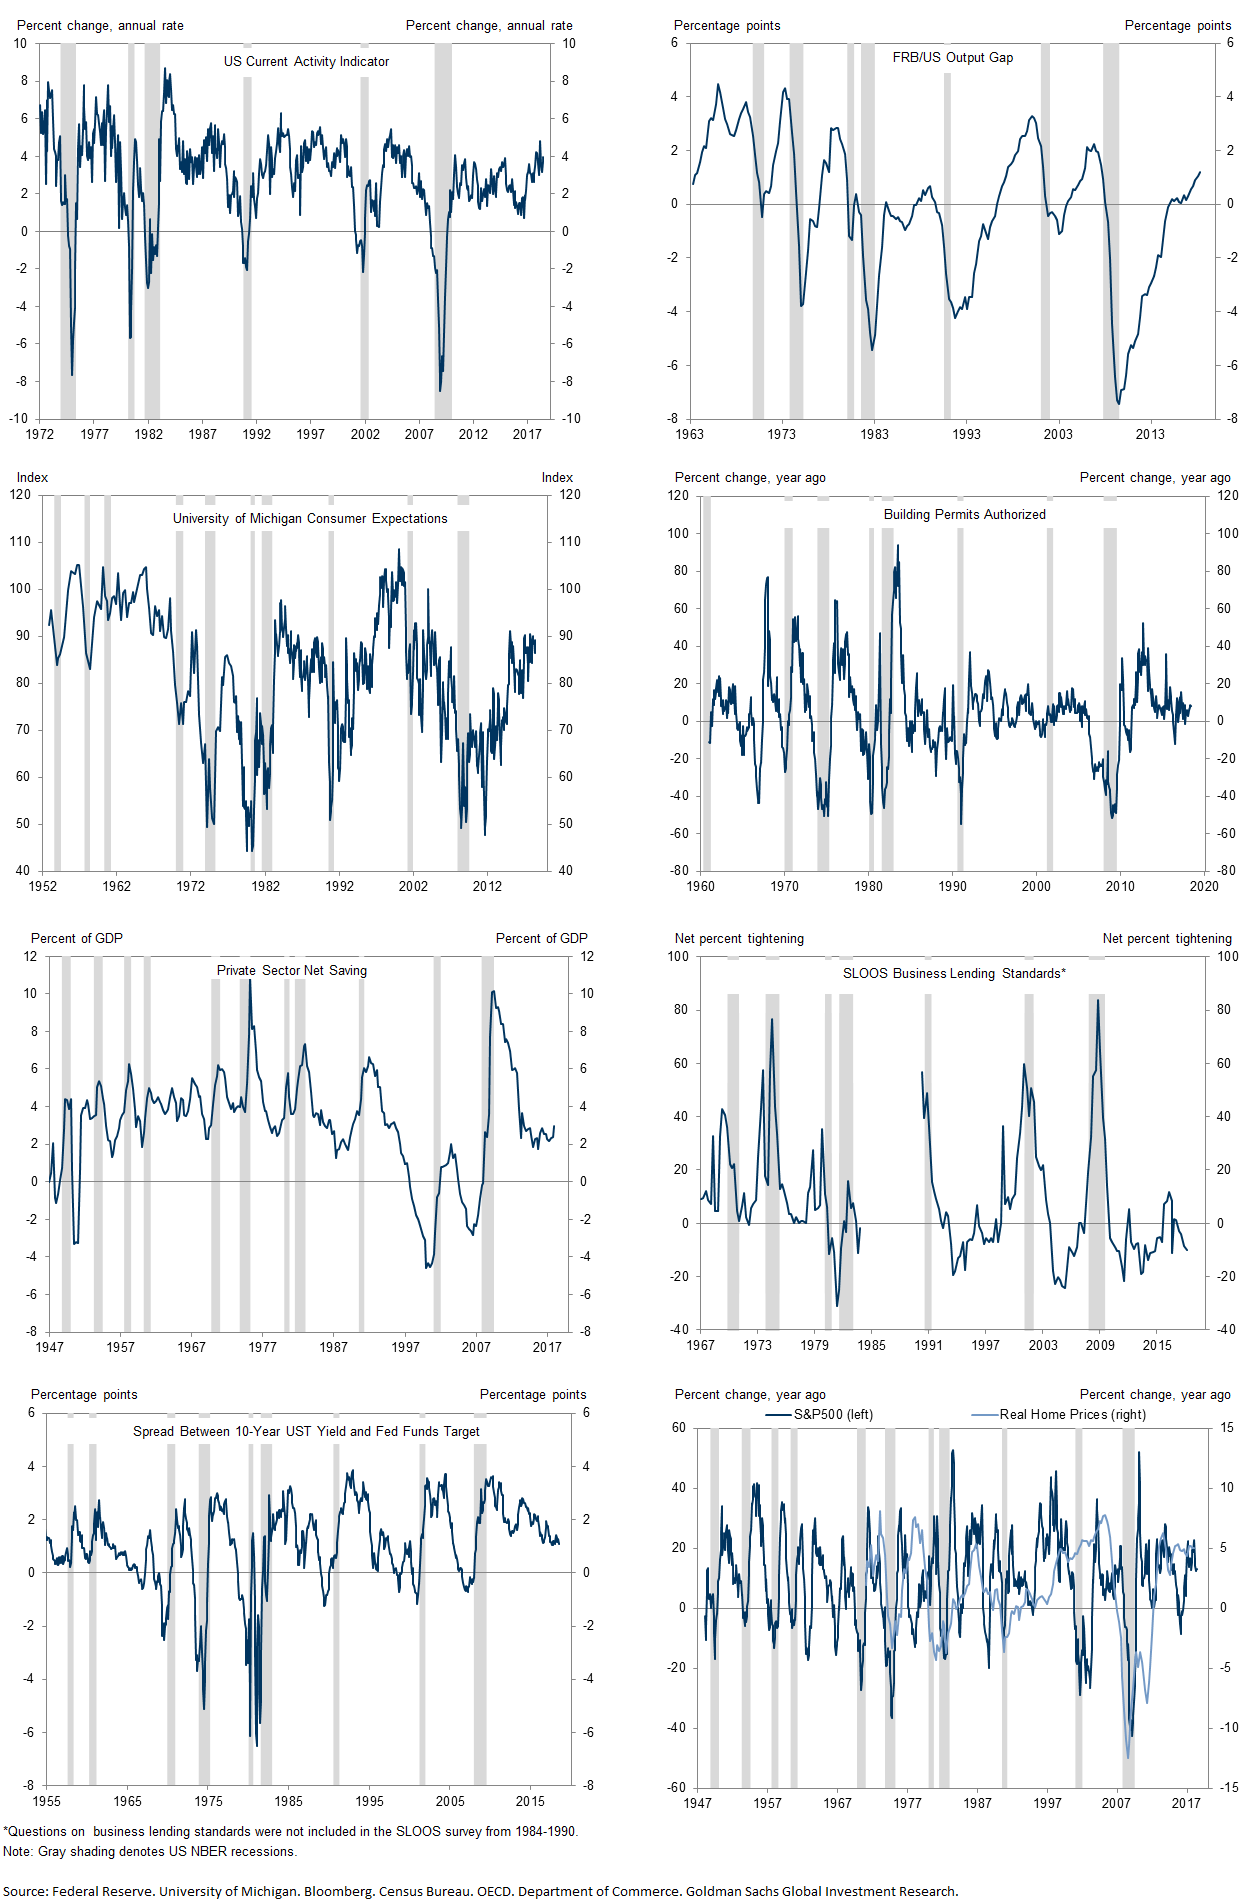
Exhibit 7: Appendix: Recession Risk Dashboard

7. Appendix: Recession Risk Dashboard. Data available on request.
Source: Federal Reserve Board, University of Michigan, Department of Commerce, Haver Analytics, Goldman Sachs Global Investment Research

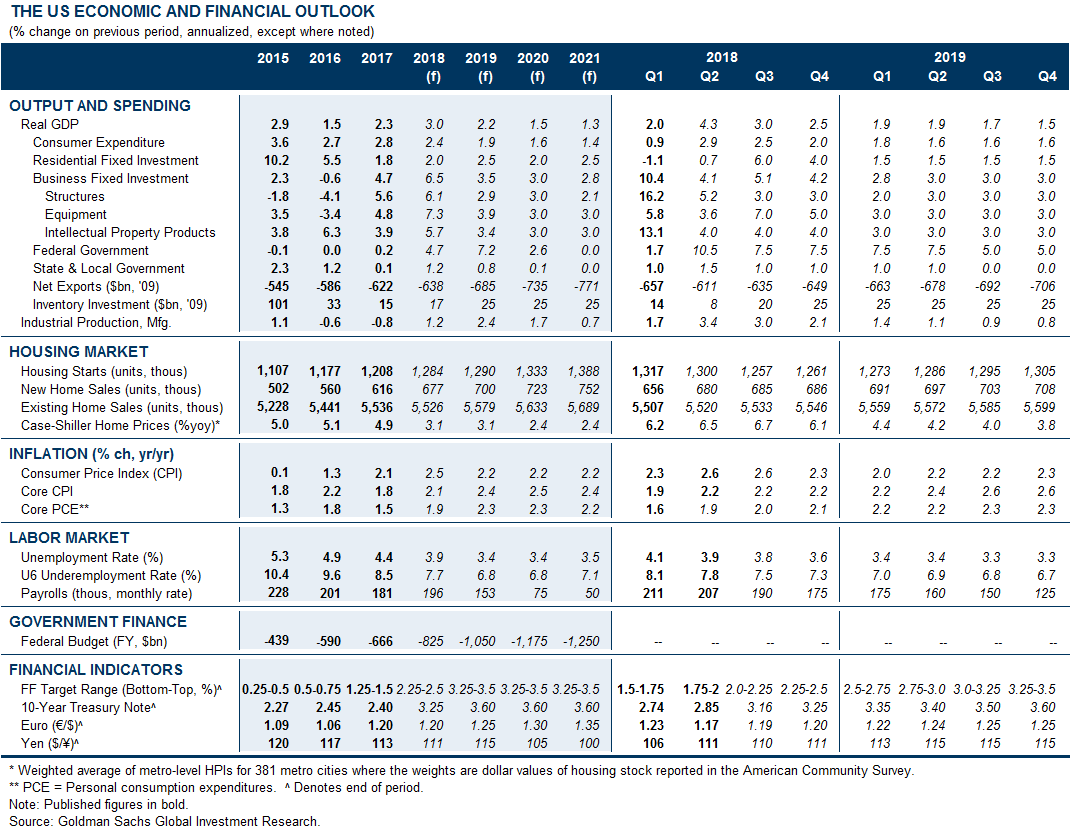
The US Economic and Financial Outlook

Data available on request.
Source: Goldman Sachs Global Investment Research

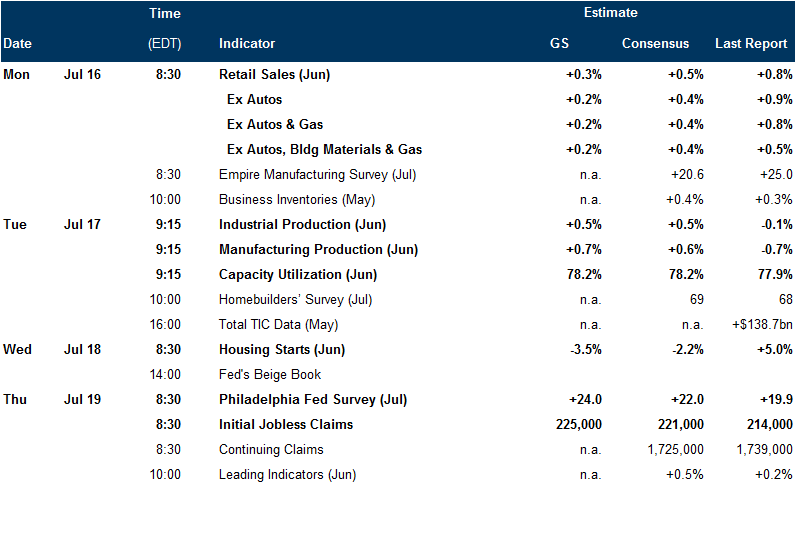
Economic Releases and Other Events

Data available on request.
Source: Goldman Sachs Global Investment Research
  1. 1 ^ While this might seem like a dramatic analogy, the impact of the Smoot-Hawley Act itself on the effective tariff rate—as opposed to the impact of the deflationary environment at the time—appears to be comparable in magnitude to the effect of the full set of White House proposals released so far. See David Mericle and Alec Phillips, “Trade Disputes: What Happens When You Break the Rules?” US Daily, 17 February 2017.

Investors should consider this report as only a single factor in making their investment decision. For Reg AC certification and other important disclosures, see the Disclosure Appendix, or go to www.gs.com/research/hedge.html.