Goldman Sachs Research
US Daily: The Yield Curve Does Not Indicate Elevated Recession Risk (Mericle/Struyven)
22 August 2018 | 12:12AM EDT | Research | Economics| By Jan Hatzius and others
More
  • The historical correlation between yield curve inversion and recession is impressive. But what exactly is an inversion of, say, the 2s10s curve supposed to tell us? Roughly, an inversion indicates that the monetary policy stance is restrictive or is expected to become restrictive.

  • This signal has worked well historically because US recessions have tended to follow overheating that led to restrictive policy. But it raises two problems. First, it is inconsistent: the decline in the term premium has dramatically changed the signal about the restrictiveness of policy. Second, it is narrow: recessions do not have to be preceded by restrictive monetary policy.

  • This does not mean that the yield curve is useless for assessing recession risk. In our view, the “wisdom of the crowd” embodied in the yield curve can provide useful input on two questions. First, the near-term forward spread provides a sense of the market’s view of the economic outlook. Second, the market’s view of neutral helps us judge how far into restrictive territory we have gone. At the moment, however, neither measure indicates heightened recession risk.

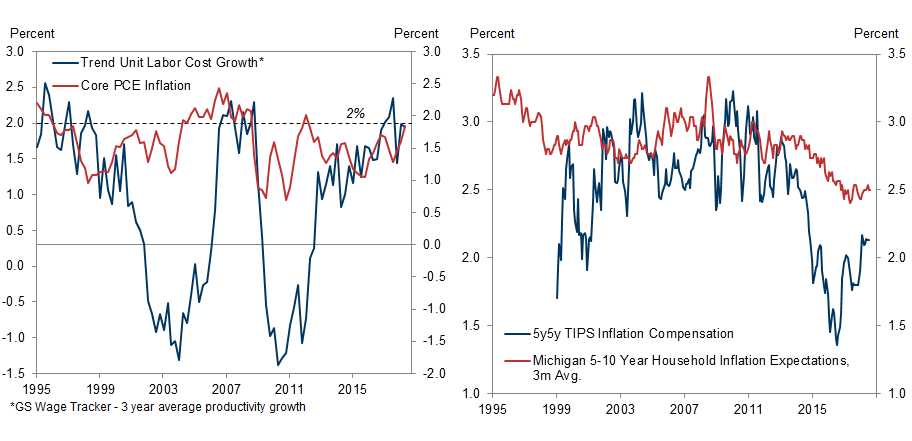
  • In gauging overheating risk, we think it is more straightforward to look directly at the economic data. We currently see moderate cause for concern: while price and wage pressures look contained for now, the US unemployment rate is headed to historically low levels.

The Yield Curve Does Not Indicate Elevated Recession Risk

The historical correlation between yield curve inversion and recession is impressive. Investors have focused in particular on the slope of the 2s10s curve recently, and other measures such as fed funds/10s or 2s30s are also often used as indicators of recession risk. As the yield curve has moved closer to inversion (Exhibit 1), commentators and a few Fed officials have raised the alarm.

Exhibit 1: The 2s10s Curve Has Inched Closer to Inversion

1. The 2s10s Curve Has Inched Closer to Inversion. Data available on request.
Source: Federal Reserve Board, Goldman Sachs Global Investment Research
But what exactly is a yield curve inversion supposed to tell us? In the case of the 2s10s curve, we can think of the 10y yield as roughly the market-implied neutral rate plus a term premium and the 2y yield as the expected near-term policy rate plus a term premium. The curve inverts when the expected policy rate exceeds neutral by roughly the difference between the 10y and 2y term premia. This is somewhat convoluted and not very intuitive, but essentially indicates that policy is expected to become restrictive.
This type of signal has worked well historically because US recessions have generally followed overheating that led to a restrictive monetary policy stance.[1] But it can be misleading for two reasons.
First, the strength of the signal is wildly inconsistent over time because the threshold for inversion—the term premium—has changed dramatically. The term premium declined as the Fed brought inflation under control. This reduced the inflation risk premium and made bonds a better hedge against risk assets as supply shock recessions associated with high inflation gave way to demand shock recessions associated with low inflation. More recently, global QE further reduced the term premium. Using the 2s10s slope reduces this bias because the 2y yield has a term premium too, but only partly (Exhibit 2).
The upshot is that the premise of using inversion as a signal—that there is a consistent mapping from the slope of the yield curve to the probability of recession—is not plausible. Where an inversion once indicated that the policy rate was hundreds of basis points past neutral, today an inversion could occur as soon as the funds rate reaches neutral, or even before.
Second, the recession signal provided by the 2s10s slope is unnecessarily narrow in scope. While US recessions have historically been preceded by overheating and restrictive monetary policy, they do not have to be. If the market perceived danger a year ahead that could lead to rate cuts, say from fiscal contraction or foreign spillovers, this could lower the 2y rate more than the 10y rate, steepening the curve. The Fed funds/10s curve is immune to this second problem, but more vulnerable to the first.

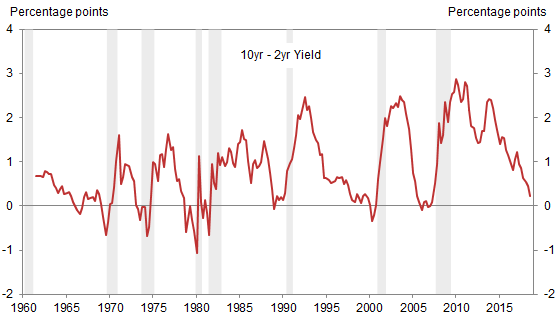
Exhibit 2: The Decline in the Term Premium Makes an Inversion a Much Weaker Signal Today

2. The Decline in the Term Premium Makes an Inversion a Much Weaker Signal Today. Data available on request.
Source: Federal Reserve Bank of New York, Goldman Sachs Global Investment Research
These problems with the slope measures most popular in markets do not mean that the yield curve is useless for assessing recession risk. The “wisdom of the crowd” embodied in the yield curve can be useful in two ways. First, the market’s near-term economic outlook can be captured more clearly via its funds rate expectations by something like the 0-to-6 quarter forward spread, as suggested by recent Fed research. Second, the market’s view of the neutral rate—which helps us judge more clearly how far into restrictive territory we have gone—can be captured by the 10y1m Overnight Index Swap (OIS) forwards adjusted for term premium estimates from the Treasury curve, as suggested by our rates strategists.
The market’s view is certainly not the last word on these subjects, but it does provide one perspective among others. At the moment, however, neither of the two market measures indicates heightened recession risk or tells us anything particularly novel. The near-term forward spread translates to fairly modest recession odds, and the market’s view of the neutral rate is very close to the Fed’s (Exhibit 3).

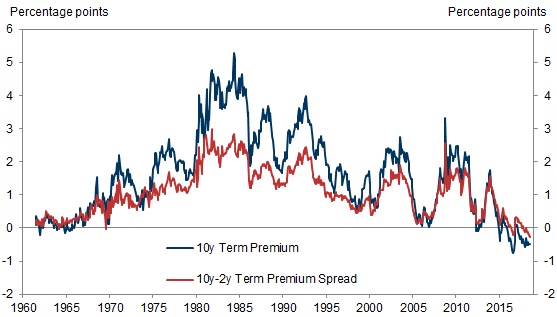
Exhibit 3: A More Reliable Interpretation of the Yield Curve Does Not Indicate Heightened Recession Risk

3. A More Reliable Interpretation of the Yield Curve Does Not Indicate Heightened Recession Risk. Data available on request.
Source: Federal Reserve Board, Goldman Sachs Global Investment Research
While yield curve inversions have historically captured overheating risk well, in light of the problems discussed above we think that risk can be gauged more transparently today by looking directly at the economic data. As we noted recently in our recession risk report, we see this risk as moderate for now.
So far, inflation and trend unit labor cost growth remain a touch below 2%, and household and market inflation expectations remain on the soft side (Exhibit 4). However, we expect the unemployment rate to fall to 3% by early 2020, the lowest level since the Korean War. High inflation has been common in labor markets that tight, and we see containing the overshoot as the key to avoiding recession in coming years. We are skeptical that the slope of the yield curve adds much to this basic economic perspective.

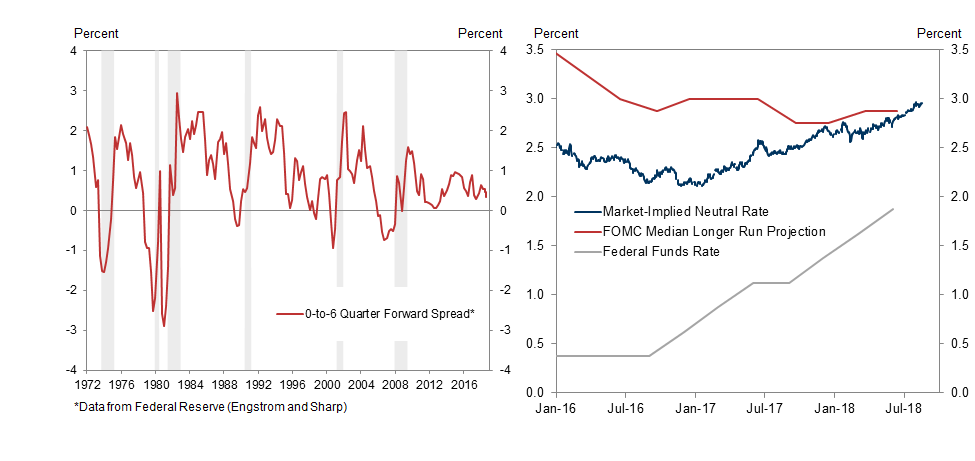
Exhibit 4: A More Direct Economic Perspective on Overheating Risk Indicates Moderate Concern for Now

4. A More Direct Economic Perspective on Overheating Risk Indicates Moderate Concern for Now. Data available on request.
Source: Department of Commerce, Federal Reserve Board, University of Michigan, Goldman Sachs Global Investment Research
Our views notwithstanding, would Fed officials view a yield curve inversion as a reason to pause rate hikes? On Monday, Atlanta Fed President Raphael Bostic said clearly that he would not vote for a hike that would knowingly invert the curve, and a few other Fed officials have also expressed concern about a possible inversion. Even so, we continue to think that the FOMC would ultimately decide to raise the policy rate in such a scenario if it felt it were the appropriate response to economic conditions.
David Mericle
Daan Struyven
  1. 1 ^ This is also true if we use model estimates of the neutral rate instead of market-implied estimates. The real fed funds rate (net of core PCE inflation) has exceeded the Holston-Laubach-Williams real neutral rate estimate in every recession since 1969, the first for which data are available.

Investors should consider this report as only a single factor in making their investment decision. For Reg AC certification and other important disclosures, see the Disclosure Appendix, or go to www.gs.com/research/hedge.html.