Goldman Sachs Research
US Economics Analyst
The Sudden Stop: A Deeper Trough, A Bigger Rebound
31 March 2020 | 1:12AM EDT | Research | Economics| By Jan Hatzius and others
More
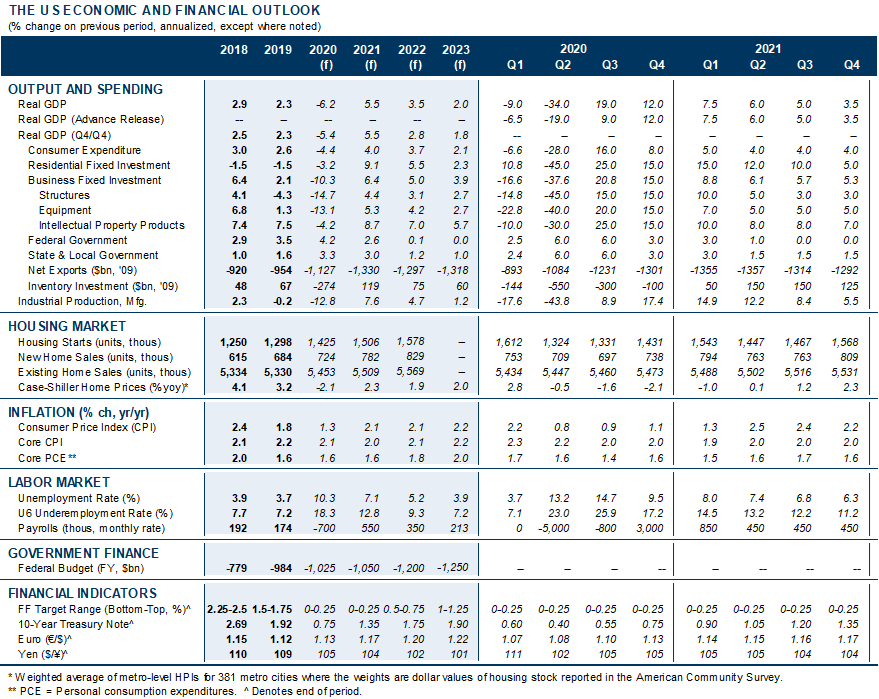
  • We are making further significant adjustments to our GDP and employment estimates. We now forecast real GDP growth of -9% in Q1 and -34% in Q2 in qoq annualized terms (vs. -6% and -24% previously) and see the unemployment rate rising to 15% by midyear (vs. 9% previously). However, we have upgraded our expectations for the recovery after midyear, with a 19% qoq annualized GDP gain in Q3 (vs. 12% previously). Our estimates imply that a bit more than half of the near-term output decline is made up by yearend and that real GDP falls 6.2% in 2020 on an annual-average basis (vs. 3.7% in our previous forecast).

  • These forecast changes reflect the net effect of two directionally offsetting changes. On the one hand, the anecdotal evidence and the sky-high jobless claims numbers show an even bigger output and (especially) labor market collapse than we had anticipated. This not only means deeper negatives in the very near term but also raises the specter of more adverse second-round effects on income and spending a bit further down the road.

  • On the other hand, both monetary and fiscal policy are easing dramatically further, which will tend to contain these second-round effects and add to growth down the road. The Phase 3 fiscal package was much bigger than we had expected, we now anticipate a Phase 4 package focused on state fiscal aid, and the Fed is likely to use the $454bn addition to the Treasury’s Exchange Stabilization Fund aggressively to sustain the flow of credit to private-sector and municipal borrowers.

  • We have not made major changes in our assumptions on the time path of the recovery. While the uncertainty is substantial, we expect the lockdowns and social distancing to result in sharply lower new infections over the next month, and our baseline is that slower virus spread and adaptation by businesses and individuals should set the stage for a gradual recovery in output starting in May/June.

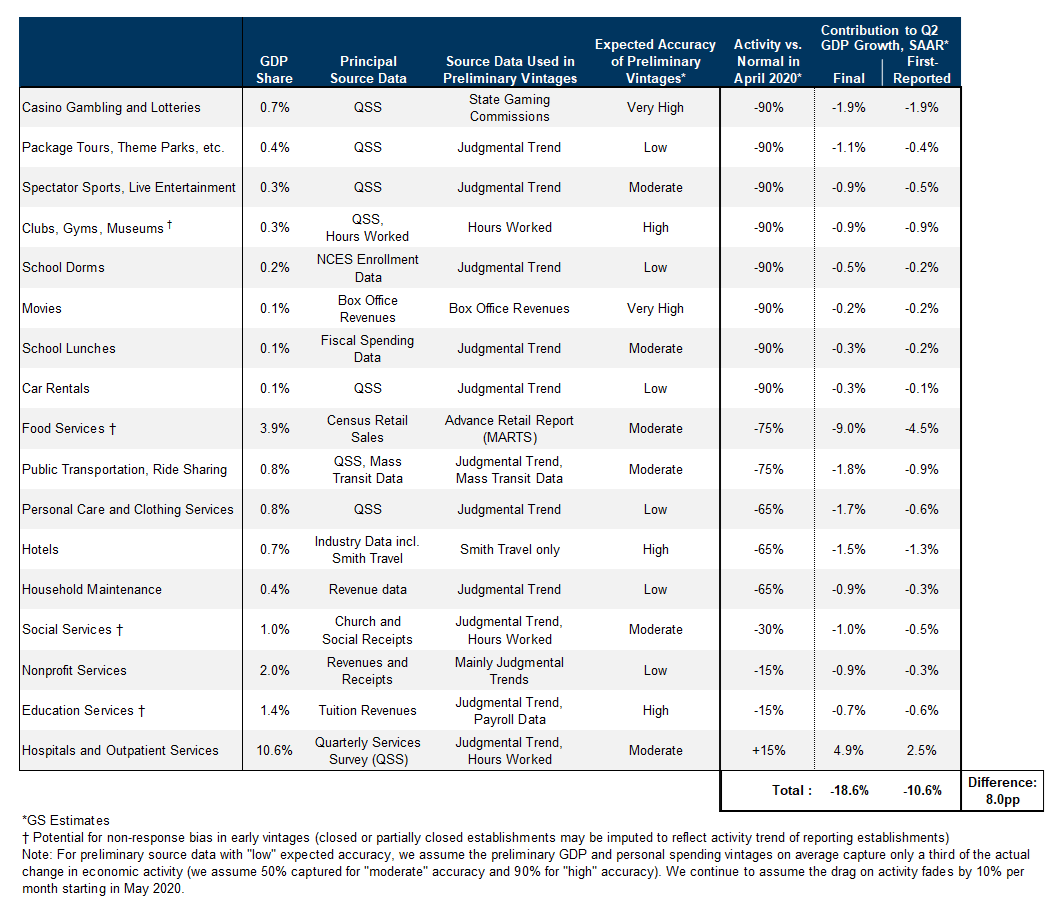
  • The depth of the near-term output decline is unlikely to show up fully in the Q1/Q2 advance GDP reports, many of whose components are estimated on the basis of judgmental trends that are only replaced by actual source data in later vintages. If the true Q2 decline is 34%, we would expect a reported decline of “only” -19% in the advance report.

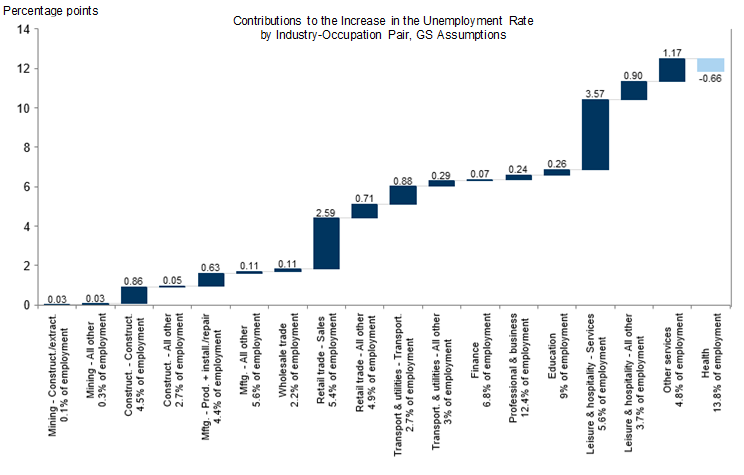
  • By contrast, the labor market data—especially jobless claims and the household survey—are likely to provide much better real-time signals. Our working assumption during this crisis is that each 1pp increase in the unemployment rate corresponds to roughly a 1% decline in the level of real GDP relative to trend. We plan to lean heavily on this relationship—and its industry-level counterparts—to keep our GDP estimates up to date in coming months.

The Sudden Stop: A Deeper Trough, A Bigger Rebound

With business closures and social distancing shutting down large parts of the economy, in this week’s Analyst we refresh our growth forecasts to reflect high-frequency activity data, the surge in layoffs now evident in the jobless claims data, and the fiscal, monetary, and public health policy response.

A Deeper Trough in GDP…

We have further increased our estimates of the peak hit to services consumption, manufacturing activity, and construction, in light of new evidence on the severity of the hit across the different sectors, described in greater detail below. All told, we now expect the level of GDP in April to be 13% below the January/February trend, as shown in Exhibit 1. We assume that this drag then fades gradually by 10% each month in the services industry and by 12.5% in the manufacturing and construction industries. While the exact timing of the medical and economic recovery is highly uncertain and relapses are plausible, our assumption is that stronger lockdown and social distancing measures and perhaps some weather effects reduce new infections sharply over the next month. Combined with potential medical breakthroughs or adaptation by firms and consumers, this slowdown in new infections is likely to lead to a gradual economic recovery. The slow pace of recovery in our forecast even in 2021 allows for longer-lasting scarring effects on businesses and workers.

Exhibit 1: Coronacrisis to Reduce April Economic Activity by Around 13%

1. Coronacrisis to Reduce April Economic Activity by Around 13%. Data available on request.
Source: Goldman Sachs Global Investment Research
In addition to a larger direct hit from the outbreak on the services, manufacturing, and construction industries, we have made two further adjustments to the growth effects.
On the negative side, we now explicitly build in negative second round effects from the slump in private sector income to consumer and business spending based on the recent jobless claims data suggesting that the labor market downturn is significantly more dramatic than widely expected. We assume that the medium-term pass-through from the slump in these private-sector industries (i.e. lower wages and salaries and lower corporate profits) to aggregate spending is somewhat below one and occurs gradually.
On the positive side, we have revised upwards our fiscal assumptions following the passage of the larger-than-expected Phase 3 package worth roughly $2 trillion and our assumption of a potential Phase 4 package worth several hundred billion dollars in the summer as the unemployment rate rises further. This significant fiscal easing should partly offset the negative second-round effects from the slump in private sector income. We assume relatively long lags as consumers and businesses only gradually regain confidence to spend.
Exhibit 2 translates the monthly path of the level of GDP shown in Exhibit 1 into a quarterly path of GDP growth, adding the impact of the second round effects and the fiscal impulse. For the first half of 2020, we now look for real GDP growth of -9% in Q1 and -34% in Q2, versus -6.3% and -24% previously. Our Q2 forecast would represent a decline that is more than three times larger than the previous low in the history of the modern US GDP statistics (-10% in 1958Q1). Subsequently, our assumptions about the gradual fading of the virus drag imply a growth pace of just over 15% in the second half of 2020. Our forecast of full-year 2020 growth is now -6.2% on an annual average basis and -5.4% on a Q4/Q4 basis.

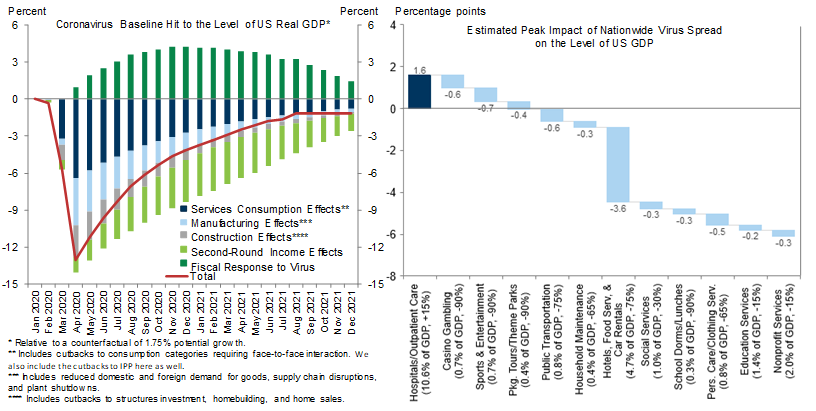
Exhibit 2: An Even Deeper Trough

2. An Even Deeper Trough. Data available on request.
Source: Goldman Sachs Global Investment Research
What lies behind the deeper declines in manufacturing and services? In Exhibit 3, we estimate the hits to manufacturing activity for several categories based on a wide collection of recent anecdotes, declines in prior downturns, and commentary from our industrial sector analysts. We expect a roughly 35% peak decline in overall manufacturing activity in April. This includes a large decline in autos manufacturing due to reduced demand and plant shutdowns, a roughly 1-1 decline in manufacturing activity matching the declines in consumer spending for most retail products, and an offsetting increase in manufacturing of coronavirus-trade-groups-say/574655/">food and beverages and other household products as well as medical equipment to keep up with increased demand. We expect manufacturing to recover somewhat more rapidly than services, as factories are likely to reopen more quickly than non-essential services firms.

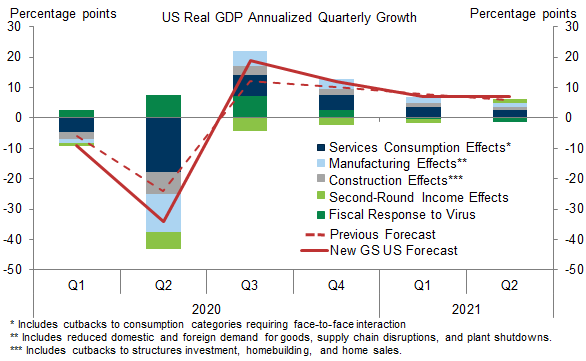
Exhibit 3: Estimated Peak Manufacturing Hit by Industry, Based on News Anecdotes

3. Estimated Peak Manufacturing Hit by Industry, Based on News Anecdotes. Data available on request.
Source: Goldman Sachs Global Investment Research
We are now also using more negative assumptions about services consumption, as shown in Exhibit 4.
We now expect a 19pp annualized drag from services consumption on Q2 growth, on top of a 3pp drag on Q1 growth. However, several components of service consumption are poorly measured, especially in the Commerce Department’s “advance” GDP release. As shown in the third and fourth columns, in many cases, principal source data is not yet available for the first vintages of GDP (quarterly) and personal spending (monthly).[1] Accordingly, we estimate that the first GDP vintage will only capture two-thirds of this drag.

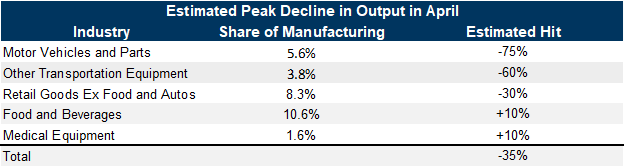
Exhibit 4: Estimated Peak Services Consumption Hit by Sector, Final and Advance Readings

4. Estimated Peak Services Consumption Hit by Sector, Final and Advance Readings. Data available on request.
Source: Department of Commerce, Goldman Sachs Global Investment Research

…And a Dramatic Hit to Employment

Turning to the labor market, the surge in layoffs has already outpaced our expectations. Jobless claims rose about twelve-fold over the week of March 15-21 to 3.28mn, nearly five times the previous historical high for a single week. Jobless claims are likely to rise further during the week of March 22-28. Press reports citing state officials indicate that claims rose dramatically from March 15-21 to 22-28 in California and Texas. Our analysis of anecdotal press reports for the 15 most populated states suggests a significant increase in total claims during March 22-28, in part because many states experienced application bottlenecks in the first week and in part because stay-at-home orders likely had a greater effect in the second week.
Accounting only for the large states where press reports permitted concrete estimates, we estimate that the level of jobless claims rose by more than 2mn to about 5.5mn during March 22-28. A less conservative extrapolation of the estimated ratio of week 2 to week 1 claims in these states would imply an even higher national total.
We expect claims to remain very elevated—likely over 2mn—for at least another week (March 29-April 4) and somewhat elevated after that. Widespread reports of application bottlenecks suggest that many laid off workers have yet to file. Some employers, especially in the retail sector, are taking a staggered approach to layoffs. And many business owners and workers are just beginning to learn about the more generous unemployment insurance benefits—which will exceed normal wages for many workers—and the expansion of coverage included in the Phase 3 legislation. In total, we expect over 11mn claims to be filed in the first three weeks of the coronacrisis and at least a couple million more in the rest of April.
How high will the unemployment rate ultimately rise? To estimate the peak, we use a bottom-up analysis of likely job losses by sector and occupation—for example, sales workers in the retail trade industry or services workers in leisure and hospitality. We link our assumptions to anecdotal reports where possible; for example, news stories and recent layoff postings required under the Worker Adjustment and Retraining Notification Act suggest that many restaurants have laid off all employees.
Exhibit 5 shows our new estimates. We now project a nearly 12pp increase in the unemployment rate to a peak rate of 15%, though we repeat our earlier warning that we have more confidence that a large increase will be apparent in the U5 rate—which includes individuals who want a job but aren’t actively looking—than in the standard U3 rate.

Exhibit 5: Our Bottom-Up Estimate Implies a Nearly 12pp Increase in the Unemployment Rate

5. Our Bottom-Up Estimate Implies a Nearly 12pp Increase in the Unemployment Rate. Data available on request.
Source: Goldman Sachs Global Investment Research

Focus on the Labor Market

As noted above, GDP is likely to understate the weakness in activity in the early “vintages”. By contrast, the labor market data are likely to be more timely and accurate in tracking the downturn. In the current environment, it is therefore essential to cross-check our GDP estimates using the labor market indicators, including both jobless claims and the household survey of employment.
Using the labor market data in this fashion requires an estimate of “Okun’s law”, the relationship between the change in the unemployment rate and the change in real GDP (relative to trend). Normally, the coefficient for Okun’s law is thought to be about 2, meaning that a 1pp rise in the unemployment corresponds to a 2% hit to real GDP. During this crisis, however, a more appropriate Okun’s law coefficient is likely to be closer to 1, for three reasons. First, a 1:1 relationship seems to better fit the data over the last 15 years. Second, the decline in GDP is likely to be concentrated in lower-wage (and lower output-per-worker) industries and occupations, even compared to a typical recession. Third, while output often declines more than unemployment rises in recessions because businesses respond to reduced demand in part by cutting hours (or because productivity declines as retained employees have less work to do), the coronacrisis revenue shock is likely to be so extreme for many businesses that it will force them to respond mostly via layoffs.
Our current estimate of a roughly 12pp increase in the unemployment rate implies a roughly 12% peak decline in the level of GDP, which is broadly consistent with the estimates in Exhibits 1 and 2. Going forward, we plan to use this relationship and its industry-level counterparts aggressively to keep our GDP estimates up to date in coming months as more timely labor market data become available. This could well imply further substantial revisions to our real GDP estimates—in either direction—as the scale of the labor market downturn comes into fuller view in coming weeks and months.

US Economics Team

The US Economic and Financial Outlook

Exhibit 6

6. Data available on request.
Source: Goldman Sachs Global Investment Research
  1. 1 ^ We expect a few methodological pivots as statisticians seek alternative data on which to base their estimates—but not enough to avoid sizeable measurement error in several GDP components, as the BEA may be reluctant to assume outsized declines in spending and investment activity in cases where alternative data is lacking or has insufficient history.

Investors should consider this report as only a single factor in making their investment decision. For Reg AC certification and other important disclosures, see the Disclosure Appendix, or go to www.gs.com/research/hedge.html.