Goldman Sachs Research
US Economics Analyst
Reopening the Economy
15 April 2020 | 12:49PM EDT | Research | Economics| By Jan Hatzius and others
More
  • The US is now largely in lockdown mode and social distancing has increased nationwide. But with the daily number of new confirmed virus cases plateauing and big data measures indicating a sharp decline in the true number of new cases, discussion is turning to the plan for reopening. This week’s Analyst asks what reopening will look like and what it means for the pace of the recovery.

  • Absent a vaccine or treatment breakthrough, reopening will be gradual. New evidence suggests that the share of the population that has been infected is higher than test counts imply, but still too low to achieve herd immunity soon. As a result, the public will have to be persuaded that reopening is safe. We see a few prerequisites: further declines in confirmed new infections, sufficient hospital and testing capacity, and the ability to trace and quarantine those who might be infected. These look achievable in coming months, but there is much uncertainty about the feasibility of controlling virus spread during reopening.

  • Several other countries have taken steps toward reopening. We see three lessons from their experiences. First, initial reopening timelines often prove too optimistic. Second, even countries at the forefront of reopening have gradual and conservative plans. Third, recovery is easier and quicker in manufacturing and construction than in consumer services.

  • We expect the economy to begin improving in coming months, with the peak virus hit fading thanks to partial relaxation of shutdown orders, adaptation to social distancing, and wider antibody testing to identify those who are now immune. While longer-lasting economic damage that delays the recovery is possible, so far the news has been mostly reassuring: most layoffs appear to be temporary and there has been no major uptick in bankruptcies at this early stage.

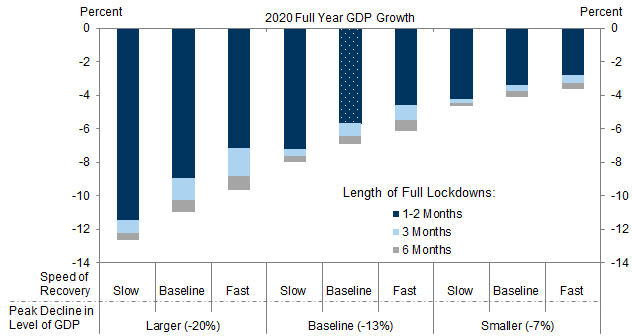
  • The growth path depends on the depth of the hit, the length of lockdown, and the pace of recovery. We estimate a 25% peak hit to manufacturing, a 30% hit to construction, a 60% hit to broker fees and home improvements, and a 14% hit to consumer services, with manufacturing and construction recovering more quickly. Our GDP growth forecast remains a quarterly annualized rate of -7% in Q1, -34% in Q2, +19% in Q3, and +12% in Q4, implying an annual average rate of -5.7% in 2020. We see both upside and downside risks to our forecast.

Reopening the Economy

The US is now largely in lockdown mode and social distancing has increased nationwide. Our US Lockdown Index—a measure of the GDP-weighted share of the country that has shut schools, closed non-essential businesses, and issued stay-at-home orders—has now reached 86%, as shown in Exhibit 1. Virus fears and lockdown orders have led to much greater social distancing, with roughly 50% declines in the share of time spent at workplaces and retail stores and a 25% increase in time spent at home.

Exhibit 1: Most of the US Is Now in Lockdown Mode and Social Distancing Has Increased Nationwide

1. Most of the US Is Now in Lockdown Mode and Social Distancing Has Increased Nationwide. Data available on request.
Source: National Governors Association, University of Washington IMHE, Google, Goldman Sachs Global Investment Research
Relative to the lockdown measures in place in other major economies, current US measures are slightly less tight than average, according to an index developed by researchers at the University of Oxford. Exhibit 2 shows that the US response is currently much less stringent than in Italy, France, and Spain, but more stringent than in Sweden or China.[1]

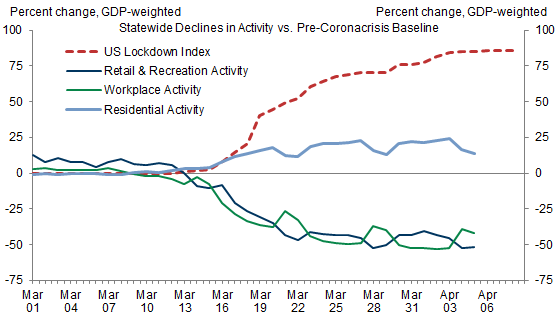
Exhibit 2: Current US Lockdown Measures Are in the Middle of the Pack in Terms of Stringency

2. Current US Lockdown Measures Are in the Middle of the Pack in Terms of Stringency. Data available on request.
Source: University of Oxford, Goldman Sachs Global Investment Research
The timing of reopening depends first and foremost on controlling the virus. How far are we from reaching that point? In a survey last week, a panel of experts on infectious disease modeling predicted that the peak rate of COVID-19 hospitalizations is most likely to be reached this month or in May, though they assigned a probability of only slightly under 50% to a later peak, as shown in Exhibit 3. Reducing the spread to a comfortable level would then take at least a few weeks after that point.

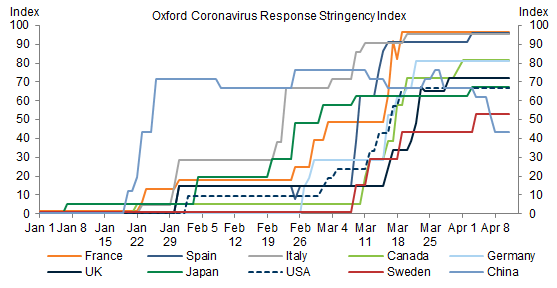
Exhibit 3: Experts on Infectious Disease Modeling Expect Peak Hospitalization in April or May

3. Experts on Infectious Disease Modeling Expect Peak Hospitalization in April or May. Data available on request.
Source: UMass Amherst, Goldman Sachs Global Investment Research
The latest data on the pace of virus spread are encouraging, suggesting that lockdowns have paid large dividends. The count of confirmed new COVID-19 cases has plateaued and perhaps even begun to decline, as shown in Exhibit 4. Our model of the outbreak in the short run—based on a time series analysis using an international panel of case counts—projects a decline in the growth rate of active cases over the next week, in line with the experiences of countries further along in their lockdown timelines.
Measures of virus spread based on big data are even more encouraging and suggest that the true number of new cases actually peaked a while ago, as shown in Exhibit 4. Data from Kinsa that aggregate readings from web-linked thermometers show that the nationwide rate of influenza-like illness is now well below normal seasonal patterns. In addition, Google searches for “loss of smell”—a symptom that has proven an effective way to track the virus spread[2]—have fallen to roughly one-seventh of their peak US level. These measures appear to lead the official count of cases confirmed by testing by 2-3 weeks.

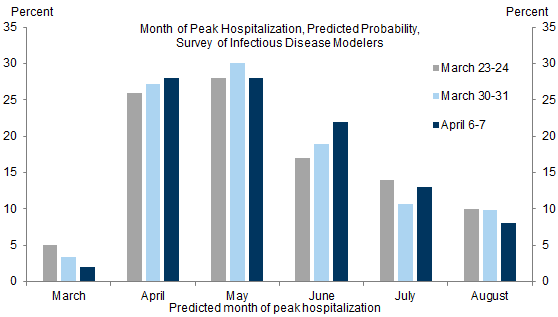
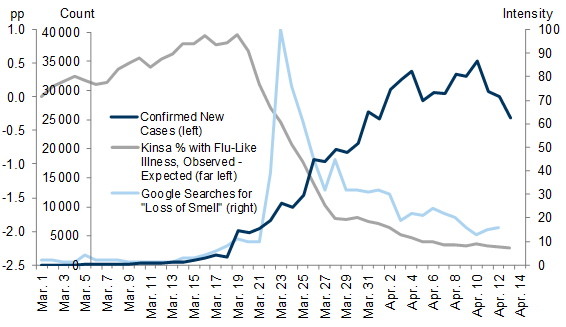
Exhibit 4: The Count of New Cases Confirmed by Testing Has Plateaued, and Big Data Measures Suggest the True Number of New Cases Has Been Falling Sharply for a While

4. The Count of New Cases Confirmed by Testing Has Plateaued, and Big Data Measures Suggest the True Number of New Cases Has Been Falling Sharply for a While. Data available on request.
Source: Johns Hopkins University, Kinsa, Google, Goldman Sachs Global Investment Research

What Will Reopening Look Like?

Absent a vaccine or scalable treatment breakthrough,[3] reopening will have to remain gradual.
There has been some enthusiasm recently about the possibility that far more people than initially believed have been infected but have remained asymptomatic or uncounted for lack of testing. While some hope that this means that “herd immunity” could be close at hand, this appears unlikely. New evidence from full population or random sample testing summarized in Exhibit 5 suggests that the share of the population that has been infected is indeed likely much higher than case counts confirmed by testing imply. But it still appears to be well below the level required for herd immunity—perhaps half of the population. Having already chosen to lock down, governments are very likely to discourage the rapid virus spread required to reach that threshold quickly because of the associated traumatic public health consequences. Moreover, while experience with past coronaviruses suggests that people who are infected will likely have at least some period of immunity, much remains unknown about immunity to Covid-19.[4]

Exhibit 5: Full Population and Random Sample Testing Suggests the Infected Share of the Population Is Higher Than Official Case Counts Imply, but Still Too Low to Achieve Herd Immunity Anytime Soon

5. Full Population and Random Sample Testing Suggests the Infected Share of the Population Is Higher Than Official Case Counts Imply, but Still Too Low to Achieve Herd Immunity Anytime Soon. Data available on request.
Source: Goldman Sachs Global Investment Research
Because of the risk of renewed virus spread, the public will have to be persuaded that any plan for partial reopening is safe. After all, as we recently showed, most of the increase in social distancing in the US has been a voluntary reaction to virus fears, not a response to government lockdown orders.
We see a few prerequisites for reopening: further declines in confirmed new infections, some excess capacity in hospital systems, greater ability to test large numbers of people quickly, and the ability to trace[5] and quarantine those who have come into contact with infected people in order to control future outbreaks. These goals look achievable in the US in coming months, though there is still great uncertainty about the feasibility of controlling virus spread during reopening.
Once those conditions are met, reopening is likely to begin with a very gradual relaxation of lockdown measures. Because the initial spread was slowed by social distancing, the US will have to reverse course very cautiously to avoid a second wave of virus spread. The speed of reopening is likely to vary across the country based on local conditions such as virus prevalence and healthcare capacity.
Many possible adjustments to office and factory work arrangements, commercial activity, and social life can help to reduce the risk of virus spread as reopening gets underway. The middle column of Exhibit 6 highlights some options. Adjustments such as the use of masks, hand-washing, more frequent deep cleaning, routine health checks, maintaining physical distancing, and limitations on gatherings might apply to most areas of public life. Reduced density could be achieved through staggered shifts at work sites or lower capacity limits on public transit or at restaurants and other commercial and cultural locations. And life might reopen to a different degree for different groups, with those who are immune returning first, while those most at risk continue to limit social interactions until a vaccine is available.

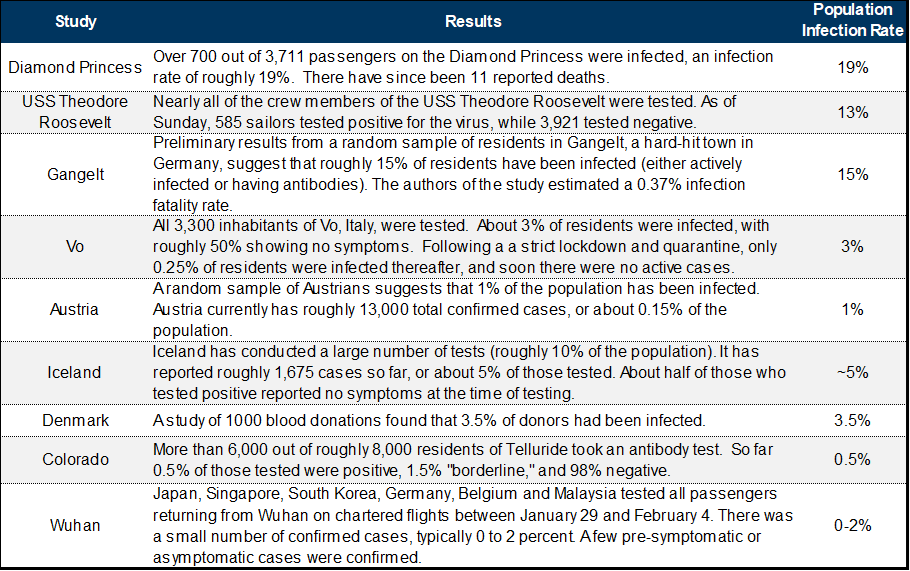
Exhibit 6: Partial Reopening Will Require a Number of Changes to Work, Commercial, and Social Life

6. Partial Reopening Will Require a Number of Changes to Work, Commercial, and Social Life. Data available on request.
Source: Goldman Sachs Global Investment Research
We see two possible approaches to the order of reopening.
The optimal approach might start with activities whose reopening offers maximum economic benefit for a given “cost” of virus risk, with total permitted activity constrained to a level that keeps virus spread under control.[6] In practice, measuring this might be difficult. Our Asia economics team found that closings of workplaces and public transport and cancellation of public events show the greatest cross-country correlation with service-sector activity, while restrictions on internal and international travel appear to matter less. But estimating the “cost,” virus transmission risk, might be more challenging. One implication of this approach is that economic activity that can be conducted nearly as well from home as from a work or commercial site should generally come later in the reopening order.[7]
The natural approach might instead proceed from the safest activities to the most dangerous, as people initially limit their out-of-home activities to those with the least risk of infection. Exhibit 7 illustrates how this might look from an occupational perspective. The exhibit ranks occupations from left to right based on how much physical proximity to others they require according to occupational survey data.
Absent strong government intervention, the actual path of reopening is likely to fall somewhere in between these two approaches. While the first approach might be optimal from a centrally organized perspective, the private economy would not necessarily arrive at that approach on its own because of incomplete information about virus risk and a failure of businesses and individuals to account for the virus transmission externalities of their own activities.

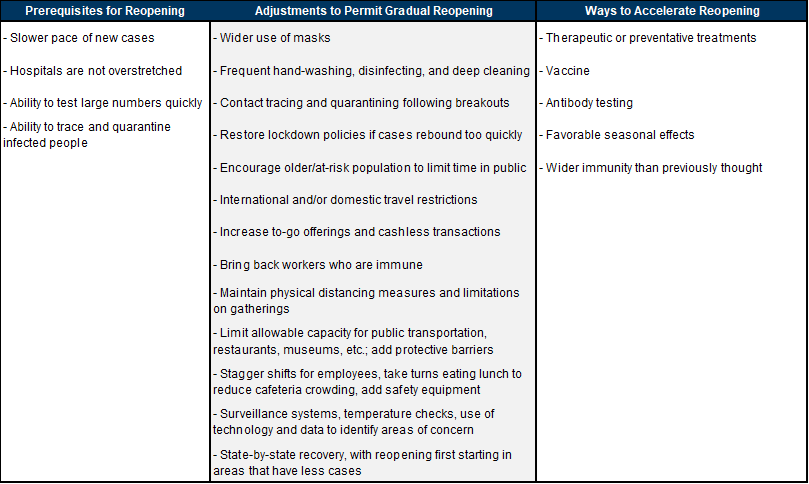
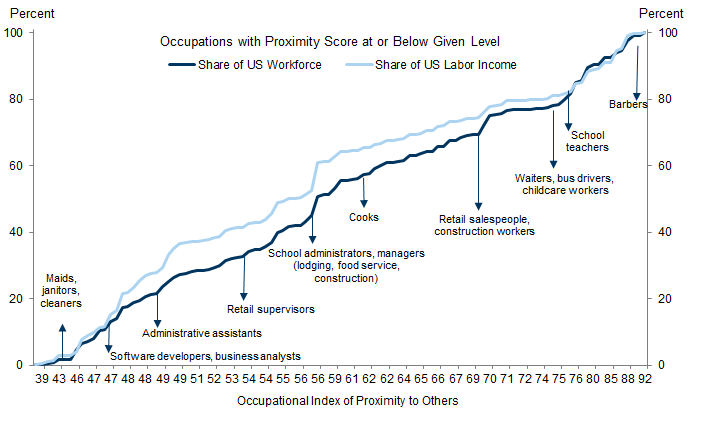
Exhibit 7: Jobs and Activities That Require Less Physical Proximity to Others Will Likely Reopen Sooner

7. Jobs and Activities That Require Less Physical Proximity to Others Will Likely Reopen Sooner. Data available on request.
Source: Federal Reserve Bank of St. Louis, Goldman Sachs Global Investment Research

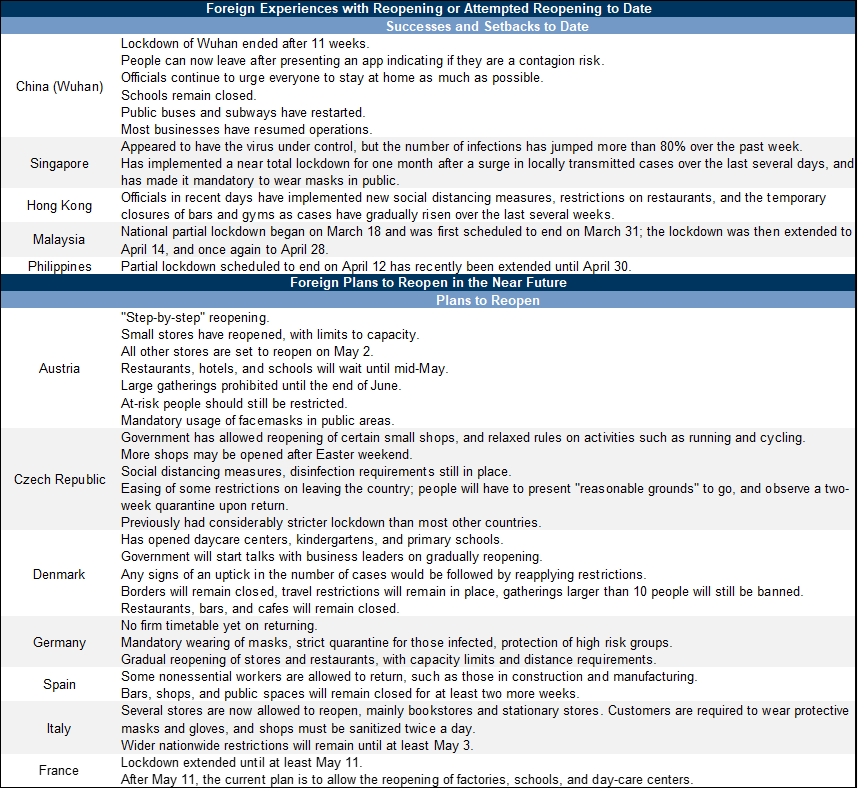
Lessons from Foreign Experience with Reopening

Several countries have already started the process of gradually reopening their economies from virus lockdowns or have announced plans to start soon. These foreign experiences provide a glimpse of what reopening might look like in the US.
We look first at China, which is furthest along in the reopening process. The majority of provinces in China have now lowered emergency response levels, including Hubei province, the epicenter of the initial outbreak. However, precautionary measures remain in place, such as temperature checks at workplaces and restrictions on movement based on health status.
Industrial activity in China has recovered significantly as virus control measures have eased, with our Coronavirus China Industrial Activity Tracker now down just 8% compared to the year-ago level. Consumer activity has also rebounded quickly, though the level remains weaker, with our China Consumer Activity Tracker still 25% below the year-ago level (Exhibit 8) and spending on consumer discretionary categories particularly weak. We expect the US to exhibit similar patterns, with a quicker pace of recovery in manufacturing than in consumer services. However, we expect a slower overall pace of recovery in the US than in China because the US has a less manufacturing-focused economy, virus control is likely to be less thorough, and the reopening process will be less centrally directed.

Exhibit 8: Industrial Activity in China Is Closer to Recovering than Consumer Activity

8. Industrial Activity in China Is Closer to Recovering than Consumer Activity. Data available on request.
Source: Goldman Sachs Global Investment Research
Other countries in Asia have imposed or extended lockdowns and enforced social distancing. Malaysia, the Philippines, and India recently extended lockdowns, and Singapore and Japan recently escalated their response to the virus due to spikes in infections, as noted in Exhibit 9. Most places have moved to more stringent policies over time, and those with relatively low new infection rates, such as Taiwan and South Korea, continue to heavily restrict international travel due to fear of importing new cases.
Several countries in Europe have also announced plans for a very gradual reopening. Denmark, the Czech Republic, Austria, Spain, and Italy have lifted some restrictions, but the vast majority of restrictions remain in place, as described in Exhibit 9. In the US, governors from several East Coast states and governors from several West Coast states have each started joint discussions to plan a reopening, although neither group has provided public guidance on a timeline or a reopening plan thus far.

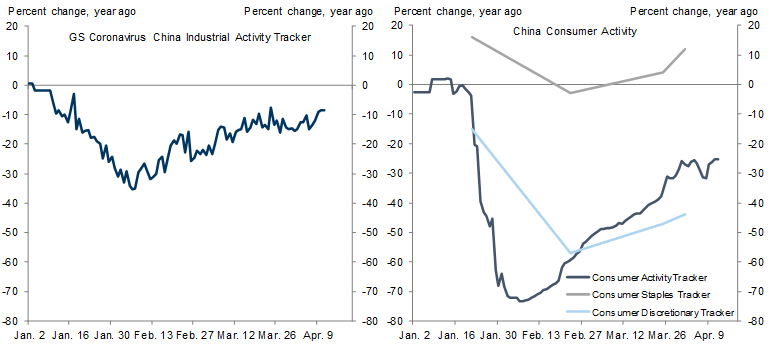
Exhibit 9: Many Regions Have Encountered Setbacks or Pushed Back the Date of Reopening

9. Many Regions Have Encountered Setbacks or Pushed Back the Date of Reopening. Data available on request.
Source: Goldman Sachs Global Investment Research
Foreign experience offers three key lessons for the US. First, initial reopening timelines often prove too optimistic, and changes to initial plans have so far instead mostly involved moving toward more stringent restrictions and longer lockdowns. Second, even countries at the forefront of reopening have gradual and conservative plans. Third, recovery is quicker in manufacturing than in consumer services.

The Economic Recovery: A Scenario Analysis

We conclude by looking at what various paths for reopening would mean for the growth outlook.
We strongly expect the economy to begin to recover from the current bottom over the next few months as the peak virus hit fades thanks to partial relaxation of shutdown orders, adaptation to social distancing, and wider antibody testing to identify those who are now immune. While longer-lasting economic damage that delays the recovery is possible, so far the news has been mostly reassuring. On the labor market side, most layoffs have been temporary, meaning that most employer-employee relationships remain intact. On the business side, there has been no major uptick in bankruptcies so far. Admittedly, it is still very early to know how both concerns will evolve in coming months.
The quarterly growth path largely depends on three key parameters: the depth of the peak decline, the length of lockdown, and the speed of recovery during the reopening process. We estimate a 25% peak hit in April to manufacturing, a 30% hit to construction, a 60% hit to brokerage fees and home improvements, and a 14% hit to consumer services. We assume that the recovery starts in May and June and thereafter proceeds at a gradual pace, with the manufacturing and construction drag fading by 15% each month, and the drag from services activity fading by 12.5% each month.
Our baseline forecast for GDP growth continues to put the quarterly annualized pace at -7% in Q1, -34% in Q2, +19% in Q3, and +12% in Q4. This implies 2020 growth of -5.7% on an annual average basis and -4.9% on a Q4/Q4 basis.
The last three charts compare our baseline forecast to plausible upside and downside scenarios in which the initial peak decline in GDP is either smaller or larger, the time spent in lockdown (during which we assume the recovery rate is halved) is longer, and the pace of recovery is either slower or faster.
An upside scenario could involve greater progress on treatment, much slower spread in warmer weather, or more effective adaptation that makes social distancing measures less economically costly. A widely available vaccine would likely lead to an even sharper recovery of economic activity, but appears unlikely in the near future.
A downside scenario could involve a slower decline in the number of new infections, longer lockdowns, a second wave of infections that results in an oscillation between easing and tightening restrictions, larger second-round income effects, and more persistent avoidance of face-to-face interactions.
Exhibit 10 shows both the level (above) and growth rate (below) of output under our baseline assumptions and in an upside and a downside scenario. Specifically, we consider an upside case with a 7% peak hit to activity (vs. 13% in our baseline) and a downside case with both a 20% peak hit to activity and a lockdown that lasts for 6 months. The top chart shows the level of output for each scenario as a range corresponding to different recovery rates, from a very slow recovery in which the virus hit decays at a 5% monthly pace for manufacturing, construction, and services, to a faster recovery in which the hit decays at a 25% pace for manufacturing and construction and a 20% pace for services. The bottom chart shows the implied quarterly growth rates for each scenario, assuming the baseline recovery rate.

Exhibit 10: We See Both Upside and Downside Risks to Our Baseline Path

10. We See Both Upside and Downside Risks to Our Baseline Path. Data available on request.
Source: Goldman Sachs Global Investment Research
Exhibit 11 shows what an even broader range of scenarios that vary all three key parameters would imply for 2020 growth. In the most extreme cases shown on the left, the growth hit could reach double-digits. In the most optimistic case shown on the right, even a relatively small peak hit to activity, a 1-2 month lockdown, and a fast recovery would suggest 2020 growth of -3.3%, which would still be the lowest full-year pace since 1946. While we see both upside and downside risks to our baseline path, the numerical risks to full-year growth in 2020 skew downward.

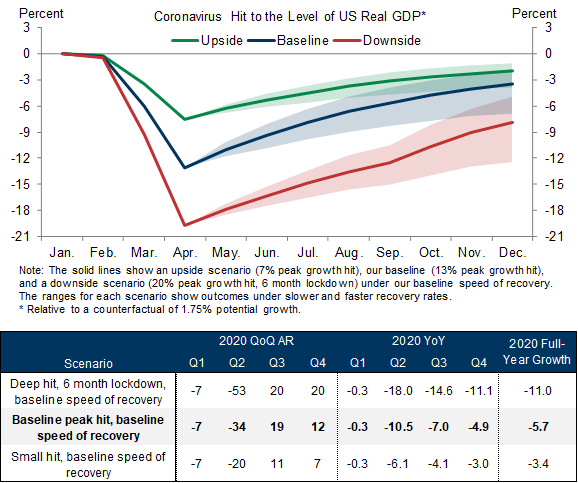
Exhibit 11: 2020 Growth Depends on the Peak Decline, the Length of Lockdown, and the Speed of Recovery

11. 2020 Growth Depends on the Peak Decline, the Length of Lockdown, and the Speed of Recovery. Data available on request.
Source: Goldman Sachs Global Investment Research

David Choi

David Mericle

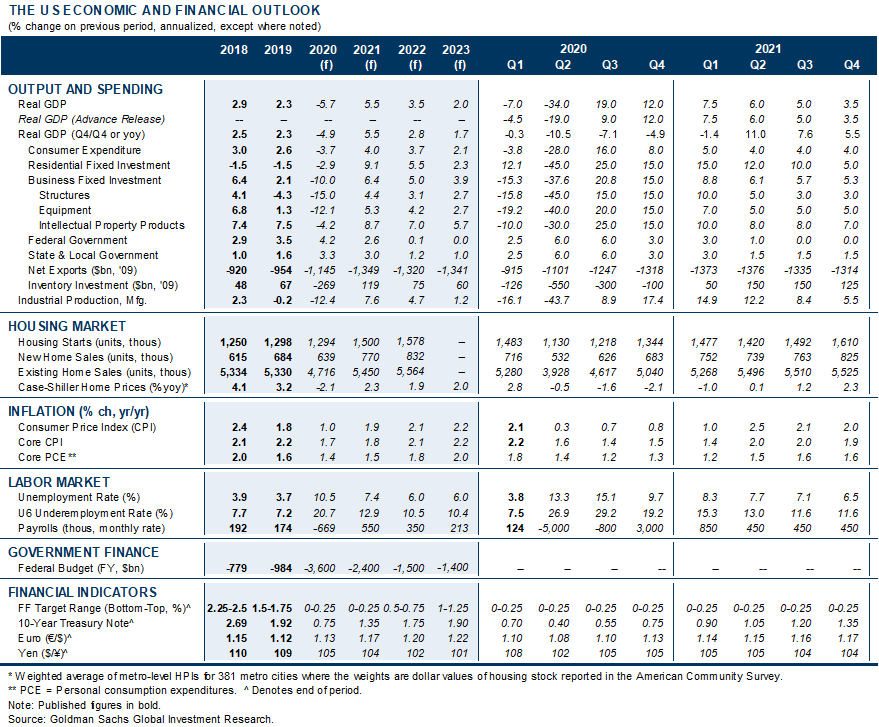
The US Economic and Financial Outlook

Forecast Changes

We raised our Q1 GDP forecast from -9% to -7%. We estimate an even smaller decline of -4.5% in the advance reading of Q1 GDP on April 29th, with the wedge between the two forecasts reflecting non-response bias (the hardest hit firms are less likely to respond to the surveys) and incomplete source data. We expect downward revisions to some of these data in coming months.

Data available on request.
Source: Goldman Sachs Global Investment Research
  1. 1 ^ See https://www.bsg.ox.ac.uk/research/research-projects/coronavirus-government-response-tracker. We think that this measure understates the severity of the China lockdown for several reasons, most importantly that China did not have any international travel controls in place for most of this time (1/7 of the Oxford index) because there was no fear of international transmission.
  2. 2 ^ Seth Stephens-Davidowitz, “Google Searches Can Help Us Find Emerging Covid-19 Outbreaks,” The New York Times, April 5, 2020.
  3. 3 ^ For more on progress on vaccine and treatment development, see recent research by our Japan healthcare analysts, Akinori Ueda and George Zhou, “COVID-19 FAQ: Strong interest in progress on treatment/vaccine development, product positioning,” April 11, 2020.
  4. 4 ^ Marc Lipsitch, “Who Is Immune to the Coronavirus?” New York Times, April 13, 2020.
  5. 5 ^ A challenge in the US is balancing tracing contact between people with privacy concerns. A cell phone app developed by mathematicians, NOVID, anonymously traces virus exposure by using Bluetooth radio waves and ultrasonic frequencies captured by the microphone to measure the distance between people and later alert people who have been near someone who self-reports as infected. Such technologies could enable the same tracing of potential new infections as more invasive approaches in other countries. See Novid.org.
  6. 6 ^ Eric Budish, “R<1 as an Economic Constraint: Can We ‘Expand the Frontier’ in the Fight Against Covid-19?” April 1, 2020.
  7. 7 ^ For examples see Jonathan Dingel and Brent Neiman, “How Many Jobs Can Be Done at Home?” March 26, 2020.

Investors should consider this report as only a single factor in making their investment decision. For Reg AC certification and other important disclosures, see the Disclosure Appendix, or go to www.gs.com/research/hedge.html.