Goldman Sachs Research
Global Economics Analyst
Measuring the Impact of Lockdowns and Social Distancing on Global GDP
26 April 2020 | 11:50PM EDT | Research | Economics| By Jan Hatzius and others
More
  • In today’s note, we combine two prominent measures of lockdowns and social distancing—the Oxford policy stringency index and the Google global mobility reports—into an Effective Lockdown Index (ELI) for every economy under our coverage. Globally, the ELI rose sharply in late March and has been stable since then. Readings are high almost everywhere, with only mainland China on a clear downward trend.

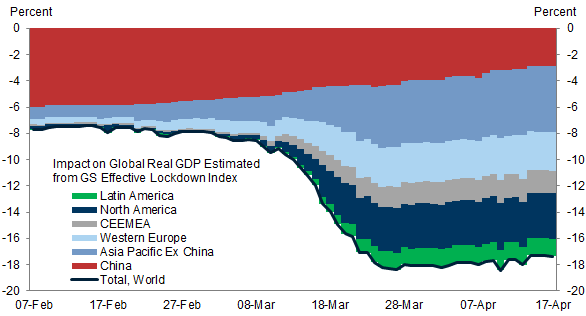
  • On a cross-country basis, the ELI correlates closely with measures of economic activity such as the flash PMIs for April. Building on that link, we use preliminary estimates from statistical agencies in four countries—Canada, China, France and South Korea—to construct an ELI-implied hit to the level of GDP for every economy under our coverage. This hit currently stands at 17% globally; relative to pre-virus trend growth of about 3%, this implies year-on-year GDP growth of -14% as of late April. The impact on growth for Q2 as a whole is likely to be smaller, assuming activity recovers somewhat in coming months.

  • A number of important caveats are in order. First, while combining two different indicators should reduce measurement error, the ELI is likely to be a noisy measure of lockdowns and social distancing. Second, our translation of the ELI into GDP assumes a linear relationship and is based on preliminary estimates from just four countries. Third, we ignore cross-country differences in the GDP weights of activities with large amounts of face-to-face interaction. Fourth, the relationship between the ELI and GDP may change over time as households and firms adapt their behavior and policymakers optimize for the least economically damaging restrictions.

  • The GS ELIs can be downloaded here.

Measuring the Impact of Lockdowns and Social Distancing on Global GDP

Traditional economic data—typically released with significant lags—are starting to provide hints about the extent of the economic impact of the pandemic and associated virus control measures. At the same time, the relaxation of lockdown measures in several regions raises the question of how quickly the economy can recover. In today’s note, we first quantify the extent of lockdowns and social distancing by constructing an Effective Lockdown Index (ELI) for every economy under our coverage, building further on work by our Asia Economics team.[1] We then use official growth estimates to construct an ELI-implied daily hit to the level of global GDP.

Measuring Lockdowns and Social Distancing

To assess the economic impact of virus control policies, we need an objective measure of their "tightness" both across economies and over time. We combine two prominent measures of lockdowns and social distancing—the government response stringency index constructed at Oxford University and the Google global mobility reports—into an Effective Lockdown Index (ELI) which reflects both policy settings and on-the-ground behavior.
The government policy stringency index combines seven policy measures: 1) school closings, 2) workplace closings, 3) public event cancellations, 4) closure of public transportation, 5) public information campaigns, 6) internal movement restrictions and 7) international travel controls for over 73 countries. The daily policy stringency index ranges in value from 0 to 100, with higher values indicating more stringent policy.[2]
To help gauge the actual shift in behavior we also employ daily Google data on smartphone user behavior. For 131 geographies, Google reports the frequency of visits to workplaces, retail centers, public transportation, parks, and residences relative to a baseline period (an average of January 3-February 6). This provides a near-real-time picture of how local populations are responding to the coronavirus threat and policy measures.

Exhibit 1: We Combine the Oxford Policy Stringency Index and Google Mobility Reports into our Effective Lockdown Index (ELI)

1. We Combine the Oxford Policy Stringency Index and Google Mobility Reports into our Effective Lockdown Index (ELI). Data available on request.
Source: University of Oxford, Google, Goldman Sachs Global Investment Research
To construct our “Effective Lockdown Index (ELI)", we equally weight a "virus policy" measure—an adjusted version of the Oxford index—and a "social distancing" measure—a summary of the Google data. We modify the Oxford policy stringency index by replacing the international travel control measure with the measure of contact tracing.[3] With the Google data, we construct an index of the average change in frequency of visits to workplaces, public transportation, and retail centers. Because the Google data are typically released with a few days' lag, we project the missing Google data using the Apple Mobility trends reports.[4] Unfortunately, neither source includes mainland China and hence for China we use urban subway traffic data as proxy for mobility. As Exhibit 1 shows for the US and for India, the policy stringency and Google mobility series correlate well but can be somewhat noisy, which suggests that taking an average can reduce measurement error.[5]
Exhibits 2 illustrates the progression in lockdowns and social distancing for several large economies since early February, using our ELI. Every economy has moved in the direction of greater restrictions over time with high readings almost everywhere, except for mainland China which has begun to loosen on balance since early February.[6] Recent ELI readings are also less elevated in Japan, South Korea, Taiwan and Sweden.

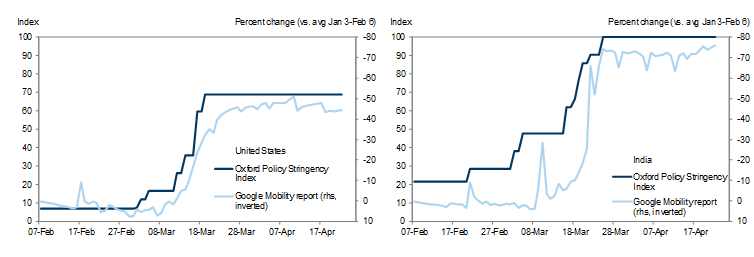
Exhibit 2: Every Economy Has Moved to Greater Restrictions Except for China

2. Every Economy Has Moved to Greater Restrictions Except for China. Data available on request.
Source: Oxford University, Google, Apple , Wind, Goldman Sachs Global Investment Research
Looking across regions, the ELI rose sharply in late March outside of China and has been broadly stable since (Exhibit 3). The highest ELI readings in April have been in Western Europe and CEEMEA.

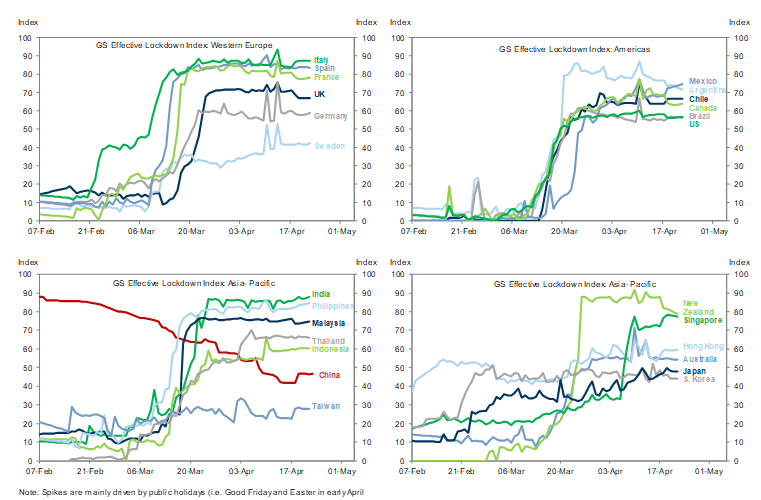
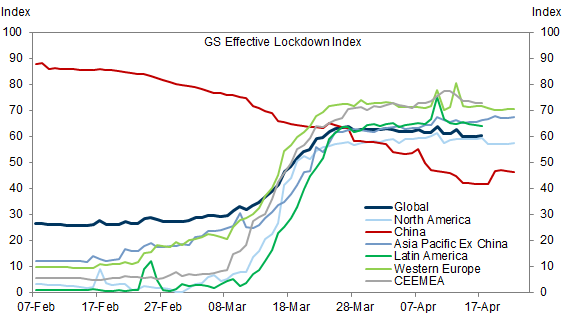
Exhibit 3: The ELI Has Remained Broadly Stable Last Month in Most Regions Except in China

3. The ELI Has Remained Broadly Stable Last Month in Most Regions Except in China. Data available on request.
Source: Oxford University, Google, Apple , Wind, Goldman Sachs Global Investment Research

The Impact of Lockdowns and Social Distancing on Activity

Tighter lockdowns and social distancing mean weaker economic activity, particularly in activities with large amounts of face-to-face interaction. On a cross-country basis, the ELI correlates closely with measures of economic activity such as all the available country-level flash composite PMIs for April, as illustrated in Exhibit 4.

Exhibit 4: Strong Association Between Lockdown Intensity and April PMIs

4. Strong Association Between Lockdown Intensity and April PMIs. Data available on request.
Source: Markit, University of Oxford, Google, Goldman Sachs Global Investment Research
Building on that link, we next use preliminary GDP estimates from statistical agencies in four countries to estimate the relationship between the ELI and GDP:
1. Canada: Statistics Canada estimated that GDP declined by 9% in March in a flash reading using available source programs that cover all industries.[7]
2. China: Using an estimated monthly path for Chinese real activity that adds up to the official -6.8% yoy figure for Q1, we estimate a peak hit to China real domestic demand of 25% in February.
3. France: INSEE estimated a 35% hit to GDP for the last week of March and continues to estimate a 35% hit for the third week of April using both traditional and alternate data for 135 subindustries.[8]
4. South Korea: Based on the official Q1 GDP report and available monthly data, we estimate an 8% hit to private final domestic demand in March, driven by weak consumption.
Exhibit 5 plots these hits to activity versus the value of each country's ELI over that period. Assuming no lockdown and social distancing means no impact, we then draw lines from the origin to each of those 4 points. The slope of the lines represents the implied sensitivity of economic activity to the ELI. The slopes range from -0.18 to -0.41; putting equal weight on each of the four data points, the average is -0.29 (Exhibit 6). We use this parameter to convert each economy's ELI value into the impact on GDP.

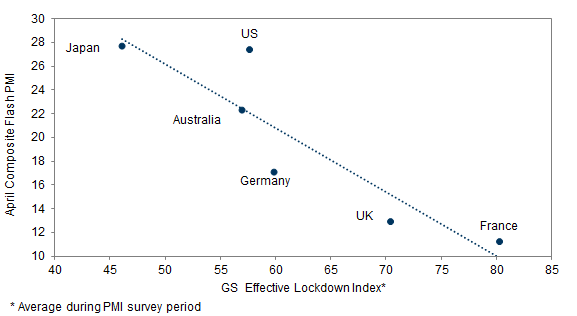
Exhibit 5: Association Between Lockdown Intensity and Official Growth Estimates

5. Association Between Lockdown Intensity and Official Growth Estimates. Data available on request.
Source: Goldman Sachs Global Investment Research

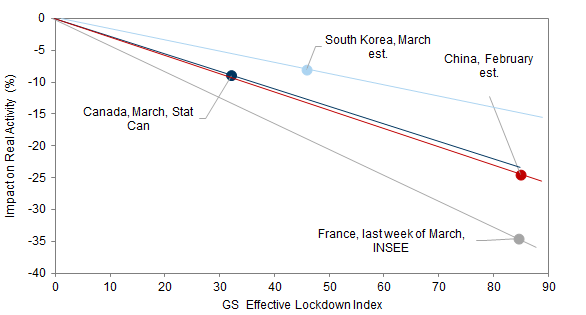
Exhibit 6: Official Estimates Suggest that a 10-Unit Tightening in the GS ELI Reduces GDP by 2.9% on Average

6. Official Estimates Suggest that a 10-Unit Tightening in the GS ELI Reduces GDP by 2.9% on Average. Data available on request.
Source: Goldman Sachs Global Investment Research
Our estimate of the ELI-implied peak hit to the level of GDP for the largest economies is shown in Exhibit 7. Italy, India, China and Spain have the largest impacts of around 25% with peak ELI values of above 85. On the low end, we estimate a peak hit to output in Japan of less than 15%, reflecting its relatively targeted approach to dealing with the virus.

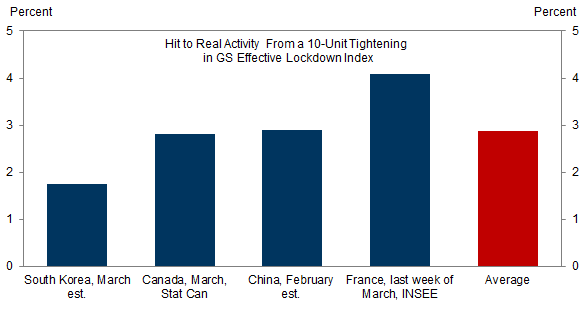
Exhibit 7: We Estimate Peak Monthly Hits to Output in a 15-25% Range

7. We Estimate Peak Monthly Hits to Output in a 15-25% Range. Data available on request.
Source: Goldman Sachs Global Investment Research
Exhibit 8 presents our estimate of the ELI-implied hit to the level of global GDP, which currently stands at 17%, down only slightly from the 18% peak in late March. Relative to pre-virus trend growth of about 3%, this implies year-on-year GDP growth of -14% as of late April. The impact on growth for Q2 as a whole is likely to be smaller, assuming activity recovers somewhat in coming months.

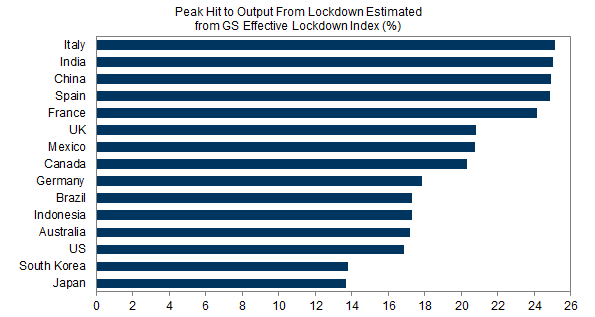
Exhibit 8: Our ELI-implied Hit to Global GDP Now Stands at 17%

8. Our ELI-implied Hit to Global GDP Now Stands at 17%. Data available on request.
Source: Goldman Sachs Global Investment Research

Caution

A number of important caveats are in order. First, while combining two different indicators should reduce measurement error, the ELI is likely to be a noisy measure of lockdowns and social distancing. Second, our translation of the ELI into GDP assumes a linear relationship and is based on preliminary estimates from just four countries.[9] The estimated relationship is therefore set to change as new official growth estimates become available. Third, we ignore cross-country differences in the GDP weights of activities with a high ELI-sensitivity such as services requiring face-to-face interaction or travel and of activities with a low sensitivity, including food production or owner-occupied housing services. Fourth, the ELI-sensitivity of GDP may decline over time as households and firms adapt their behavior and policymakers optimize for the least economically damaging restrictions.

Daan Struyven

Andrew Tilton

Jan Hatzius

  1. 1 ^ See Andrew Tilton, “Lockdown lexicon—virus control strategies and their economic implications”, Asia Economics Analyst, April 15, 2020.
  2. 2 ^ For more details, see Hale, Thomas, Sam Webster, Anna Petherick, Toby Phillips, and Beatriz Kira (2020). Oxford COVID-19 Government Response Tracker, Blavatnik School of Government.
  3. 3 ^ International restrictions should not affect domestic behavior much while contact tracing is a labor-intensive effort that involves health officials contacting a large number of potentially affected individuals.
  4. 4 ^ The projections are based on regressions of the daily change in the Google measure on the (7-day moving average) daily change in the Apple measure and weekend effects. For a few countries, we also use projections from regressing the Google level on the Apple level.
  5. 5 ^ For a detailed analysis of lockdown policies at the US state- and country level, see Blake Taylor, “Measuring Lockdown: State Orders, Economic Activity, and Social Distancing Across the US”, US Economics Analyst, April 12, 2020.
  6. 6 ^ The decline in China’s ELI is a result both of easing in the Oxford policy variables and of an increase in our mobility proxy.
  7. 7 ^ Stat Can notes the hardest hits in travel, tourism, personal transportation, restaurants, accommodation, personal services, non-food retailing, entertainment and sporting events, and movies exhibition.
  8. 8 ^ While the construction and manufacturing sectors have recovered slightly, the hits remain very large in manufacturing of transportation goods and electric equipment, construction, hotels and restaurants, transportation- and retail services.
  9. 9 ^ If the ELI were at 100 and if there was literally no movement to public transportation, workplaces or retail areas, jobs involving any physical actions would likely not happen and GDP would likely decline by more than 28%. The BLS and academic studies estimate that 30-35% of the US jobs can be done from home.

Investors should consider this report as only a single factor in making their investment decision. For Reg AC certification and other important disclosures, see the Disclosure Appendix, or go to www.gs.com/research/hedge.html.