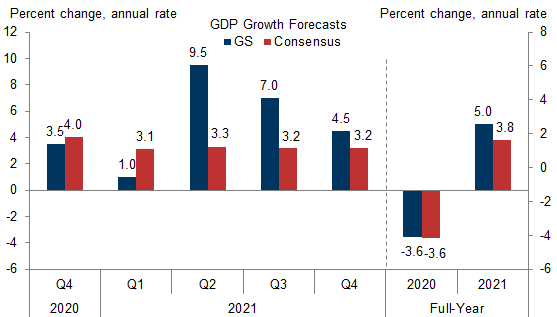
We retain high conviction in our arguments for above-consensus GDP growth in 2021 and 2022. However, the rapid and broad-based resurgence of the coronavirus has led us to downgrade our Q4 and Q1 GDP forecasts. We now expect +3.5% and +1.0% annualized growth in Q4 and Q1 (qoq ar, respectively, vs. +4.5% and +3.5% previously).
The larger drag in the winter should imply an even larger reacceleration on the back of mass immunization. We have thus increased our Q2 and Q3 growth forecasts to +9.5% and +7.0%, respectively (vs. +7.0% and +6.0% previously), leaving the end-2021 level of output unchanged. Our new growth path implies 2021 GDP growth of +5.0% (vs. +5.3% previously) on a full-year basis, still well above consensus expectations, and +5.5% (vs. +5.2% previously) on a Q4/Q4 basis.
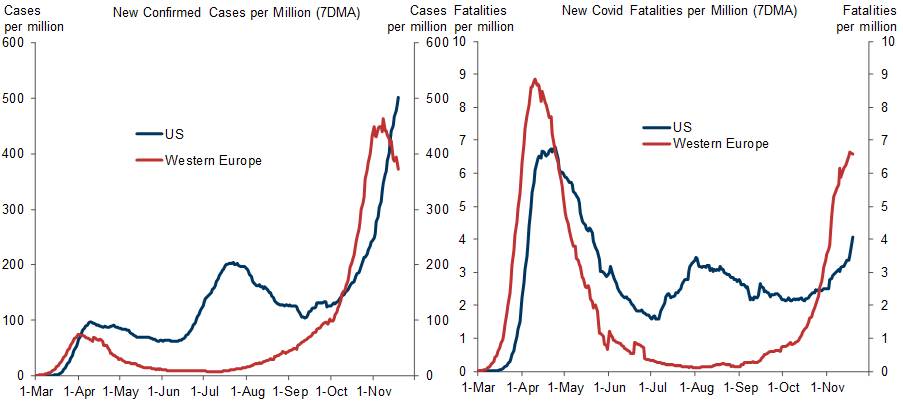
Timely data in virus-sensitive industries show clear signs of a growing hit from the virus resurgence. State and local restrictions have also ramped up over the last week, although they remain well short of measures taken earlier this year and more recently in Europe.
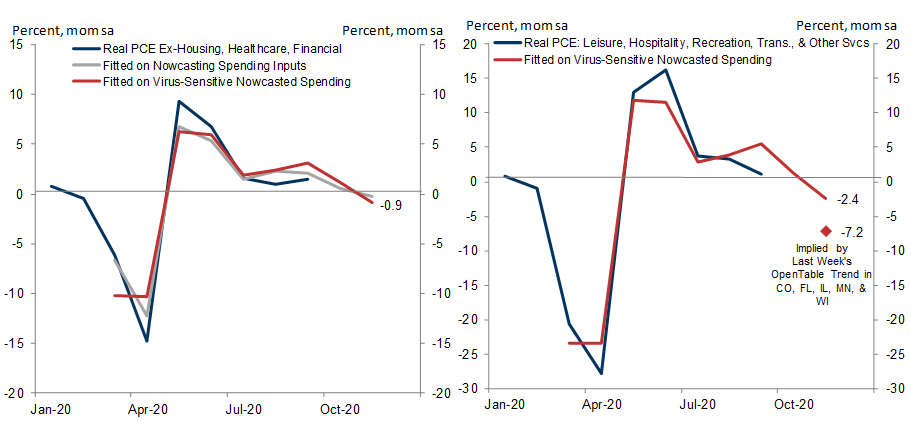
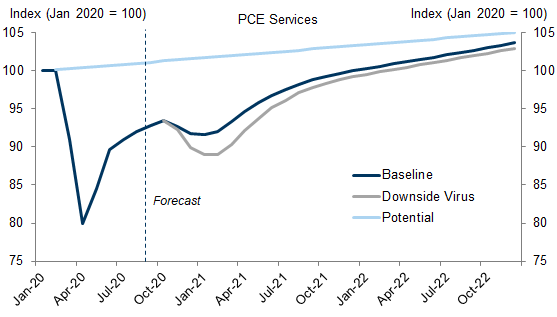
The policy and consumer spending responses will likely vary substantially by state and region. We expect the largest hit in the Northeast, where lower temperatures will likely mean a larger virus headwind and where policymakers have indicated more willingness to impose restrictions, and the smallest hit in the South. We expect sequential declines in consumer services spending over November through January, and now see -1.0% annualized real consumption growth in Q1.
Our expectation for a winter soft patch also reflects a drag from the reversal of record 2020 election spending and October Amazon Prime Day sales. Together, we expect these two headwinds to lower Q1 growth by 0.5pp.
The virus situation and fiscal negotiations present the two largest near-term downside risks. Failure to reach a fiscal agreement by the end of Q1 or widespread and more stringent virus restrictions could lead to outright contraction in Q1.
We previously noted that the FOMC was most likely to extend the average maturity of asset purchases if the economy weakened. The weaker winter conditions in our revised forecast likely meet the bar, and we therefore now expect a maturity extension at the December meeting alongside the introduction of a timeline for asset purchases.
Winter Growth Update: Darker Before Dawn
Exhibit 1: New Virus Cases and Deaths Have Surged
A Sudden Slowdown in November
Exhibit 2: Restaurant Activity Has Fallen in the First Half of November, Particularly in the States with a Sharper Virus Surge
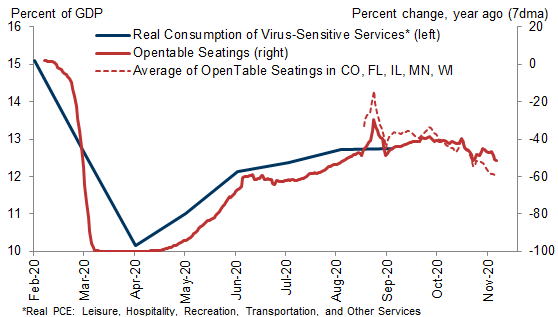
Exhibit 3: Temporary Closures of Consumer-Facing Small Businesses Are Back at May Levels
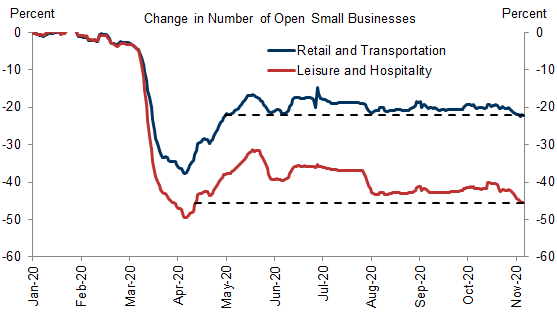
Exhibit 4: Spending Trends in the First Two Weeks of November Are Already Consistent with Declining Consumption, Particularly in Virus-Sensitive Categories
A Larger Virus Hit to Come
Exhibit 5: Temperatures Are Expected to Fall Further, Especially in the Midwest and Northeast
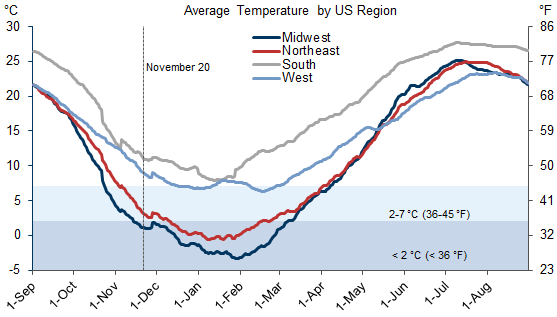
Exhibit 6: We Expect Services Activity to Contract Over November through January
Q4, Q1, and Downside Risks
Exhibit 7: Payback from Record Election Spending and Amazon Prime Day to Reduce Q1 Growth by 0.5pp (and Dampen Sequential Growth in Nov/Dec)
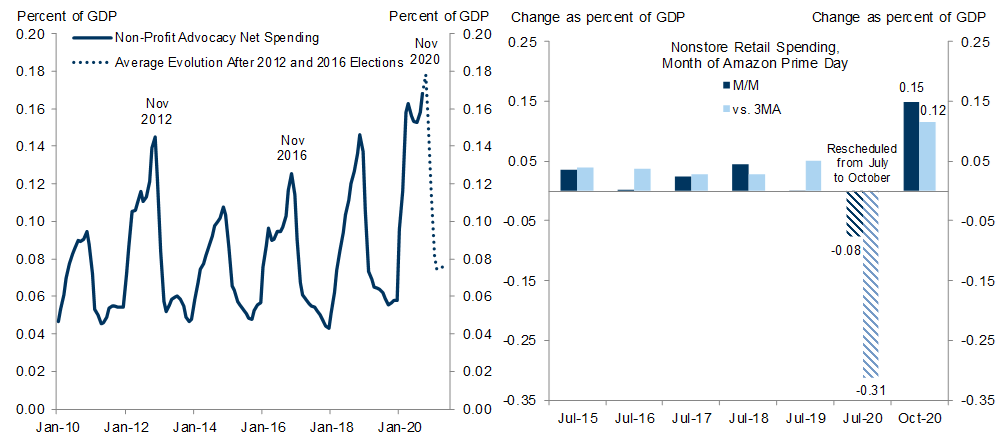
Exhibit 8: The Virus and the Potential for No Fiscal Deal Present Significant Downside Risks to Q1 Growth
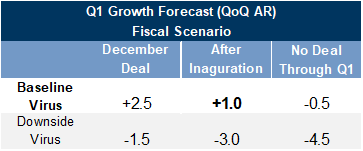
Exhibit 9: A Colder Winter, A Hotter Spring: GS Growth Forecast vs. Consensus
Fed Implications
David Choi
Spencer Hill
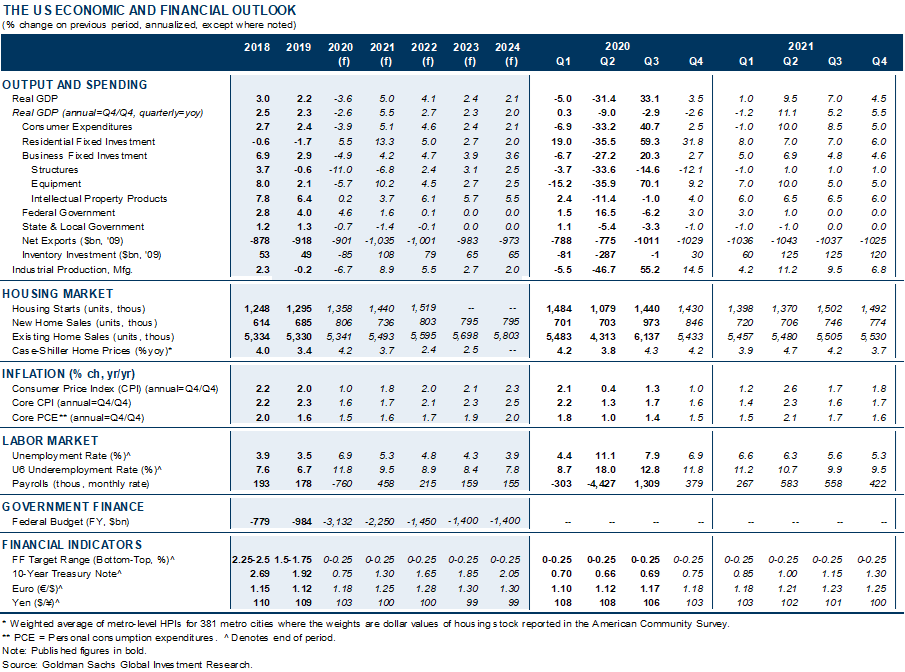
The US Economic and Financial Outlook
Forecast Changes
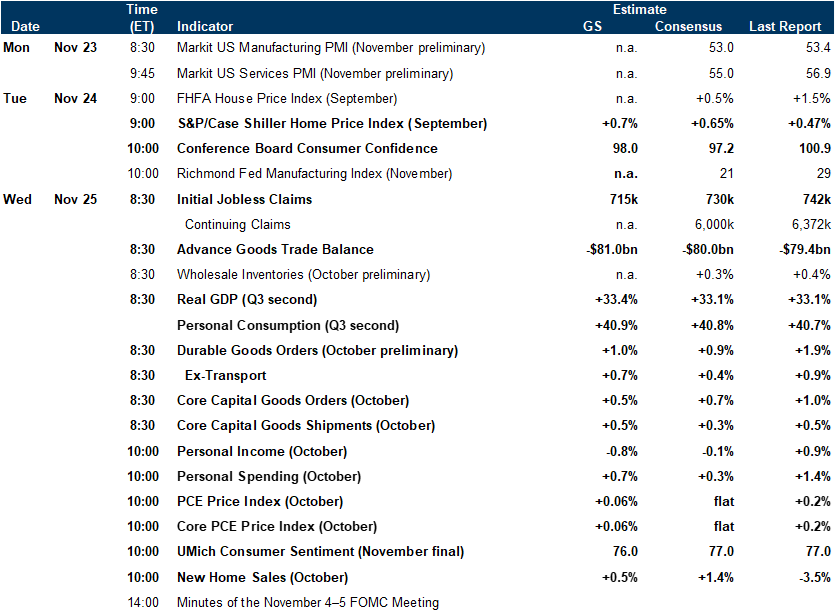
Economic Releases
- 1 ^ October consumer activity data—while still relevant from a Q4 GDP perspective—are likely too stale to cast light on the consumer response to the third wave of the virus.
- 2 ^ For example, consumption of housing and financial services may not be particularly sensitive to the virus.
- 3 ^ The resulting seven signals exhibit an average correlation of +0.92 with the official measure of consumption growth (mom sa, real basis; excludes housing, healthcare and financial services and comprises 60% of total consumer spending).
- 4 ^ While the recertification of the Boeing 737 MAX is a positive growth development, the likely gradual ramp-up of production suggests the return of that 0.3% of GDP may take several years—implying an annualized impact on Q1 growth of only a couple tenths.
Investors should consider this report as only a single factor in making their investment decision. For Reg AC certification and other important disclosures, see the Disclosure Appendix, or go to www.gs.com/research/hedge.html.