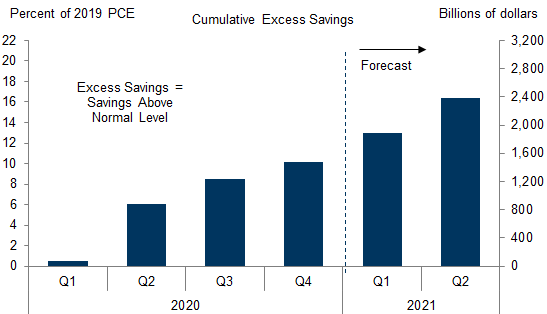
Fiscal support has kept disposable income high during the pandemic, but consumption has remained depressed because many normal spending opportunities have been unavailable. The result is that households have accumulated about $1.5tn in “excess” or “forced” savings, and we expect that to rise to about $2.4tn, or 11% of GDP, by the time that normal economic life is restored around mid-year. Whether households spend a modest or large share of these pent-up savings as the economy fully reopens could be the difference between a healthy recovery and overheating.
Statistical models of consumer spending imply that households consume most of their current income but only a few cents per dollar of their wealth. The propensity to consume out of excess savings surely lies in between those two extremes, but it is hard to know exactly where. Unfortunately, the era of modern economic statistics offers little useful precedent.
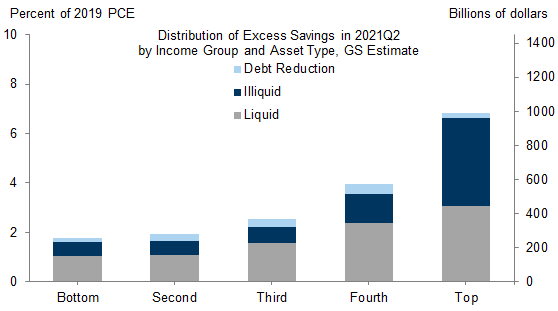
To gain insight into the share of excess savings that might be spent, we first estimate the shares of the excess savings held by different income groups and the form in which they hold them. We estimate that about 40% of the excess savings are held by the top quintile of the income distribution, while only about 20% are held by the bottom two quintiles combined. We further estimate that about 10% of the excess savings have been used to pay down debt, 40% have been used to buy illiquid assets, and 50% sit in the more liquid form of bank deposit accounts.
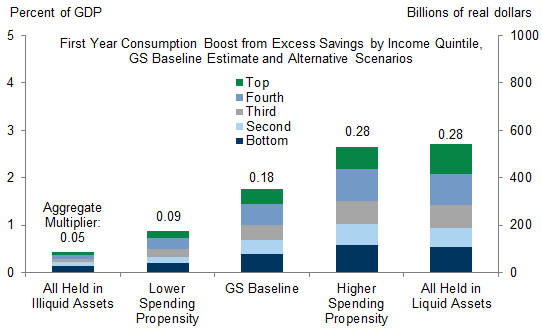
We use our estimates of the distribution of excess savings to forecast the share that will be consumed when normal spending opportunities return. We assume, for example, that most excess savings held in bank deposit accounts by low-income households will be spent, while only a tiny share of excess savings invested in illiquid assets by high-income households will be spent.
Our baseline estimates imply that a bit less than 20% of the excess savings will be spent in the first year after reopening, contributing roughly 2pp to GDP growth. But the uncertainty is high, and we think the impact could plausibly turn out to be anywhere from 1pp to 3pp.
Pent-Up Savings and Post-Pandemic Spending
Exhibit 1: We Expect Excess Savings to Total 16% of Annual Consumption (or 11% of GDP) by Mid-Year
Who Saved During the Pandemic?
Exhibit 2: To Estimate The Distribution of Excess Savings, We First Estimate Income by Quintile

Exhibit 3: We Then Estimate Consumption for Each Income Quintile
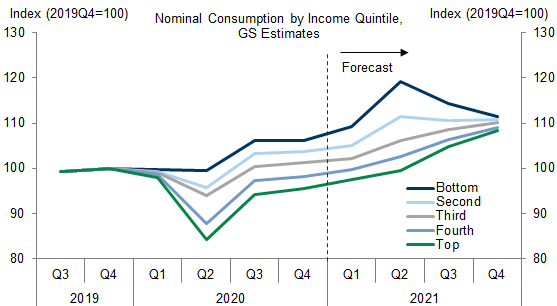
Exhibit 4: We Forecast That the Top Income Quintile Will Hold About 40% of the Total Excess Savings
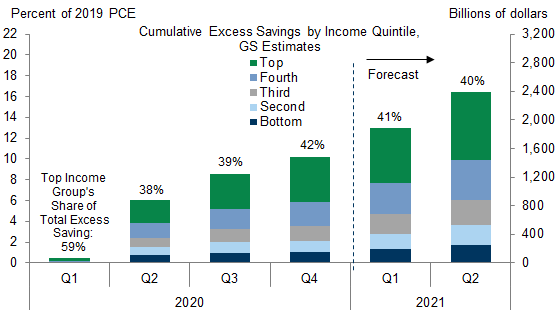
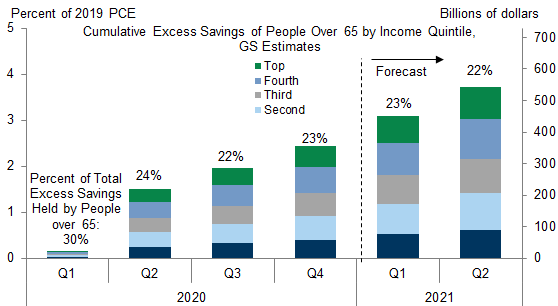
Exhibit 5: Over 20% of the Excess Savings Are Likely Held by Retirees, Who Might Remain More Cautious Even After Vaccination
Where Are the Excess Savings Now?
Exhibit 6: Households Appear to Have Used About 10% of the Excess Savings to Pay Down Debt
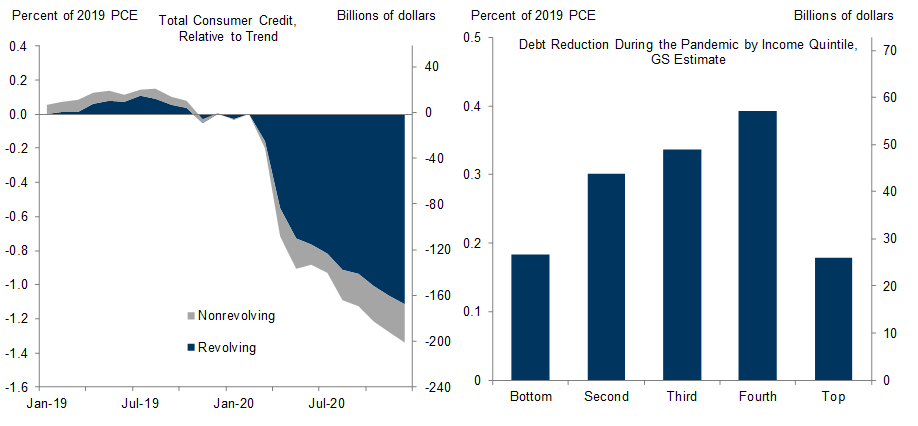
Exhibit 7: A Large Share of the Excess Savings Is Now Held by High-Income Households or in Illiquid Form
The Impact of Excess Savings on Post-Pandemic Spending and GDP
Exhibit 8: We Estimate That Spending of Excess Savings Will Contribute 2pp to GDP Growth in the First Year After Full Reopening
Joseph Briggs
David Mericle
The US Economic and Financial Outlook
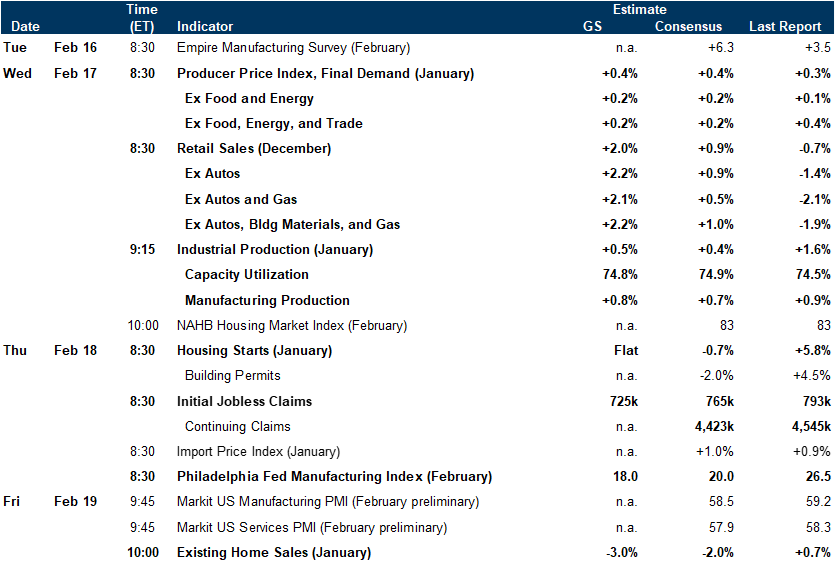
Economic Releases
- 1 ^ Joseph Briggs, David Mericle, and Ronnie Walker, “Income Losses vs. Fiscal Stimulus: Estimating Second-Round Effects from the Virus Shock,” US Economics Analyst, April 29, 2020.
- 2 ^ Joseph Briggs, David Mericle, and Alec Phillips, “The Fiscal Impulse in 2021 and Beyond,” US Daily, February 12, 2020.
- 3 ^ Joseph Briggs, “Turning a K Into a V,” US Economics Analyst, November 29, 2020. We estimate the distribution of disposable income by separately estimating the share of each component received by each income quintile. For labor income, we project forward the BEA’s Distribution of Personal Income estimates using recent data on employment and wage growth and their historical cyclical patterns. For asset income, we again start with the BEA’s distributional income estimates and project shares forward using the Federal Reserve’s Distributional Financial Accounts. For transfer income, we estimate the distribution of regular transfers using data from the BEA and the CBO, and we estimate the distribution of pandemic-related transfers using group-specific unemployment rates and data from the Census Pulse Household Survey. Finally, we rescale our estimates so that our bottom-up distributional estimates are consistent with our forecast for aggregate disposable income.
- 4 ^ Joseph Briggs and David Choi, “The 2021 Rebound: What Could Go Wrong?” US Economics Analyst, January 28, 2021.
- 5 ^ Specifically, we use the H.8 banking report to estimate the aggregate increase in checking and saving deposits during the pandemic, and then use Flow of Funds data on household balance sheets through Q3 to estimate the household sector’s share of the increase. We then combine data on bank account balance changes by income group during the pandemic (from Diana Farrell et al., “Household Cash Balances during COVID-19: A Distributional Perspective,” December 2020) with pre-pandemic bank account levels from the Federal Reserve’s Survey of Consumer Finances to estimate the distribution of increases in bank account balances across income groups.
- 6 ^ The low MPCs from illiquid assets are calibrated based on academic studies that estimate that spending increases by a few cents for each dollar increase in financial and housing wealth.
Investors should consider this report as only a single factor in making their investment decision. For Reg AC certification and other important disclosures, see the Disclosure Appendix, or go to www.gs.com/research/hedge.html.