Rationing and supply restrictions during World War 2 provide the closest available analogue in modern US history to the barriers to spending during the pandemic. Then as now, restrictions caused households to build up substantial excess savings. Official statistics show a large spike in inflation after the war, which has provoked concern that inflation might increase sharply after the pandemic as consumers spend their pent-up savings.
We estimate that households accumulated excess savings during the war totaling nearly 40% of GDP, roughly four times as large as our estimate of excess savings from the pandemic. Historical data suggest that consumers spent about 20% of their excess savings between 1946 and 1949, which resulted in the saving rate falling below its normal level for several years. Spending on durable goods, the products that were least available due to wartime restrictions, increased the most rapidly. This episode adds to our confidence that pent-up savings will contribute to a consumption boom starting in mid-2021.
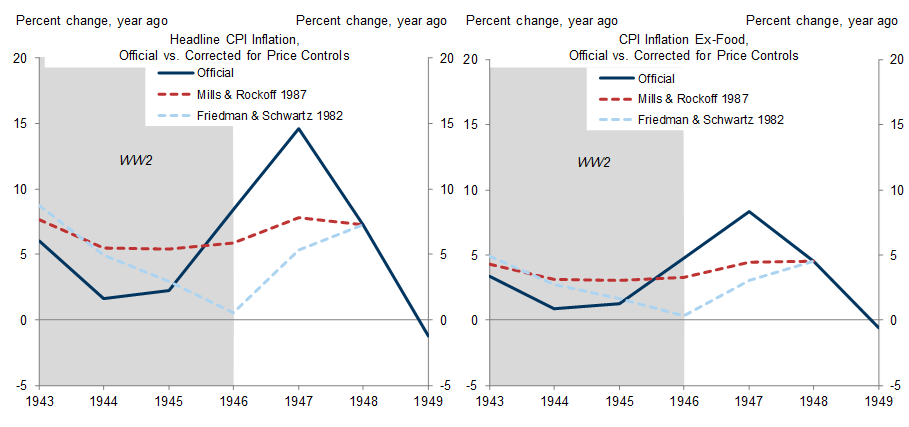
Although the official statistics show a large spike in inflation (~12pp) over 1946–47, the postwar experience is less worrisome than it might seem for two reasons. First, the rise in inflation primarily reflects the removal of wartime wage and price controls and a spike in food prices due to shortages, and a core inflation measure adjusted for price controls rose more modestly (~1.5pp). Second, at that time the Fed was largely prevented by an agreement with the Treasury Department from raising interest rates in response, and inflation expectations were less well anchored than they are today.
Pent-Up Savings and Inflation After World War 2
Exhibit 1: Both the Personal Saving Rate and Bank Deposits as a Share of GDP Declined After World War 2
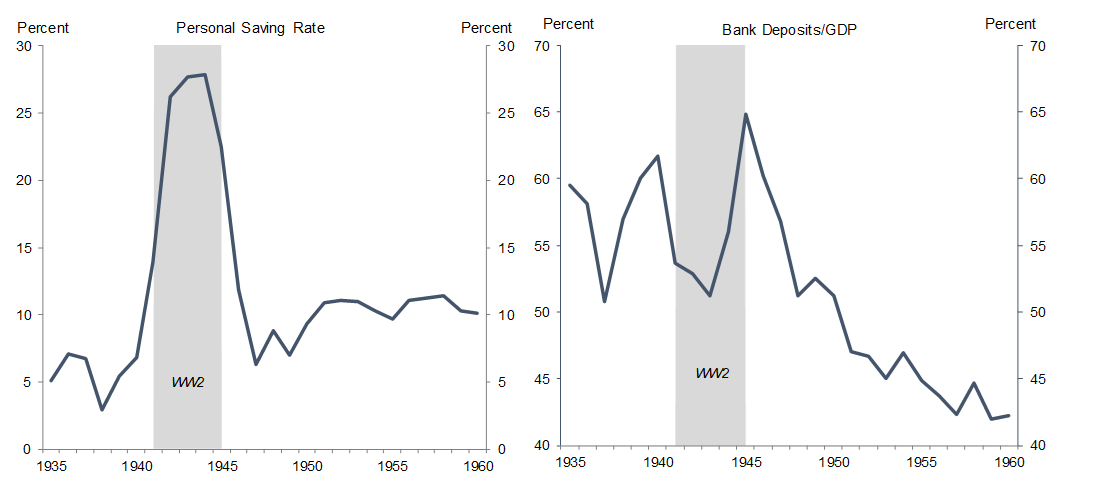
Exhibit 2: Consumption Boomed After World War 2 as Restrictions Were Lifted, Especially on Durables
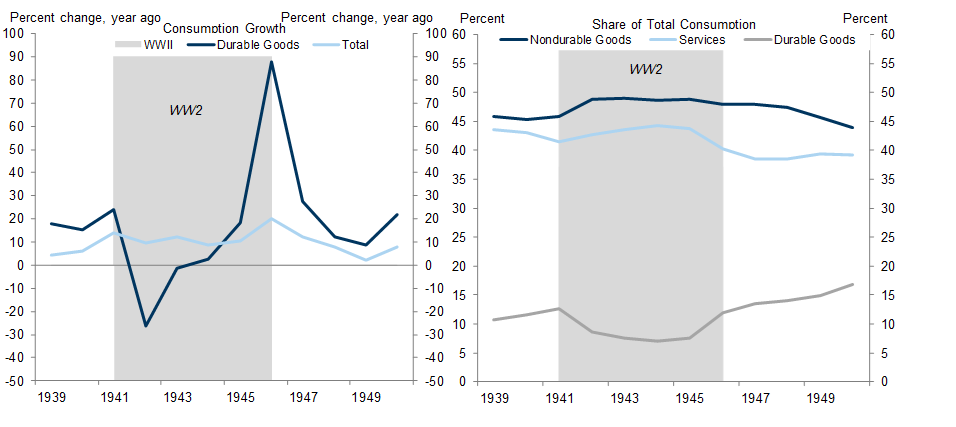
Exhibit 3: The Postwar Spike in the Official Inflation Numbers Largely Reflects Food Inflation and the Removal of Wartime Wage and Price Controls
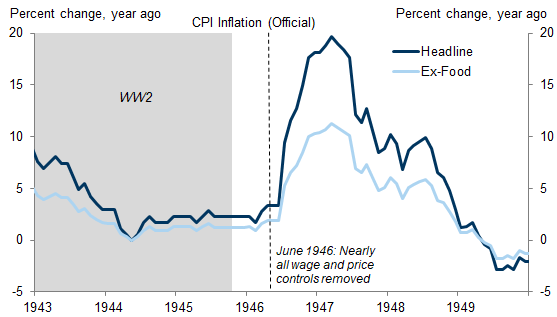
Exhibit 4: The Postwar Increase in Core Inflation Looks More Moderate After Adjusting for the Removal of Wartime Price Controls
Laura Nicolae
- 1 ^ Milton Friedman and Anna Schwartz (1963), A Monetary History of the United States, pg. 559; S. Morris Livingston (1943), “Wartime Savings and Post-war Markets,” Survey of Current Business, Bureau of Economic Analysis, September 1943.
- 2 ^ Milton Friedman and Anna Schwartz (1963), A Monetary History of the United States, pg. 581; S. Morris Livingston (1943), “Wartime Savings and Post-war Markets.” During the war, most household savings were very liquid—in Treasury bonds, deposits, or currency—which likely contributed to a faster spending after the war.
- 3 ^ Morris Cohen (1952), “Postwar Consumption Functions,” The Review of Economics and Statistics; Clement Winston and Mabel A. Smith (1950), “Income Sensitivity of Consumption Expenditures,” Survey of Current Business, Bureau of Economic Analysis, January 1950; Office of Business Economics (1950), “The Economy in Adjustment: A Review of 1949,” Survey of Current Business, Bureau of Economic Analysis, February 1950.
- 4 ^ There is some disagreement between the official personal saving rate and the findings of Friedman and Schwartz (1963), who write that consumers spent half their accumulated excess savings (as measured by the ratio of money balances to 9 months’ income) over 1946–1948. However, as explained above, the decline in money balances likely overstates the decline in saving, since investment in non-deposit assets increased after the war.
- 5 ^ The decline in deposits over 1941–1943 likely reflects a shift toward saving in Treasury war bonds, driven in large part by wartime bond drives. For example, J.P. Cavin (1945), “Aspects of Wartime Consumption,” American Economic Review; S. Morris Livingston (1943), “Wartime Savings and Post-war Markets.”
- 6 ^ Milton Friedman and Anna Schwartz (1963), A Monetary History of the United States, pg. 560; L. R. Klein (1946), “A Post-Mortem on Transition Predictions of National Product,” Journal of Political Economy; Woytinsky (1947), “What Was Wrong in Forecasts of Postwar Depression?”, Journal of Political Economy; S. Morris Livingston (1943), “Wartime Savings and Post-war Markets.”
- 7 ^ Bureau of Labor Statistics (2014), “One Hundred Years of Price Change: The Consumer Price Index and the American Inflation Experience,” April 2014; Office of Business Economics (1947), “The Economy in Reconversion: A Review of 1946,” Survey of Current Business, Bureau of Economic Analysis, February 1947.
- 8 ^ Milton Friedman and Anna Schwartz (1982), “Monetary Trends in the United States and United Kingdom: Their Relation to Income, Prices, and Interest Rates, 1867–1975,” p. 107; Geofrey Mills and Hugh Rockoff (1987), “Compliance with Price Controls in the United States and the United Kingdom During World War II,” The Journal of Economic History 47(1), March 1987. Mills and Rockoff (1987) use wages to project the true level of prices, since most evasion of wage controls occurred through employers promoting their employees to higher job classifications rather than misreporting their wages. Friedman and Schwartz project the price index using nominal income, since it abstracts from prices of specific goods and services. Mills and Rockoff find that in the U.K., where wages were not controlled during the war, the wage index generally outperformed nominal income in predicting prices.
Investors should consider this report as only a single factor in making their investment decision. For Reg AC certification and other important disclosures, see the Disclosure Appendix, or go to www.gs.com/research/hedge.html.