Goldman Sachs Research
US Economics Analyst
The Fed’s Broad and Inclusive Maximum Employment Goal (Briggs/Walker/Nicolae)
22 March 2021 | 4:38AM EDT | Research | Economics| By Jan Hatzius and others
More
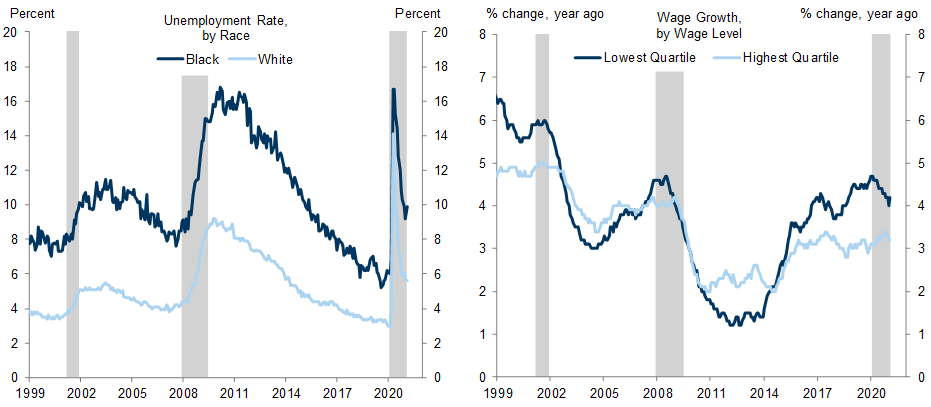
  • Federal Reserve Chair Powell has said that the tight labor market at the end of last cycle was narrowing economic disparities and “delivering life-changing gains,” particularly for people from low- and moderate-income communities. The FOMC incorporated this lesson into its new monetary policy framework and now says that maximum employment “is a broad-based and inclusive goal” that is assessed with a “wide range of indicators.”

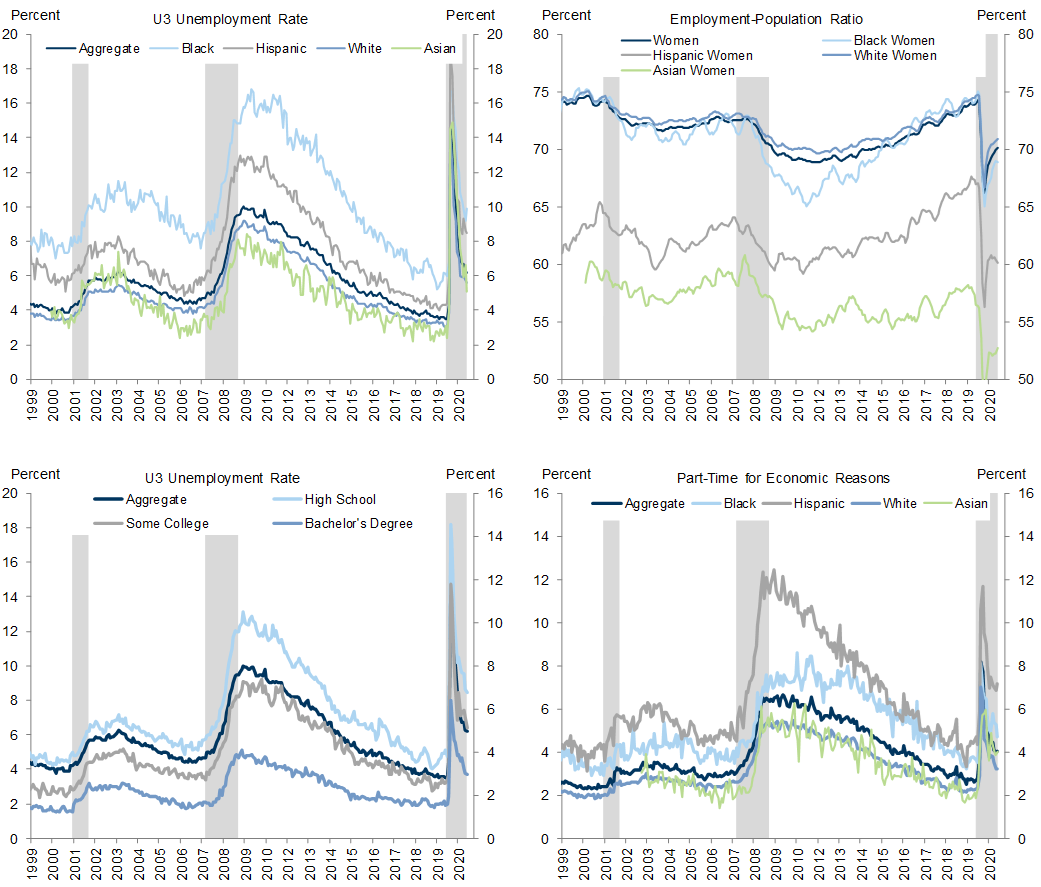
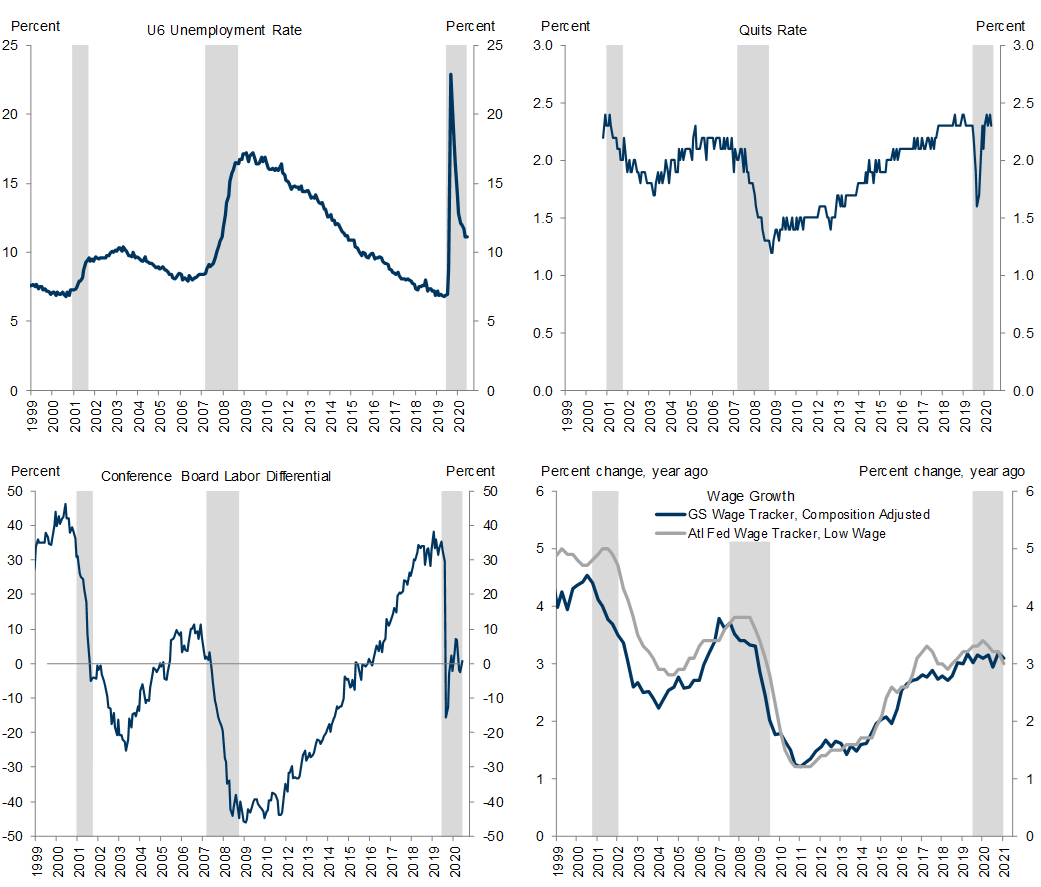
  • Fed officials increasingly emphasize the new broad and inclusive mandate when discussing the employment outlook. At the March FOMC press conference, Chair Powell cited the Black and Hispanic unemployment rates as among the “dozen things” that the FOMC looks at in addition to the overall unemployment rate. After collecting labor market indicators Fed officials have mentioned into an updated dashboard, we find that many suggest more slack than headline unemployment.

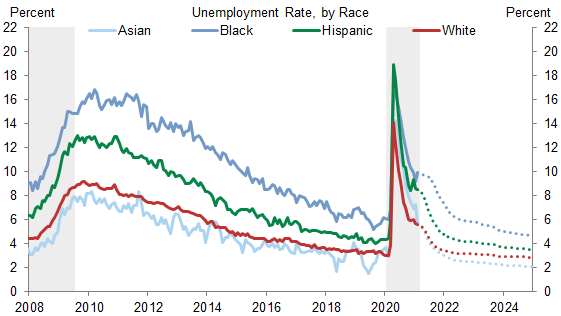
  • Interpreting the Fed’s new maximum employment goal is somewhat difficult because many indicators don’t have a familiar maximum employment benchmark. To aid interpretation, we estimate a level equivalent to maximum employment for several indicators based on their historical relationship with U3 unemployment. We also use our unemployment forecast and the relationship of individual indicators with U3 unemployment to project demographic-specific unemployment rates through 2024. While we forecast that the overall unemployment rate will fall below the FOMC’s longer-run estimate of 4% by early next year, historical statistical relationships suggest that some demographic groups’ unemployment rates will remain above 4% for much longer.

  • This new approach could have dovish monetary policy implications, though probably modest ones. It will probably not affect monetary policy when core PCE inflation is running below or well above 2%, since the Fed’s new inflation criteria rules out liftoff in the former case and the Fed would likely tighten policy in the latter case to keep inflation expectations anchored. However, it could affect policy decisions even after overall U3 hits the Fed’s longer-run goal if inflation is only modestly above 2% and stable. In this scenario, some FOMC members may prefer to wait for further improvement before raising the policy rate if unemployment for some demographic groups remains elevated.

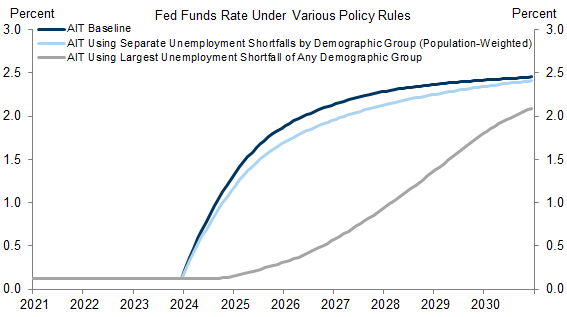
  • To provide a concrete interpretation of the new goal’s impact, we modify an average inflation targeting policy rule to also incorporate the broad and inclusive employment goal. This exercise implies that the broad and inclusive goal slows the pace of tightening only slightly, with a peak impact of -20bps, although more dovish interpretations of the new employment goal are also possible.

The Fed’s Broad and Inclusive Maximum Employment Goal

A Broad and Inclusive Employment Goal

At the conclusion of its monetary policy framework review last year, the FOMC announced that policy decisions would be informed only by “shortfalls” of employment from its maximum level rather than by “deviations from its goal in either direction, and that maximum employment will be a “broad-based and inclusive” goal that is assessed with a “wide range of indicators.”
This change in the policy framework largely reflects the lessons learned from the tight labor market at the end of last cycle, which Chair Powell has said that the tight labor market at the end of last cycle was narrowing economic disparities and “delivering life-changing gains,” particularly for people from low- and moderate-income communities.[1] [2] These views are borne out in the data, since labor market outcomes for historically disadvantaged workers continued to improve significantly, even after the aggregate U3 unemployment rate reached the CBO’s estimate of the natural rate in early-2017 (Exhibit 1).[3]

Exhibit 1: The Tight Labor Market Late in the Last Cycle Helped Reduce Economic Disparities

1. The Tight Labor Market Late in the Last Cycle Helped Reduce Economic Disparities. Data available on request.
Source: Department of Labor, Federal Reserve Bank of Atlanta
Fed officials are increasingly emphasizing the new broad and inclusive mandate when discussing the employment outlook, as highlighted by Chair Powell’s comments at the March FOMC press conference that Black and Hispanic unemployment rates were among the “dozen things” that the FOMC looks at in addition to the overall unemployment rate. Other officials have expressed similar sentiments recently, as summarized in the table below. The broad takeaways from these comments is that Fed officials will consider a broader set of indicators when assessing maximum employment than they have previously, and that these indicators are increasingly focused on the employment outcomes of specific demographic groups that are slower to recover in economic expansions.[4]

Fed Commentary on Maximum Employment and the Broad and Inclusive Mandate

Date

Speaker

Key Quotes

Venue

Mar 17

Powell

We look at a very broad range [of labor market indicators]. You hear us talk all the time about participation, about employment to population, which is the combination of the two, about different measures of unemployment. So it’s wages. It’s the job flows. You know, all of those things go into an assessment of maximum employment.

Q&A

Mar 5

Kashkari

Maximum employment, for me, is a labor market that is tight enough that it generates 2 percent inflation on average over time. We had not yet achieved that before the pandemic hit. So, we need to get back to where we were before the pandemic, but then we need to go beyond it to really put all Americans back to work.

Washington Post Interview

Feb 24

Brainard

1. I would not recommend relying on any single indicator, but rather consulting a variety of indicators that together provide a holistic picture of where we are relative to full employment.

2. [In addition to unemployment rates by wage-level] There is also important information in the disaggregation of unemployment by different racial and ethnic groups.

3. While the EPOP ratio is a strong indicator of the extensive margin in the labor market, or how many people are working, there is also important information in the intensive margin—that is, how much work each person is doing.

Speech Text

Feb 23

Powell

We emphasize that maximum employment is a broad and inclusive goal. This change reflects our appreciation for the benefits of a strong labor market, particularly for low- and moderate-income communities.

Speech Text

Feb 19

Rosengren

1. The pandemic has had significantly divergent impacts on different industries and workers, leading to very different economic outcomes across different segments of the population.

2. My view is that policymakers must work to ensure that the benefits of the eventual recovery are widely shared.

Speech Text

Feb 10

Powell

Given the number of people who have lost their jobs and the likelihood that some will struggle to find work in the post-pandemic economy, achieving and sustaining maximum employment will require more than supportive monetary policy. It will require a society-wide commitment, with contributions from across government and the private sector.

Speech Text

Jan 7

Daly

There's a danger in computing a [single indicator] and saying that means we are there.

Virtual Event

Nov 16

Clarida

[Maximum employment] means to me that, when the unemployment rate is elevated relative to my SEP projection of its long-run level and other indicators—such as the prime-age employment-to-population and labor force participation ratios—are depressed relative to recent business cycle peaks, monetary policy should, as before, continue to be calibrated to eliminate such employment shortfalls as long as doing so does not put the price-stability mandate at risk.

Speech Text

Oct 2

Harker

Tolerating the risk of slightly higher inflation, in our view, is worth it if it helps us achieve our employment goals. That’s important because one of the salutary trends of the pre-COVID economy was that economic gains, at least on a limited basis, were finally being enjoyed by lower-wage workers, a disproportionate percentage of whom are racial minorities. We still had a very, very long way to go, of course. But it’s clear that we must achieve full employment to have any hope of beginning to narrow the yawning gaps that bedevil our society.

Speech Text

Sep 29

Kaplan

[Unemployment rates by demographic group] reinforce the need for greater efforts to invest in education and skills training in order to create a stronger and more inclusive labor market and help ensure that key groups of our society are not left behind in this recovery.

Essay

Sep 16

Powell

1. [When asked if the Fed is open to using specific measures of inequality in setting monetary policy] The thing is, we don’t really have the tools to address those. We have interest rates and bank supervision and financial stability policy and things like that, but we can’t get at those things through our tools. When we lower the federal funds rate, that supports the economy across a broad range of, of people and activities, but we don’t have the ability to target particular groups.

2. When we think about maximum employment in particular, we do look at individual groups. So high unemployment in a particular racial group like African Americans, we would look at that as we think about whether we’re really at maximum employment. We would look at that along with a lot of other data. So the answer is, we do look at all those things and, and do what we can with our tools. But, ultimately, these are issues for elected representatives.

Q&A

Jul 16

Bostic

From Reuters interview recap: "Bostic … 'could imagine' a day when the unemployment rate for Blacks gets highlighted in Fed statements as a way to measure the true strength of the labor market.

Interview

Jun 17

Kashkari

I don’t think we have the ability to say “we’re going to target a reduction in this type of inequality through interest rates.” But I do think paying attention to these [racial] disparities gives us better insight into labor market slack in general.

NYT Interview

Jun 12

Bostic

1. I believe the Federal Reserve Bank of Atlanta, and the Federal Reserve more generally, can play an important role in helping to reduce racial inequities and bring about a more inclusive economy.

2. We can do this, first, by fulfilling the mission given to us, which is to promote the health of the U.S. economy and the stability of the U.S. financial system.

3. The second way the Atlanta Fed can contribute to a more inclusive economy lies in the foundation of promoting maximum employment, by addressing the economic inequality that persists in this country.

Essay

What the Fed is Watching

A recent speech by Fed Governor Brainard provides the most concrete look into indicators other than U3 that the Fed will be watching when assessing the labor market recovery this cycle.[5] In the near-term, Gov. Brainard (and other Fed officials) have emphasized that the “true” unemployment rate—which corrects for both pandemic-specific misclassification errors and labor force dropout—is about 3-4pp higher than the headline unemployment rate suggests (Exhibit 2).

Exhibit 2: The Headline Unemployment Rate Understates Labor Market Slack Due to Misclassification and Labor Force Dropout

2. The Headline Unemployment Rate Understates Labor Market Slack Due to Misclassification and Labor Force Dropout. Data available on request.
Source: Department of Commerce, Goldman Sachs Global Investment Research
These pandemic-related distortions will likely drop out within the next year or so, but the broad and inclusive employment goal suggests that the Fed will continue to monitor a wide range of indicators even after the pandemic is well in the rear-view mirror. To monitor the new goal’s impact, in Exhibit 3 we have constructed a dashboard of labor market indicators based on commentary from current and prior Fed officials. The main change relative to the previous dashboard approach proposed under Chair Yellen’s leadership is that it incorporates more demographic-specific employment measures.
Our updated employment dashboard sends mixed signals right now. On one hand, the unemployment rate for minority and less educated workers is very high, reflecting the disproportionate layoffs that these groups experienced during the pandemic. On the other hand, other measures of labor market tightness like quit rates and wage growth are near their peaks from last cycle. Overall, however, many of the indicators shown in Exhibit 3 suggest more slack than the current headline unemployment rate indicates.

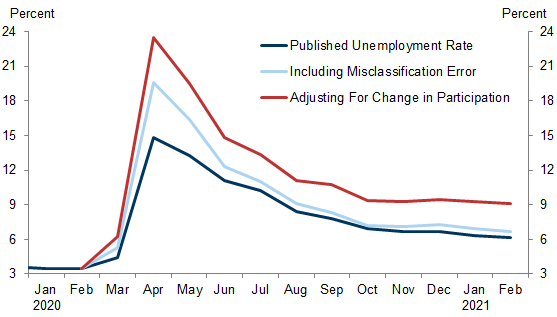
Exhibit 3: Fed Officials Will Look at a Wide Range of Indicators to Assess Maximum Employment

3. Fed Officials Will Look at a Wide Range of Indicators to Assess Maximum Employment. Data available on request.
Source: Department of Labor, Goldman Sachs Global Investment Research

Data available on request.
Source: Department of Labor, The Conference Board, Federal Reserve Bank of Atlanta, Goldman Sachs Global Investment Research

Assessing Maximum Employment Under the New Broad and Inclusive Goal

The shift towards a broad and inclusive goal that considers a range of indicators to assess maximum employment creates communication and interpretation challenges because—unlike U3 unemployment—many of the indicators the Fed will be watching don’t have familiar benchmarks. Additionally, the Fed has not formally defined maximum employment, and although its most obvious estimate is the FOMC’s median longer-run unemployment rate projection of 4.0%, many Fed officials appear to have a lower target in mind. For example, at the September FOMC press conference Chair Powell stated that the Fed “absolutely” wanted to get the unemployment rate back to 3.5% or even lower.
To help interpret the new goal, we estimate a level equivalent to maximum employment for several indicators based on their historical relationship with the U3 unemployment gap (Exhibit 4). The relationship between many indicators and the unemployment gap is highly nonlinear when the unemployment gap is low or negative—as shown for the Black unemployment rate in the left panel of Exhibit 4—because some employment measures improve disproportionately in tight labor markets.[6] We therefore use a LOESS regression to estimate the nonlinear relationship, and then extract the model estimates to recover a level for each indicator that corresponds to the Fed’s longer-run estimate of the U3 unemployment rate (4.0%) and the lowest level observed last cycle (3.5%).
The right panel in Exhibit 4 shows our resulting estimates. The first key takeaway is that the unemployment rate for several demographic groups will likely remain elevated even after the overall unemployment rate reaches the Fed’s longer-run estimate. For example, the historical statistical relationships suggest the unemployment rate for Black workers will still be 7.6% and the unemployment rate for workers with a high school education or less will still be 5.0% when U3 unemployment reaches 4.0%.
The second key takeaway is that after U3 unemployment gets back down to low levels, subsequent improvements will likely be driven by employment gains among demographic groups that have historically had worse labor market outcomes. For example, the statistical relationships suggest that the gap between the Black unemployment rate and the overall unemployment rate will drop from 3.6pp to 2.2pp as the overall unemployment rate falls from 4.0% to 3.5%, while the unemployment rate gap between workers with a high school education or less will decline from 1.0pp to 0.7pp. The bottom of the panel shows that other alternative labor market indicators also have room to improve, sometimes significantly, after the unemployment rate reaches 4.0%.

Exhibit 4: Many Economic Indicators Have Room to Improve, Some Significantly, After the Unemployment Rate Reaches the Fed’s Longer-Run Projection

4. Many Economic Indicators Have Room to Improve, Some Significantly, After the Unemployment Rate Reaches the Fed’s Longer-Run Projection. Data available on request.
Source: Goldman Sachs Global Investment Research
Recent comments from Fed officials suggest they will be paying especially close attention to the recovery in employment for different demographic groups as we move past the pandemic. In Exhibit 5, we therefore also combine the statistical relationship between different demographic groups’ unemployment rates and the overall unemployment rate with our baseline unemployment rate forecast to project demographic-specific unemployment rates through 2024.
Although we expect the overall unemployment rate will reach the FOMC’s longer-run estimate of 4% by the end of this year and last cycle’s low of 3.5% by the end of 2022, the employment recovery could take longer for some demographics. For instance, historical statistical relationships suggest that the Black and Hispanic unemployment rates won’t reach their lows from last cycle (5.2% for Blacks, 3.7% for Hispanics) until 2023H2, and that the Black unemployment rate will remain above 4.0% through the end of 2024.

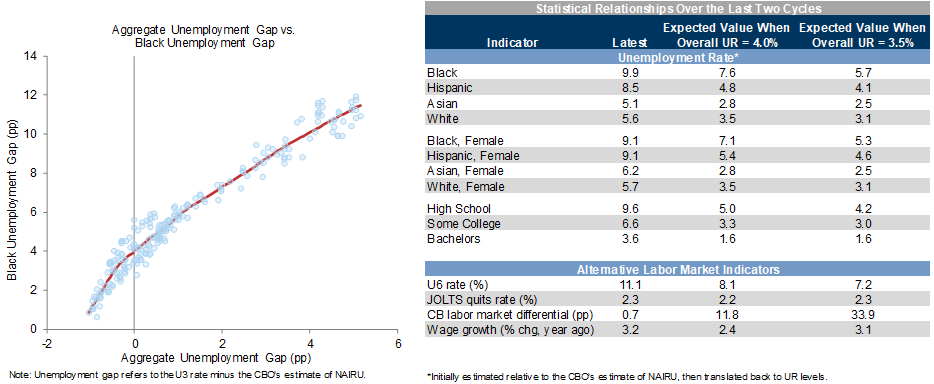
Exhibit 5: We Expect Unemployment Rates Will Recover at Different Speeds for Different Demographic Groups Based on Their Historical Relationship With the Aggregate Unemployment Rate

5. We Expect Unemployment Rates Will Recover at Different Speeds for Different Demographic Groups Based on Their Historical Relationship With the Aggregate Unemployment Rate. Data available on request.
Source: Department of Labor, Goldman Sachs Global Investment Research

The Monetary Policy Implications of the New Broad and Inclusive Goal

What do these patterns mean for monetary policy? FOMC members haven’t provided specific guidance on how they will incorporate the broad and inclusive goal into their reaction functions. Furthermore, Fed leadership could be very different at the point when the Fed starts to think about raising interest rates, so the ultimate impact of the broad and inclusive goal remains highly uncertain. However, we expect that the monetary policy implications of the new maximum employment goal will most likely be modest in this recovery under the Fed’s new policy framework.
For instance, the new goal will probably not affect policy decisions when core PCE inflation is running below 2%, since the FOMC aims to achieve inflation above 2% for some time before tightening. On the flip side, the new goal will probably not affect the policy rate much if inflation is rising rapidly or is well above 2%, since the Fed would probably tighten policy in order to keep inflation expectations anchored. However, as illustrated in Exhibit 6, the broad and inclusive goal could affect monetary policy decisions in a middle region—where core PCE inflation is modestly above 2% and stable—after overall U3 unemployment hits the Fed’s target. In this scenario, if unemployment rates for some demographic groups remain elevated, the FOMC may decide to remain accommodative for longer.

Exhibit 6: The Fed Is Unlikely to Tighten Policy at Low Inflation Levels and Would Likely Have to Tighten at Very High Levels, So the New Goal Will Most Affect Policy When Inflation Is Modestly Above 2%

6. The Fed Is Unlikely to Tighten Policy at Low Inflation Levels and Would Likely Have to Tighten at Very High Levels, So the New Goal Will Most Affect Policy When Inflation Is Modestly Above 2%. Data available on request.
Source: Department of Commerce, Goldman Sachs Global Investment Research
As an example, we expect the Fed to hike for the first time in 2024H1 when core PCE is between 2.1-2.2% and the unemployment rate is at 3.2%, but even at this low unemployment rate our statistical model assigns a more than 20% chance that the Black unemployment rate will still be above its last cycle low of 5.2% (Exhibit 7) and a more than 90% chance that it will be above the FOMC’s 4% estimate of the longer-run aggregate U3 rate. If the Black or other demographic groups’ unemployment rates do remain elevated, some FOMC members may see this as a reason to wait for further improvement before tightening.

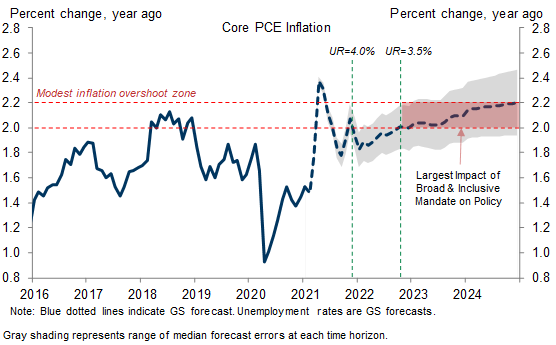
Exhibit 7: Our Model Assigns a Roughly 20% Chance That the Black Unemployment Rate Will Not Have Reached Its Last Cycle Low of 5.2% By 2024Q1

7. Our Model Assigns a Roughly 20% Chance That the Black Unemployment Rate Will Not Have Reached Its Last Cycle Low of 5.2% By 2024Q1. Data available on request.
Source: Goldman Sachs Global Investment Research
To provide a concrete interpretation of the new goal’s impact, we modify a monetary policy rule to incorporate the Fed’s new framework. We first construct a baseline AIT rule that modifies an inertial balanced approach Taylor rule in two ways. First, the rule puts weight on the trailing inflation shortfall, so that it calls for a lower policy rate in response to recent inflation shortfalls. Second, the rule responds to “shortfalls” rather than “deviations” from maximum employment, so that the rule does not call for tighter policy in response to a low unemployment rate.[7]
To incorporate the Fed’s broad and inclusive goal, we further modify the policy rule to respond to shortfalls from maximum employment within any demographic group, even after the aggregate unemployment rate has reached the Fed’s target. Specifically, we include a term reflecting shortfalls from maximum employment for each group shown in Exhibit 5 (weighted by their population share) instead of a single term reflecting aggregate shortfalls.
This illustrative exercise implies only a slightly slower pace of tightening—indicated by the difference between the dark and light blue lines (Exhibit 8)—with the difference peaking at just under -20bps. This small difference reflects that under our baseline forecast most groups’ unemployment rates will likely be fairly low by the time the Fed starts to consider tightening.
However, more dovish interpretations of the new goal with larger impacts on policy are possible. As a second illustrative example, we consider a rule that applies the standard unemployment gap weight to the unemployment gap for the demographic group with the highest unemployment rate. Since the Black unemployment rate is typically the slowest to fall in economic expansions, this rule is similar to a pre-framework review proposal from some senior members of President Biden’s economic team—discussed with Atlanta Fed President Raphael Bostic in July of 2020—to use the Black unemployment rate as a substitute for the overall unemployment rate when evaluating monetary policy. The policy path associated with this rule, indicated by the gray line in Exhibit 8, implies a later liftoff and slower subsequent pace of tightening.

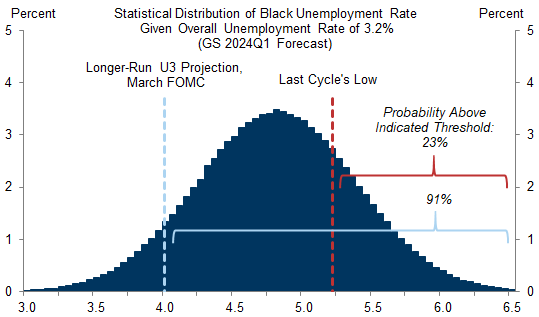
Exhibit 8: The Broad and Inclusive Mandate Implies Only a Slightly More Dovish Policy Path, Although More Dovish Interpretations Are Possible

8. The Broad and Inclusive Mandate Implies Only a Slightly More Dovish Policy Path, Although More Dovish Interpretations Are Possible. Data available on request.
Source: Goldman Sachs Global Investment Research

Joseph Briggs

Ronnie Walker

Laura Nicolae

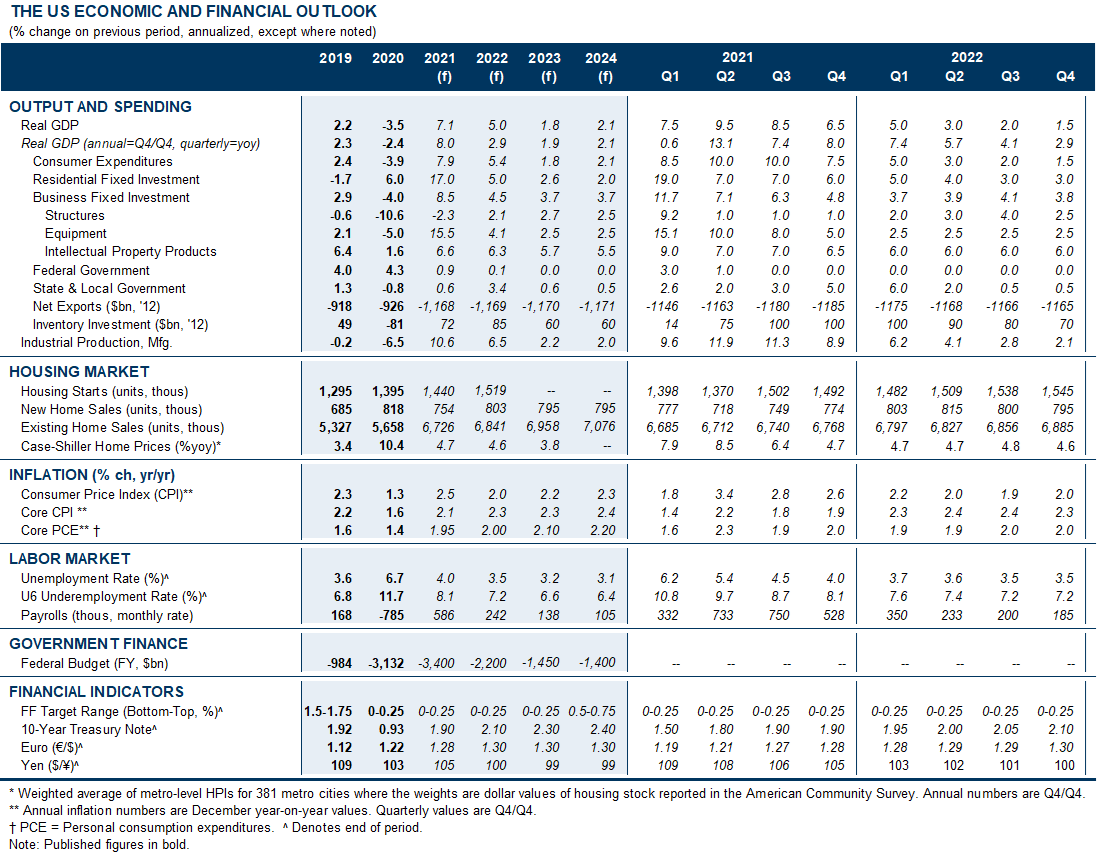
The US Economic and Financial Outlook
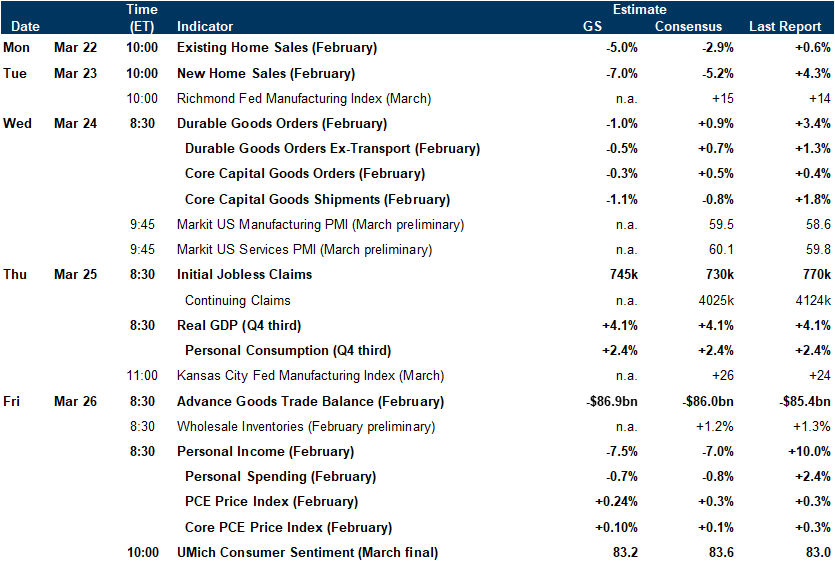
Data available on request.
Source: Goldman Sachs Global Investment Research

Economic Releases

Data available on request.
Source: Goldman Sachs Global Investment Research
  1. 1 ^ Jerome Powell, “New Economic Challenges and the Fed's Monetary Policy Review,” 2020.
  2. 2 ^ See also Clarida and Kaplan.
  3. 3 ^ For additional work on the benefits of tight labor markets, see David Choi “US Daily: Tight Labor Markets: Do Lower-Skilled Workers Benefit More?” 2019 and David Choi “US Daily: Labor Force Participation: Revisiting the Role of Disabled Workers,” 2019.
  4. 4 ^ For a detailed overview of the economic challenges faced by Black women, see Daan Struyven, Gizelle George-Joseph, and Dan Milo, “Black Womenomics” 2020.
  5. 5 ^ Lael Brainard, “How Should We Think about Full Employment in the Federal Reserve's Dual Mandate?” 2021.
  6. 6 ^ Stephanie Aaronson, Mary Daly, William Wascher, and David Wilcox “Okun revisited: Who benefits most from a strong economy?” 2019.
  7. 7 ^ We make two additional adjustments to the standard monetary policy rule in our analysis. First, based on recent comments from Fed officials, we interpret the U3 unemployment rate corresponding to maximum employment as 3.5%. Second, we constrain liftoff until our core PCE inflation forecast crosses the Fed’s liftoff threshold in 2024.

Investors should consider this report as only a single factor in making their investment decision. For Reg AC certification and other important disclosures, see the Disclosure Appendix, or go to www.gs.com/research/hedge.html.