The post-vaccine reopening of the economy is barely underway, but our expectation of accelerating sequential growth is transitioning from forecast to fact. Credit card data are consistent with a mid-single-digit gain in March retail sales (control, mom sa), and we believe the risks are skewed to the upside, because the final two weeks of the month are benefitting from $240 billion of stimulus payments the week of March 17. All in, we estimate the pace of coronacrisis fiscal support to consumers is accelerating by $1 trillion on an annualized basis (or 5% of GDP) for March and Q2, relative to the previous six months.
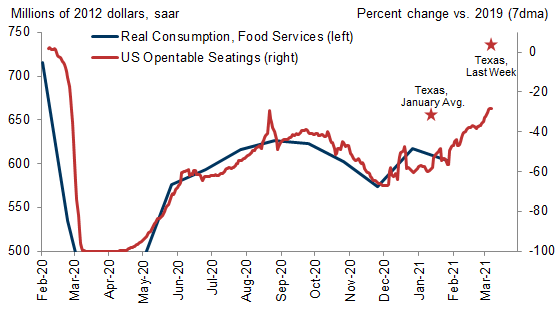
The intra-month spending pattern also indicates a stimulus- and reopening-driven spending surge. Our Recovery Tracker inflected higher over the course of March, in part due to retailer reopenings, the reversal of winter storm effects, and a decline in new Covid infections that coincided with a 15pp increase in airport usage. Restaurant activity has similarly improved, with OpenTable seatings nearing 70% of normal nationwide and back above pre-crisis in Texas.
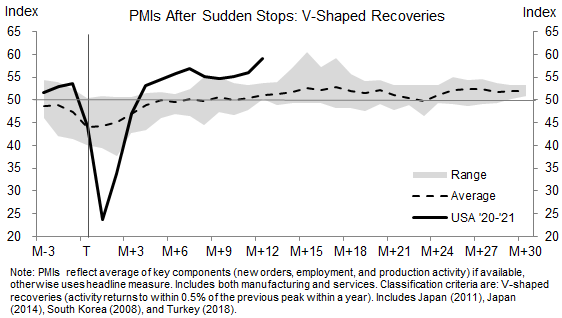
Looking ahead, we believe the uneven recovery to date across economic sectors is actually good news for the 2021 growth outlook, as it increases the scope for outsized gains in underperforming sectors. The message from business surveys is also quite encouraging, with US PMIs picking up to elevated levels over the last two months. Even more striking, the US PMI data have outperformed all 25 “sudden stop” episodes in our international sample, even the 4 “V-shaped recoveries” that saw GDP return to the pre-crisis peak within a year.
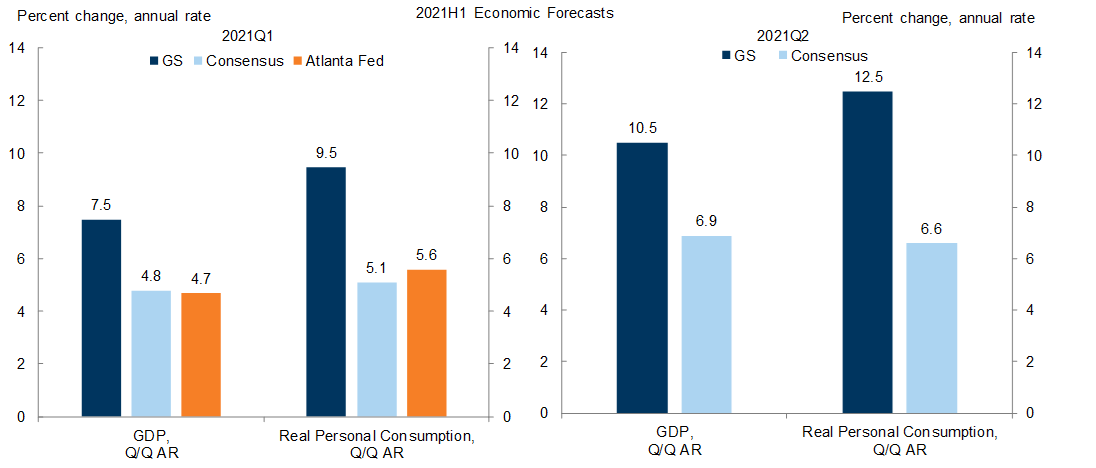
We are adjusting our real consumption growth forecasts to +9.5% in Q1, +12.5% in Q2, and +7.0% in Q3 (qoq ar, vs. +8.5%, +10.0%, and +10.0% previously). While we are leaving our Q1 GDP forecast unchanged at +7.5% due to the winter storm drag, we are also boosting our Q2 GDP forecast by 1.0pp to +10.5%. Offsetting this, we are lowering our Q3 GDP forecast by 1.0pp to 7.5%, because faster spring growth reduces scope for reopening-related gains in the fall. This small pull-forward leaves our growth forecast for 2021 unchanged at 8.0% on a Q4/Q4 basis and raises it one-tenth to 7.2% on a full-year basis.
Anatomy of a Boom
Exhibit 1: Consumer Spending Had Picked Up Sharply Even Before the Stimulus Checks Arrived
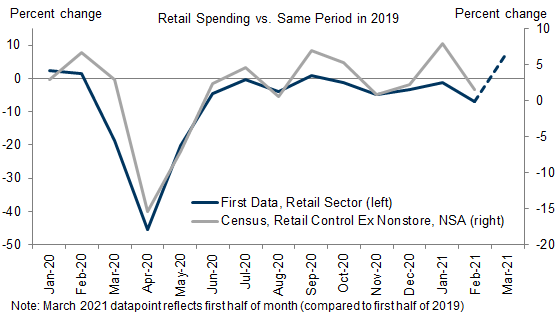
Exhibit 2: Discretionary Spending During the Crisis Has Closely Tracked Fiscal Support to Consumers
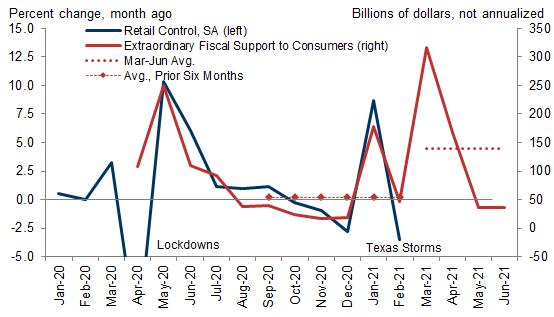
Exhibit 3: Spending Has Improved Over the Course of the Month; ARP Stimulus to Bolster Spending in the Second Half of March and Q2
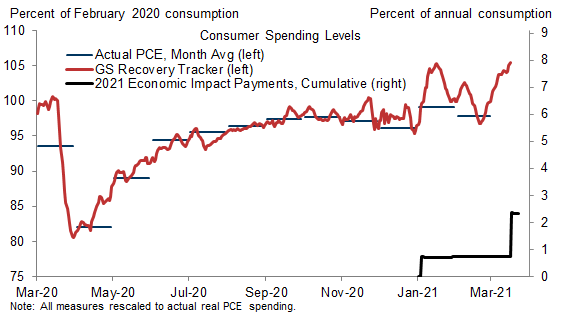
Exhibit 4: Virus-Sensitive Services Also Firming Notably
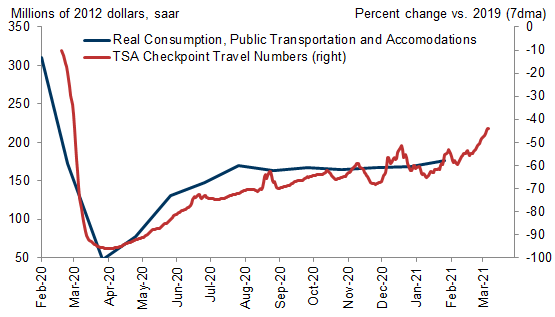
Exhibit 5: Dining Activity Picking Up Sharply—and Back to Normal in Texas
Shut and Open
Exhibit 6: Severity of Business Restrictions Unsurprisingly Correlated with Dining Downturn
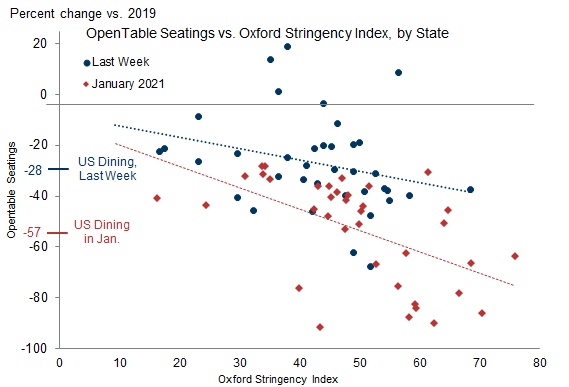
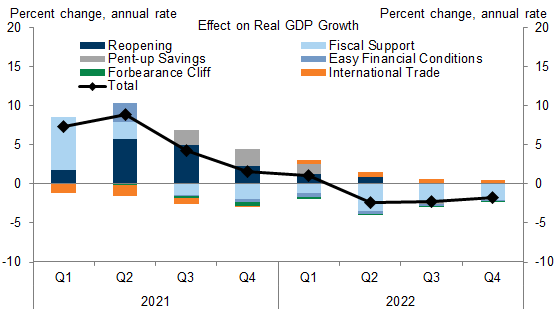
Exhibit 7: Growth Impulses to Raise GDP by Further 6% in 2021, With Frontloaded Boost to in First Half
Anatomy of a Boom
Exhibit 8: Services Consumption Still Depressed by 5% (and Represents 45% of GDP)
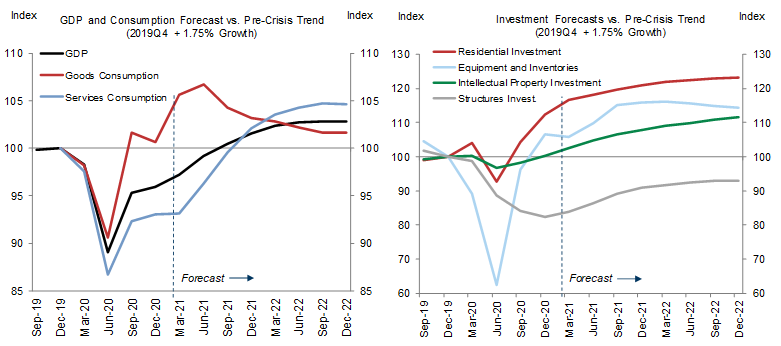
Exhibit 9: US PMIs Outperforming All 25 Sudden-Stop Episodes in Our Dataset, Consistent with Return to Economic Normalcy in Q2
H1 Forecast Upgrade
Exhibit 10: A Sharper Consumption Rebound Drives Our Above-Consensus GDP Forecast
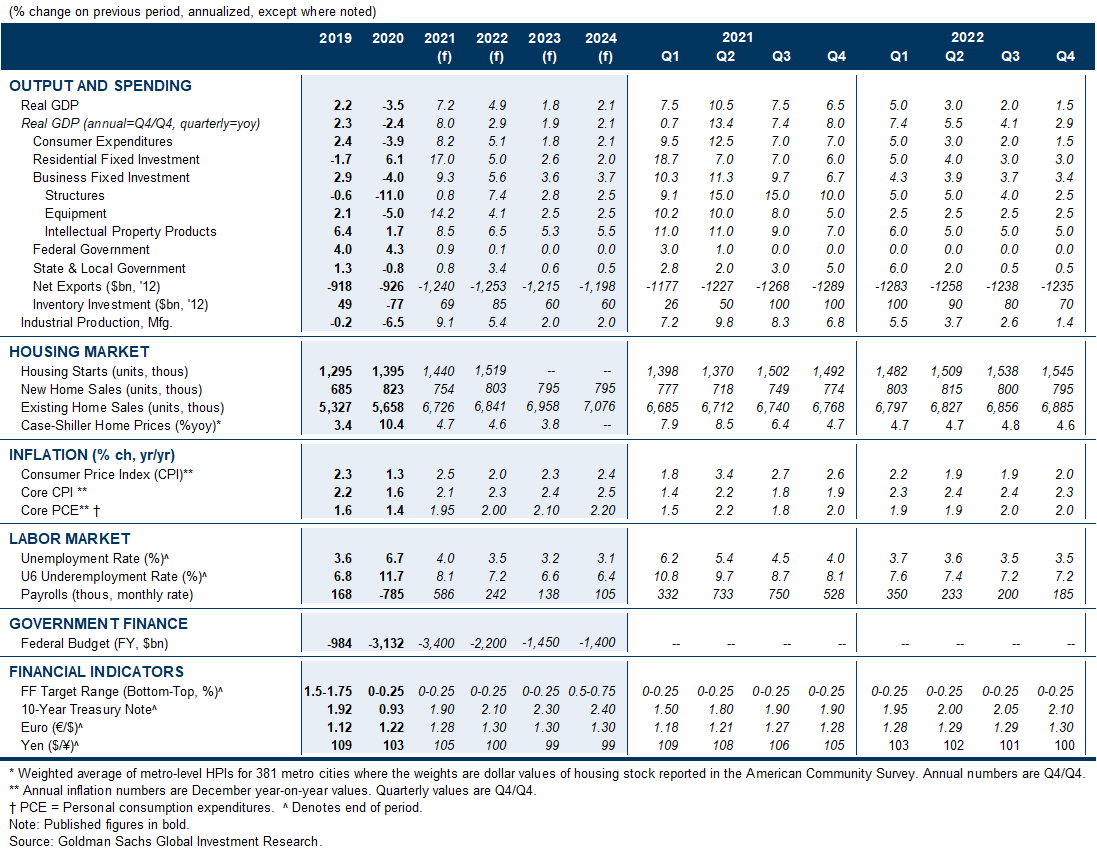
The US Economic and Financial Outlook
Forecast Changes
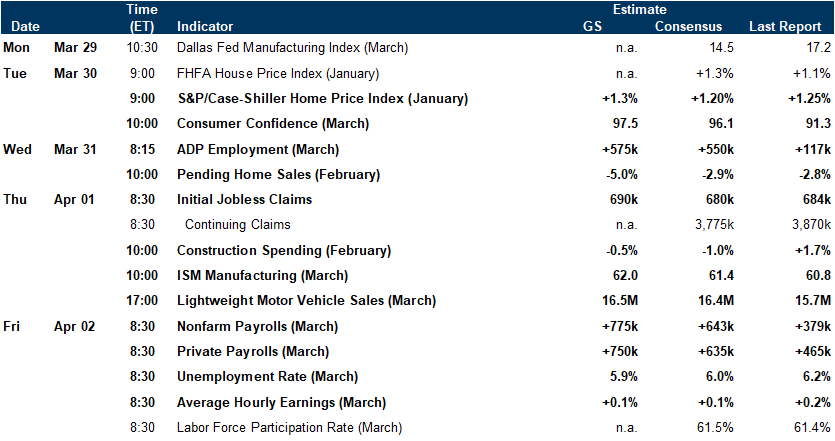
Economic Releases
- 1 ^ Adjusted to reflect the lower volatility of the Census measure. The Census measure has risen at a firmer clip since the fall, but convergence of the two measures would still require a very strong gain of ~2.5% for March retail control (mom sa).
- 2 ^ While we expect the commercial construction rebound in the energy and industrial sector to continue, headwinds in office and retail real estate could prove more long-lasting, due to the advent of Work-from-Home and ecommerce.
Investors should consider this report as only a single factor in making their investment decision. For Reg AC certification and other important disclosures, see the Disclosure Appendix, or go to www.gs.com/research/hedge.html.