Goldman Sachs Research
US Daily: An Update on Spending From Stimulus Checks and Pent-Up Savings (Briggs)
14 April 2021 | 11:31AM EDT | Research | Economics| By Jan Hatzius and others
More
  • The spending response to the large amount of fiscal stimulus paid out in 2021H1 and post-pandemic spending from pent-up savings will be major determinants of the size and speed of the consumption rebound in 2021. In this US Daily we check in on both of these key growth impulses.

  • We find a strong spending response to the arrival of stimulus checks, with over 30% of the January checks spent in the first month and about 10% of the March checks spent in the two weeks after receipt. These marginal propensities to consume are broadly in line with those we’d expect under normal economic conditions, and the strong spending response to the March checks is one reason we expect a 9% increase in the retail sales report on Thursday.

  • We also update our estimate of the post-pandemic spending boost from pent-up savings. Stronger spending growth and an earlier reopening boost should reduce the total amount of pent-up savings, but a somewhat larger share of the savings have remained in liquid bank deposit accounts than we anticipated. We now estimate that 22% of the excess savings will be spent in the first year after reopening, a bit above our earlier estimate, but still expect spending from pent-up savings to contribute roughly 2pp to GDP growth over this timeframe.

  • These patterns are broadly consistent with our overall consumption outlook, and we continue to expect annualized real consumption growth of +11.0% in Q1, +12.5% in Q2, +7.0% in Q3, and +7.0% in Q4. However, the strong spending response and large share of savings in liquid assets suggest some upside risk to our medium-term spending forecast.

An Update on Spending From Stimulus Checks and Pent-Up Savings

Along with the reopening of the virus-sensitive service sector, the impact of fiscal stimulus and pent-up savings on consumer spending will be major determinants of the size and speed of the consumption rebound in 2021. In this US Daily we check in on both of these key growth impulses.
Earlier this year, we expected that the virus situation would dampen and delay the consumer spending response to fiscal transfers, but saw upside risk from a larger, more frontloaded marginal propensity to consume (MPC). The realized MPCs following the Phase 4 stimulus checks in January were larger than we had penciled in and more in line with those that academic studies have estimated from stimulus checks in prior downturns, as roughly 30% of the stimulus funds were spent in the first month after receipt (Exhibit 1). To reflect this pattern and the earlier-than-expected arrival of further support from the Phase 5 fiscal package, we pulled forward spending growth to the first half of 2021 in our most recent forecast upgrade.
The strong spending response has continued with the most recent Phase 5 stimulus checks, and we estimate that roughly 10% of the $242bn in stimulus payments distributed on March 17 was spent in the two weeks after receipt. This pattern suggests that the contribution to growth from income transfers will continue to be more frontloaded, and is one reason we expect a 9% increase in the retail sales report on Thursday and overall consumption growth of +11.0% in Q1 and +12.5% in Q2.

Exhibit 1: Consumer Spending Surged to Almost 10% Above the Pre-Virus Level Following the Disbursement of the $1400 Stimulus Rebates

1. Consumer Spending Surged to Almost 10% Above the Pre-Virus Level Following the Disbursement of the $1400 Stimulus Rebates. Data available on request.
Source: Opportunity Insights, Second Measure Data Points Blog, Department of Commerce, 1010data, Goldman Sachs Global Investment Research
Turning to pent-up savings, we now expect that households will accumulate $2.3tn through 2021Q2 (vs. $2.4tn previously, Exhibit 2) before the saving rate normalizes in 2021H2. We therefore also update our estimates of the spending from pent-up savings by taking on board the latest data on the distribution of these savings across asset classes and household income levels.

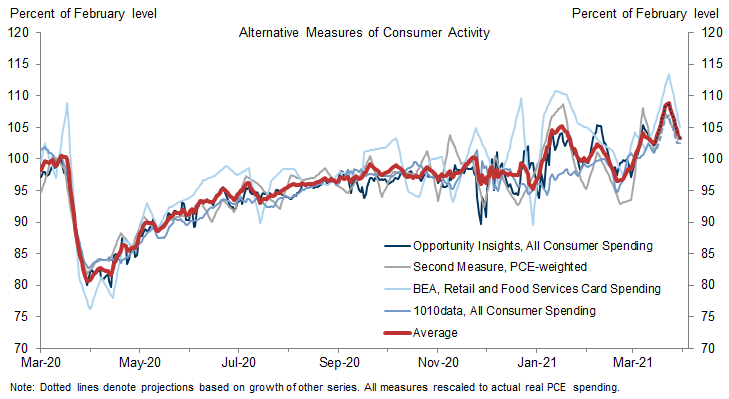
Exhibit 2: We Now Expect Excess Savings to Total 14% of Annual Consumption by Mid-Year

2. We Now Expect Excess Savings to Total 14% of Annual Consumption by Mid-Year. Data available on request.
Source: Bureau of Economic Analysis, Goldman Sachs Global Investment Research
As a first step, we update our estimates of who holds the excess savings by income level. We decompose our aggregate forecasts to estimate disposable income and consumption across income quintiles (see Exhibit 3), then subtract consumption from income to estimate how much excess savings each income quintile will accumulate through 2021Q2. The resulting distribution of excess savings across income quintiles is similar to our previous estimate and still implies that high-income households will hold the bulk of excess savings, as shown below in Exhibit 6.

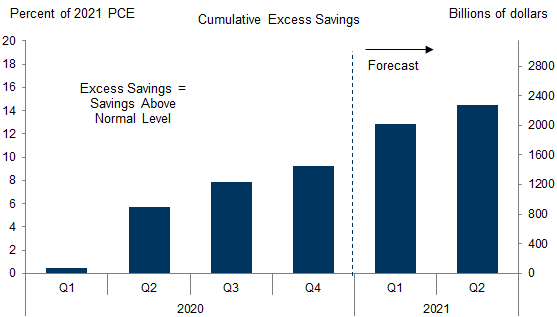
Exhibit 3: We Now Expect More Frontloaded Boosts to Income and Spending

3. We Now Expect More Frontloaded Boosts to Income and Spending. Data available on request.
Source: Bureau of Economic Analysis, US Bureau of Labor Statistics, Congressional Budget Office, Federal Reserve Board, Consumer Expenditure Survey, Opportunity Insights Economic Tracker , Goldman Sachs Global Investment Research
We also take on board two new pieces of information regarding the distribution of these savings across asset classes. First, households have continued to save by reducing debt, and through February aggregate consumer credit levels were about $220bn below their pre-pandemic trend. We now expect that slower debt growth will continue through mid-year and that non-mortgage debt levels will be more than $250bn below their pre-pandemic trend by the end of 2021Q2.
Second, updated aggregate household balance sheet data show that household savings during the pandemic mostly remained in liquid assets like bank accounts through 2020Q4. Accumulating net flows into different asset classes since the start of the pandemic implies that over 80% of pent-up savings remained in liquid assets like bank accounts, while less than 15% had been invested in more illiquid assets like bonds, equities, and investment funds (Exhibit 4). We had previously expected a large shift in pent-up savings from liquid to illiquid accounts to start in Q4, so the stickiness of pent-up savings in bank accounts is somewhat surprising.

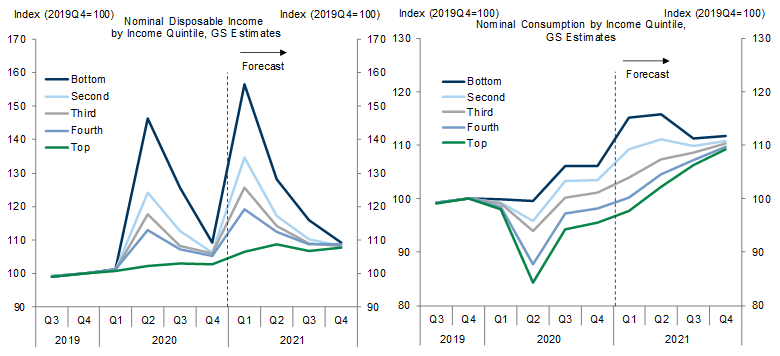
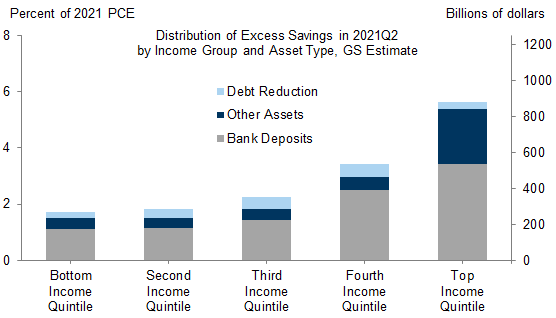
Exhibit 4: Recent Data Show That Excess Savings Were Mostly Held in Liquid Assets Like Bank Accounts Through Q4…

4. Recent Data Show That Excess Savings Were Mostly Held in Liquid Assets Like Bank Accounts Through Q4…. Data available on request.
Source: Federal Reserve Board, Goldman Sachs Global Investment Research
Looking ahead, we still expect some shift in pent-up savings towards more illiquid assets in 2021H1 based on the record-breaking inflows into equity funds since the start of the year (Exhibit 5). On net, however, the data since our last update suggest that pent-up savings are remaining in liquid assets like bank accounts for longer, so we now expect that only 25% of excess savings will have been invested in illiquid assets by the end of 2021Q2 (vs. 39% previously).

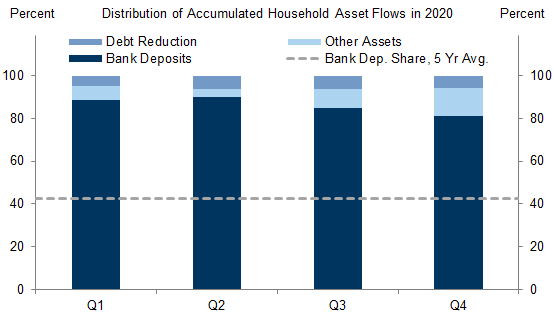
Exhibit 5: ... But Fund Flows Suggest That a Significant Portion of Excess Savings Shifted Toward More Illiquid Assets Like Equity Funds in 2021Q1

5. ... But Fund Flows Suggest That a Significant Portion of Excess Savings Shifted Toward More Illiquid Assets Like Equity Funds in 2021Q1. Data available on request.
Source: EPFR Global, Goldman Sachs Global Investment Research
Exhibit 6 presents our updated estimates of the distribution of excess savings across income quintiles and asset type. By the time we expect economic life to normalize in 2021H2, we estimate that roughly 11% of the excess savings will have been used to pay down debt, 25% will have been used to buy illiquid assets, and 64% will sit in the more liquid form of bank deposit accounts. Of the excess savings that remain in liquid form, we estimate that 22% are held by the bottom two income quintiles combined, 15% by the middle quintile, and 63% by the top two quintiles.

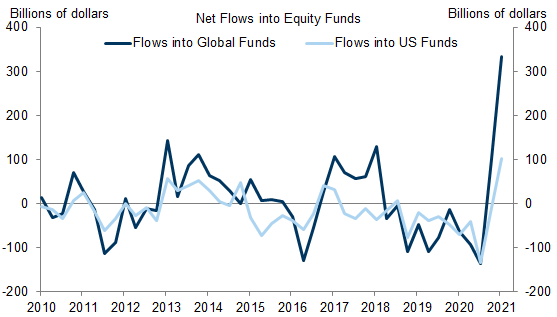
Exhibit 6: A Higher Share of Excess Savings in Liquid Accounts Implies That 22% Will Be Spent in the First Year After Reopening (vs. 18% Previously)

6. A Higher Share of Excess Savings in Liquid Accounts Implies That 22% Will Be Spent in the First Year After Reopening (vs. 18% Previously). Data available on request.
Source: Goldman Sachs Global Investment Research
Combining our estimates of where the excess savings lie with MPCs that vary by asset class and income quintile, we now estimate that 22% of the excess savings will be spent in the first year after the economy fully reopens (vs. 18% previously), with the higher estimate reflecting a higher share of savings remaining in liquid assets that are more likely to be spent quickly. The larger spending response is partially offset by our slightly lower forecast for total accumulated excess savings, however, and we continue to expect spending from pent-up savings to contribute roughly 2pp to GDP growth in the year after reopening.
Overall, these patterns are broadly consistent with our current consumption outlook, and we expect real consumption growth of +11.0% in Q1, +12.5% in Q2, +7.0% in Q3, and +7.0% in Q4. However, the strong spending response and large share of savings in liquid assets suggest some upside risk to our medium-term spending forecast, particularly if pent-up savings mostly remain liquid once the economy fully reopens.

Joseph Briggs

Investors should consider this report as only a single factor in making their investment decision. For Reg AC certification and other important disclosures, see the Disclosure Appendix, or go to www.gs.com/research/hedge.html.