Goldman Sachs Research
US Economics Analyst
Infrastructure Economics (Briggs/Mericle/Nicolae)
18 April 2021 | 11:17PM EDT | Research | Economics| By Jan Hatzius and others
More
  • The White House’s American Jobs Plan proposes a variety of infrastructure investments ranging from transportation and electricity to social and digital infrastructure, and we expect most of them to be enacted. This week’s Analyst provides an overview of infrastructure economics.

  • Policy debates often assume that prolonged underinvestment has left US infrastructure in poor shape. But is this really true? New official statistics introduced by the Bureau of Economic Analysis last year show that both the total stock of US infrastructure as a share of GDP and the flow of new investment are near average historical levels, though the composition has changed. The private sector plays a larger role in new investment, and rising social and digital infrastructure investment have offset a decline in basic infrastructure investment.

  • Measures of infrastructure quality and health are mixed. Core transportation and power generation infrastructure is aging and increasingly strained by demand. But the US scores reasonably well on international rankings of infrastructure quality, at least in most areas. Overall, the evidence suggests that while US infrastructure is not in as dire shape as sometimes claimed, there are areas of weakness and opportunities for improvement.

  • Infrastructure spending from the Biden plan would peak at around 0.5% of GDP from 2023-2026. The new spending would raise total infrastructure investment to around 4.5% of GDP, the highest level since the early 1970s. Infrastructure is only one part of the next round of fiscal measures, which we expect will add about 1% to the level of GDP in total in coming years.

  • The impact of infrastructure investment on long-run potential GDP is more uncertain. Studies suggest that a 1% increase in the public capital stock raises the level of long-run output by about 0.1%, with somewhat larger effects from core infrastructure than from other projects. These numbers imply that the White House infrastructure proposals would eventually boost the level of potential GDP of about ½%. This estimate does not include the potential effects of other proposed fiscal measures such as research and development funding or new social benefits, nor of course does it capture the environmental benefits of the American Jobs Plan.

Infrastructure Economics

The White House’s proposed $2.6tn American Jobs Plan includes funding for a wide range of infrastructure investments. The infrastructure proposals are likely to receive strong support in Congress, and we expect that most will eventually be enacted.
The White House proposal includes both traditional heavy infrastructure as well as social and digital infrastructure projects. Exhibit 1 shows the funding proposed for the major projects. The largest basic infrastructure proposals include $115bn to modernize bridges and roads, $85bn to modernize public transit systems, $80bn for rail, and $100bn for power infrastructure. The largest social infrastructure proposals include $126bn for energy-efficient housing and $50bn for public school construction. The package also includes a $100bn proposed investment in broadband internet.
This week’s Analyst provides an overview of infrastructure economics. We review the key takeaways from new official statistics on US infrastructure that were introduced last year, examine the current state of US infrastructure, and estimate the impact of the White House proposals on both near-term GDP growth and the longer-term level of potential GDP.

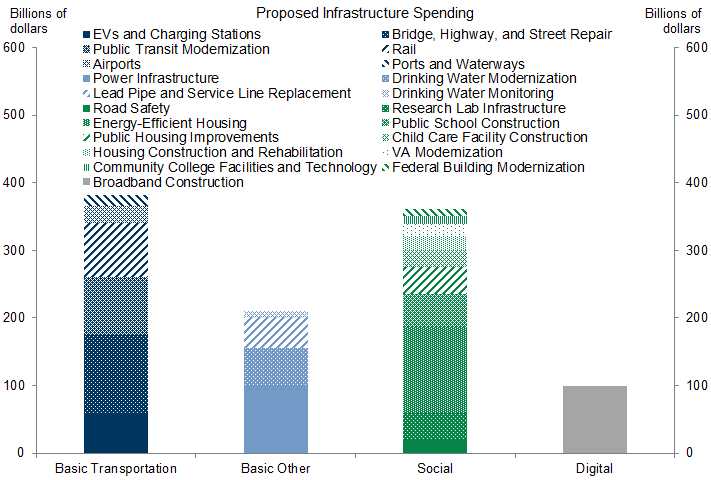
Exhibit 1: The American Jobs Plan Proposes a Wide Range of New Infrastructure Investments

1. The American Jobs Plan Proposes a Wide Range of New Infrastructure Investments. Data available on request.
Source: Committee for a Responsible Federal Budget, Goldman Sachs Global Investment Research

Defining Infrastructure

A new report from the Bureau of Economic Analysis (BEA) decomposes infrastructure into three parts.[1] Basic infrastructure consists mostly of transportation, utilities, water supply, and sewage and waste disposal. Social infrastructure consists mostly of schools, hospitals, and public safety facilities. Digital infrastructure consists of private communication structures such as cell phone towers as well as assets that support the internet and cloud computing. The BEA authors omit intangible infrastructure, though they note that some research and development arguably should count as infrastructure too. We mostly focus our analysis on the proposals that we assume would fall under the definition of infrastructure used by the BEA and exclude proposed spending on research and development.
Exhibit 2 shows the latest available data on infrastructure investment across these three categories carried out by the private sector and federal and state and local government. The exhibit shows that most public infrastructure investment takes places at the state and local level, and that the public sector accounts for most basic transportation infrastructure, but the private sector accounts for a larger share of other basic infrastructure, social infrastructure, and digital infrastructure. Historically the main reasons for the public sector to provide infrastructure have been that the scale of a project is too large for private investors or the time horizon is too long, that a piece of infrastructure that would hold a natural monopoly should not be under private control, or that a project provides positive externalities, such as the positive environmental externalities that are a key rationale for the White House proposals.

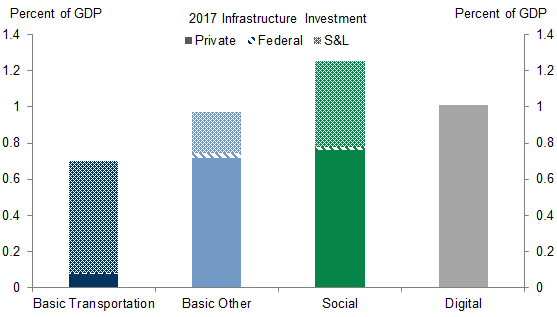
Exhibit 2: US Infrastructure Investment Includes Private, Federal, and State & Local Government Spending on Basic, Social, and Digital Infrastructure

2. US Infrastructure Investment Includes Private, Federal, and State & Local Government Spending on Basic, Social, and Digital Infrastructure. Data available on request.
Source: Department of Commerce, Goldman Sachs Global Investment Research

The State of US Infrastructure

Policy debates often assume that prolonged underinvestment has left US infrastructure in poor shape. But is it really the case that the US invests too little and that our infrastructure is old, in poor condition, and over-utilized, and that it compares poorly with that of other countries?
As a starting point, Exhibit 3 shows the historical evolution of the stock of infrastructure (left) and the flow of new infrastructure investment (right) as a share of GDP, based on data from the new BEA report. The first key takeaway is that neither the total stock of infrastructure nor the flow of investment in infrastructure as a share of GDP are low relative to their historical averages. In fact, the stock of infrastructure is moderately above its average since 1950, while investment is only slightly below. At the category level, however, investment in basic infrastructure has declined.
The second key takeaway is that the composition of US infrastructure has changed significantly. The private sector has played a growing role in infrastructure investment since the 1980s and now accounts for 65% of new infrastructure investment, versus a historical average of 55%.[2] This shift partially reflects declining investment in basic public infrastructure, but also changes in the relative importance of different categories. In particular, social and digital infrastructure have accounted for a growing share of investment in recent decades, areas where the private sector has historically played a larger role.

Exhibit 3: The Total Stock of Infrastructure and the Flow of New Investment As a Share of GDP Are Near Average Historical Levels, with the Private Sector Playing a Growing Role

3. The Total Stock of Infrastructure and the Flow of New Investment As a Share of GDP Are Near Average Historical Levels, with the Private Sector Playing a Growing Role. Data available on request.
Source: Department of Commerce, Goldman Sachs Global Investment Research
What about the quality of US infrastructure? Some measures send a worrisome signal. Road congestion and traffic delays have both steadily increased since 1980 (Exhibit 4, left), indicating that transportation infrastructure hasn’t kept up with rising usage. Other measures suggest that some infrastructure has become less efficient over time. For example, electricity production capacity utilization has trended down since 2000, but blackouts due to major disruptions have become more frequent (Exhibit 4, right).

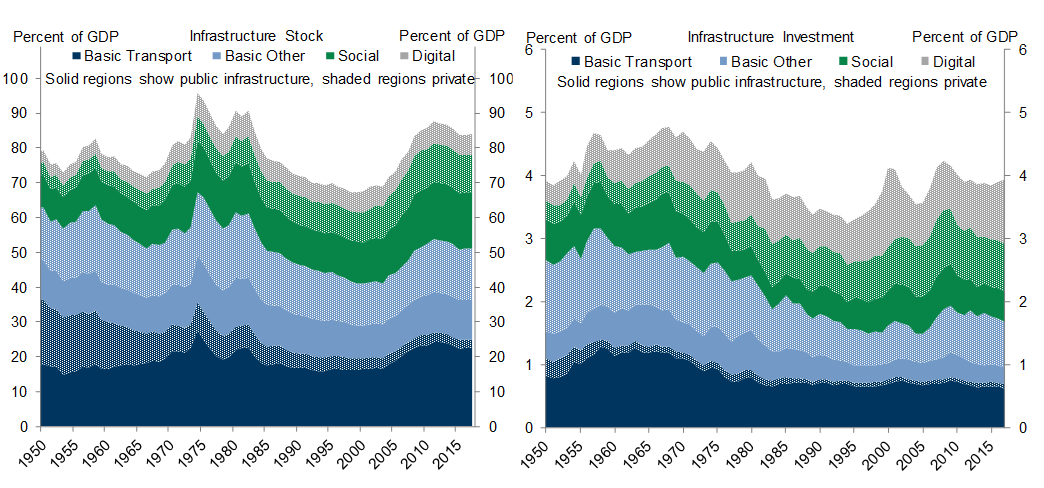
Exhibit 4: Existing US Infrastructure Shows Growing Signs of Strain

4. Existing US Infrastructure Shows Growing Signs of Strain. Data available on request.
Source: Department of Transportation, Energy Information Administration, Texas Transportation Institute
Another concern is that much of the core infrastructure in the US was constructed in the 1950s and 1960s and is getting old. The left side of Exhibit 5 shows the average share of expected useful service life remaining for various types of infrastructure. Remaining service life for all categories has trended downward over the last 40 years, and is especially low for highways and streets (36% of service life remaining), power structures (39%) and conservation and development structures such as dams and sea walls (40%). While older infrastructure isn’t necessarily a problem—for example, many existing roads are of higher quality today than when they were first constructed due to maintenance investments[3]—it can be less reliable and more costly to maintain.
We estimate that it would cost $2-4tn to restore the average age of the public core infrastructure stock to its 1970 level, with highway restoration accounting for much of the cost, as shown on the right side of Exhibit 5. Our low cost estimate assumes that new infrastructure would replace old infrastructure that is already at the end of its useful service life, while our high cost estimate assumes that new infrastructure would replace old infrastructure whose age is average for the existing stock.

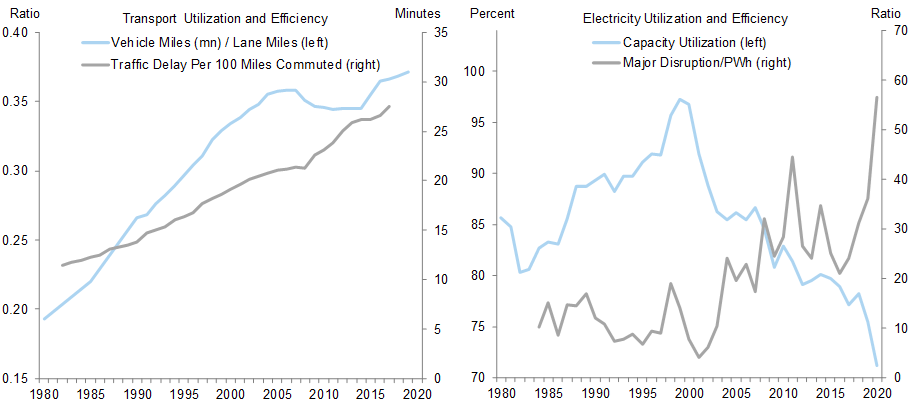
Exhibit 5: US Infrastructure Has Aged Considerably in Recent Decades; Restoring It to the Average Age in the 1970s Would Cost $2-4tn

5. US Infrastructure Has Aged Considerably in Recent Decades; Restoring It to the Average Age in the 1970s Would Cost $2-4tn. Data available on request.
Source: Department of Commerce, Goldman Sachs Global Investment Research
International comparisons provide another perspective on US infrastructure quality. In the World Economic Forum’s annual Global Competitiveness Report, the US receives a high overall score for infrastructure quality, a bit above what its income level would suggest (Exhibit 6, left). The US ranking has improved over the last decade both overall and in most major categories, although the US compares more poorly on internet bandwidth, hospital capacity, and electricity infrastructure (Exhibit 6, right).

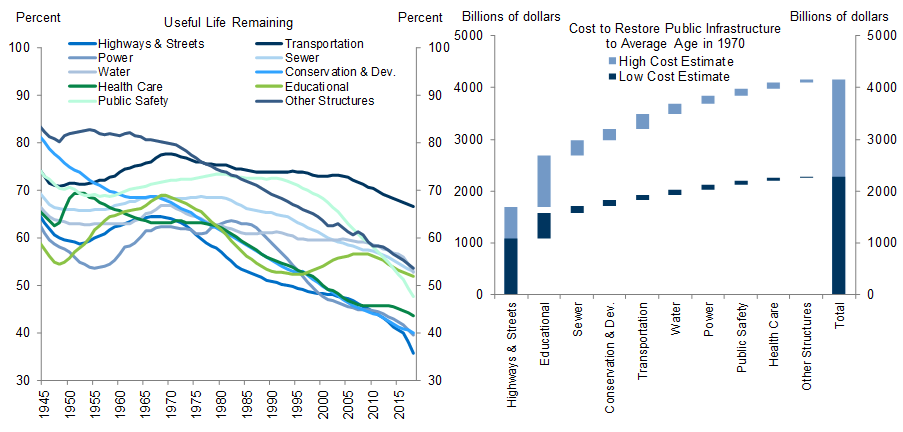
Exhibit 6: International Comparisons of Infrastructure Quality Rank the US Well, With Some Exceptions

6. International Comparisons of Infrastructure Quality Rank the US Well, With Some Exceptions. Data available on request.
Source: World Economic Forum, Goldman Sachs Global Investment Research
A final, more theoretical way to assess the adequacy of US infrastructure is to compare the current levels of the stock and net investment as a share of GDP with the optimal values implied by an economic model. Economist Valerie Ramey estimates the optimal levels by weighing the short- and long-run boosts to output against the costs of financing public investment and crowding out private investment.[4] The optimal level depends on the rate of depreciation and the elasticity of private-sector output to the stock of public infrastructure, but for most reasonable values the current US infrastructure stock appears somewhat below the optimal level while investment appears somewhat above it (Exhibit 7).

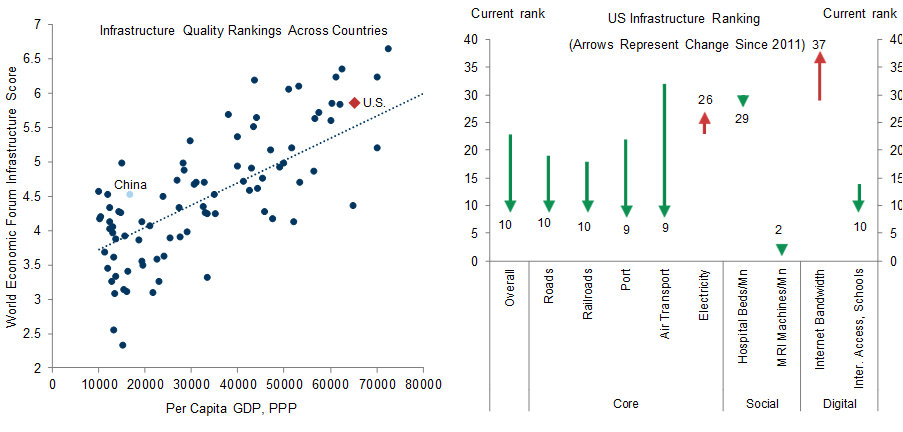
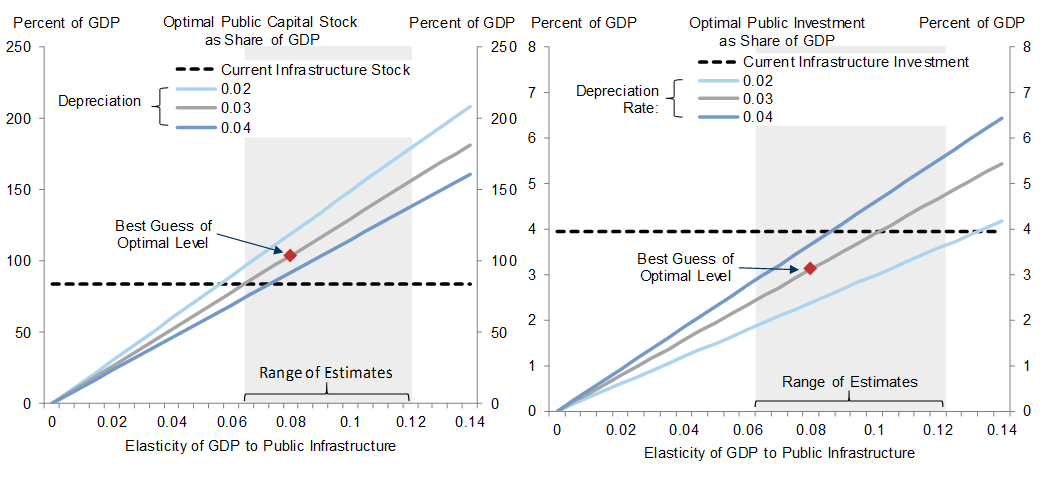
Exhibit 7: The Current US Infrastructure Stock Is Somewhat Lower Than the Optimal Amount Implied by an Economic Model, but Current Investment Is Somewhat Higher

7. The Current US Infrastructure Stock Is Somewhat Lower Than the Optimal Amount Implied by an Economic Model, but Current Investment Is Somewhat Higher. Data available on request.
Source: Ramey (2020), Goldman Sachs Global Investment Research
Taken together, the evidence above suggests that while US infrastructure is not in as poor shape as sometimes claimed, although there are clearly areas of weakness and opportunities for improvement.

The Infrastructure Package and GDP

The White House’s infrastructure proposal would increase GDP in two ways. First, the increase in investment will directly boost output when the spending occurs. Second, the increase in productive public capital resulting from this investment will eventually raise the level of potential GDP.
The direct effect is more straightforward. Exhibit 8 shows an estimated timeline for the new infrastructure spending that we expect to be enacted, net of overlap with existing investment. The infrastructure spending amounts to about ¼% of GDP in 2022 and then peaks at ½% from 2023-2026, when basic and social infrastructure projects are likely to ramp up. The new spending would raise total infrastructure investment to around 4.5% of GDP, the highest level since the early 1970s. Infrastructure is only one piece of the next round of fiscal measures that we expect. Our forecast pencils in a total of about 1% of GDP per year from 2022-2024 in spending on infrastructure as defined here, related measures including incentives for manufacturing and R&D, and social benefits including extension of the increased child tax credit.

Exhibit 8: We Expect Congress to Enact 3.3 Percent of GDP In Additional Infrastructure Spending Over the Next 10 Years, Much of It to Fund Basic Transportation Infrastructure

8. We Expect Congress to Enact 3.3 Percent of GDP In Additional Infrastructure Spending Over the Next 10 Years, Much of It to Fund Basic Transportation Infrastructure. Data available on request.
Source: Department of Commerce, Goldman Sachs Global Investment Research
Estimating the impact on long-term potential GDP is more difficult. Infrastructure can raise potential output in many ways. Most obviously, by lowering transportation costs, it provides access to larger markets and cheaper inputs, allowing for greater specialization and improved productivity.
Economic studies find that the effect of public infrastructure investment on potential output varies across projects. Public investment in “core” infrastructure like transportation or utilities tends to have higher economic returns than investment in “non-core” infrastructure, and early core projects such as the construction of the interstate highway system are likely to have higher returns than later projects that come once the infrastructure stock is already highly developed.[5] As a result, economists generally believe that in the U.S., the highest economic returns to investment come from maintaining existing infrastructure rather than from new projects.[6]
Studies that attempt to quantify the long-run economic effects of infrastructure investment generally take one of two approaches. Newer studies usually model the relationship between public investment, output, and other economic variables and then estimate the model using historical data.[7] Some older studies instead compare changes in productivity in industries or regions that received more infrastructure investment to changes in those that received less. These studies might underestimate the impact of public infrastructure investment if they fail to capture spillovers beyond the industries or regions studied, but they overestimate it if the required financing crowds out private sector investment.[8]
Exhibit 9 summarizes these studies. On average, they estimate that a 1% increase in the public capital stock raises the level of long-run output by about 0.1%, with somewhat larger effects from core infrastructure than from other projects.[9] Applying these numbers to the White House infrastructure proposals and accounting for the larger impact of core infrastructure implies that they would eventually raise the long-run level of potential output by a bit less than ½%. This does not account for any effects of “intangible infrastructure” investments in research and development or any effects of proposed social benefits on potential labor supply, both of which are beyond the scope of our analysis.

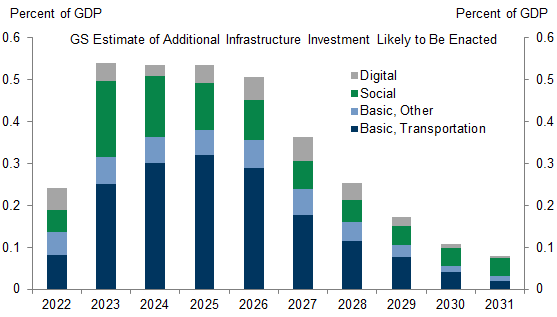
Exhibit 9: Economic Studies Estimate That a 1% Increase in the Public Infrastructure Stock Boosts Potential GDP by About 0.1%

9. Economic Studies Estimate That a 1% Increase in the Public Infrastructure Stock Boosts Potential GDP by About 0.1%. Data available on request.
Source: Bom and Ligthart (2013), Melo et al. (2013), Boukaez (2017), Agenor and Neanidis (2015), Congressional Budget Office, Goldman Sachs Global Investment Research
Of course, the intended benefits of the White House’s infrastructure proposals extend beyond raising GDP. As we noted last week, much of the American Jobs Plan is dedicated to clean energy and environmental goals that would be achieved with significantly expanded tax incentives and green investment projects. The proposals target transportation and electric power utilities in particular because they account for well over half of all carbon emissions. It is too soon to know the final form these environmental policies will take and the impact they will have, but policy changes in other countries have quickly had a meaningful impact on speeding adoption of electric vehicles and renewable sources of electricity generation, as shown in Exhibit 10. The US has fallen behind on these measures, but foreign experience suggests that it is possible to make progress quickly with the right policies.

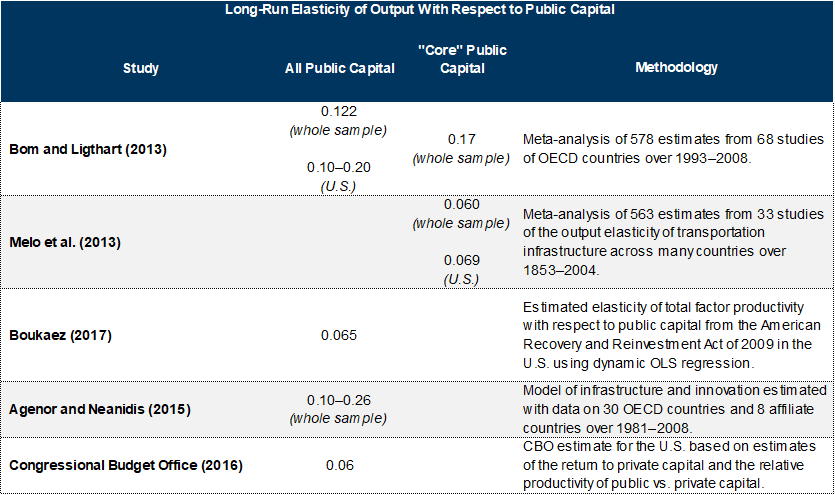
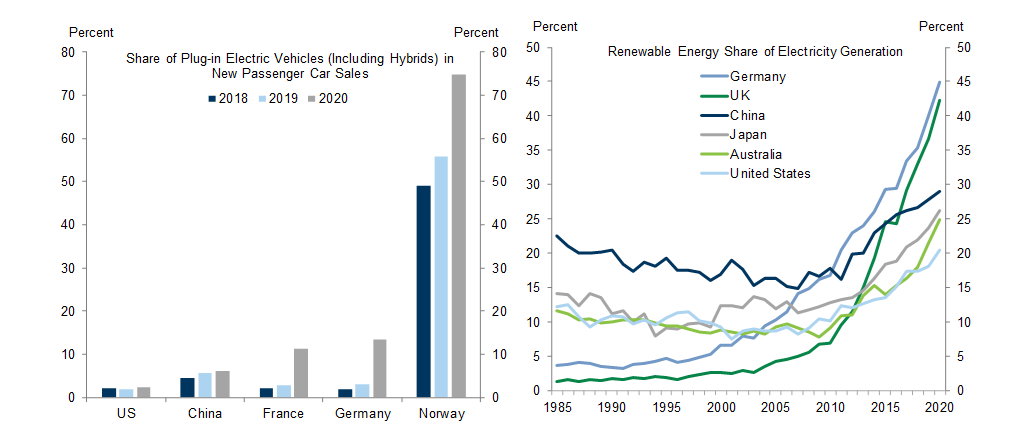
Exhibit 10: Policy Changes Abroad Have Boosted the Electric Vehicle Share of Car Sales and the Renewable Energy Share of Electricity Generation

10. Policy Changes Abroad Have Boosted the Electric Vehicle Share of Car Sales and the Renewable Energy Share of Electricity Generation. Data available on request.
Source: Department of Energy, World Economic Forum, Goldman Sachs Global Investment Research

Joseph Briggs

David Mericle

Laura Nicolae

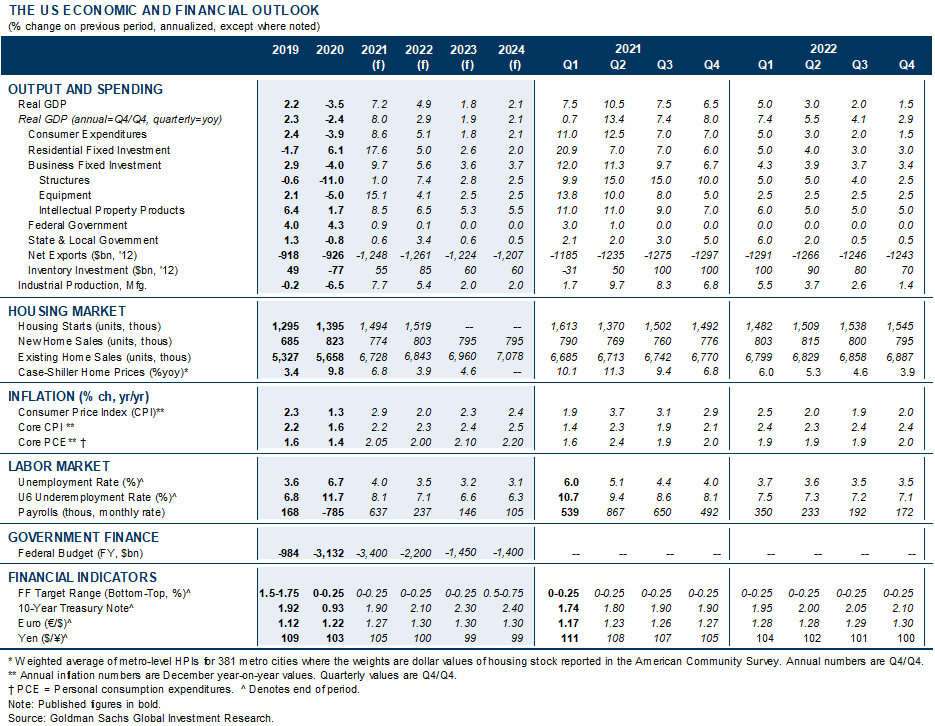
The US Economic and Financial Outlook
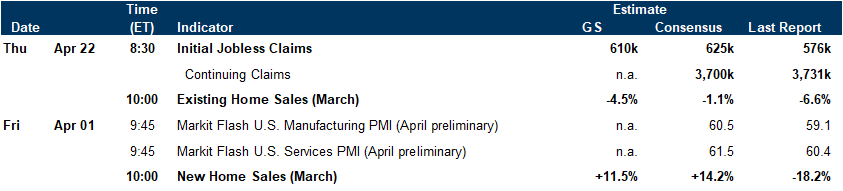
Data available on request.
Source: Goldman Sachs Global Investment Research

Economic Releases

Data available on request.
Source: Goldman Sachs Global Investment Research
  1. 1 ^ Jennifer Bennett, Robert Kornfeld, Daniel Sichel and David Wasshausen, “Measuring Infrastructure in the Bureau of Economic Analysis National Economic Accounts,” December 2020.
  2. 2 ^ The public share of the infrastructure stock is actually above its historical average (59% current vs. 55% historical), but this primarily reflects the relative decline in private capital held in railroads, which are included in the private basic transport region of Exhibit 3.
  3. 3 ^ Matthew Tuner and Geetika Nagpal, “Transportation Infrastructure in the US,” 2019.
  4. 4 ^ Valerie A. Ramey, “The Macroeconomic Consequences of Infrastructure Investment,” 2020.
  5. 5 ^ John Fernald, “Roads to Prosperity? Assessing the Link Between Public Capital and Productivity,” 1999.
  6. 6 ^ Edward Glaeser and James Poterba, “Economic Analysis and Infrastructure Investment,” 2020.
  7. 7 ^ Pierre-Richard Agénor and Kyriakos C. Neanidis, “Innovation, Public Capital, and Growth,” 2015; Hafedh Boukaez et al., “Public Investment, Time to Build, and the Zero Lower Bound,” 2017.
  8. 8 ^ The CBO estimates that a $1 increase in the federal deficit decreases private investment by about 33 cents. See Jeffrey M. Stupak, “Economic Impact of Infrastructure Investment,” Congressional Research Service, 2018.
  9. 9 ^ Estimates for the U.S. range from 0.06 to 0.20, but larger estimates tend to come from studies of older projects that likely had higher returns than current and future projects. Overall, estimates of the long-run output elasticity with respect to the public capital stock have declined over time. See Pedro Jenny Bom and Ligthart, “What Have We Learned from Three Decades of Research on the Productivity of Public Capital?” 2013.

Investors should consider this report as only a single factor in making their investment decision. For Reg AC certification and other important disclosures, see the Disclosure Appendix, or go to www.gs.com/research/hedge.html.