Following a year of delay, the Euro 2020 will finally go ahead on June 11. As the excitement for the tournament builds, we construct a statistical model to simulate the European Cup, which we intend to update as the tournament progresses.
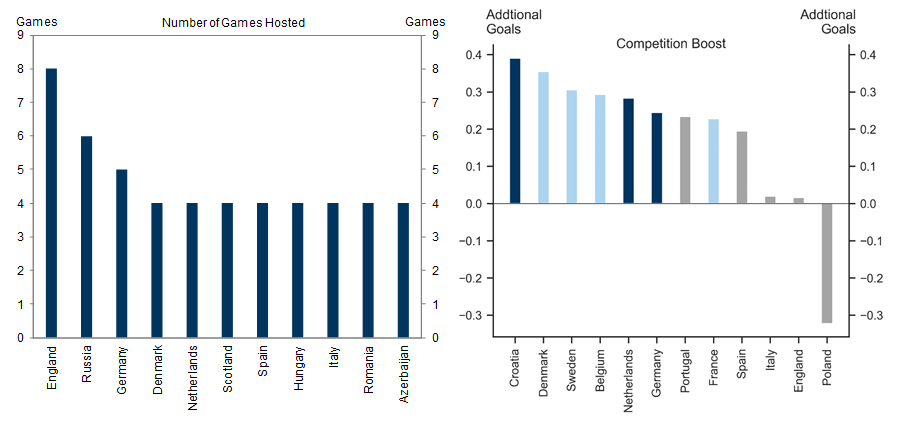
We start by modelling the number of goals scored by each team using a large dataset of international football matches since 1980. We find that the number of goals scored by each team can be explained by (1) the strength of the squad (measured with the World Football Elo Rating), (2) goals scored and conceded in recent games (capturing the side’s momentum), (3) home advantage (which is worth 0.4 goals per game) and (4) a tournament effect (which shows that some countries tend to outperform at tournaments compared to their rating).
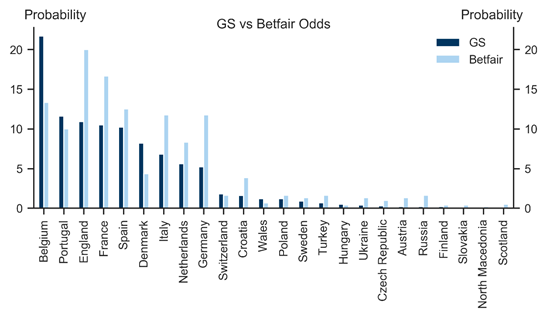
We then simulate the tournament using our estimated scoring model. Our framework predicts that Belgium will win the Euros for the first time in history, narrowly beating Portugal on July 11. The reason the model gives Belgium the edge is primarily its high Elo score, where it is ranked first amongst European nations. That said, we see a close race between Belgium, Italy, Portugal and Spain, which make it to the semi-finals.
Our simulations provide a number of interesting predictions beyond this. First, we forecast that Germany will make it out of its difficult group ahead of France, but then lose to England at Wembley during the round of 16, as Germany’s low Elo ranking more than outweighs its positive tournament effect. Second, Denmark is projected to do well in this tournament, winning its group and losing only to Italy in the quarterfinals. Third, while France—as world champion—has a high Elo score, Les Bleus are penalised in our model by a difficult group, lack of home advantage and negative momentum in recent games.
It is difficult to assess how much faith one should have in these predictions. While we capture the stochastic nature of the tournament carefully, we also see that the forecasts are highly uncertain, even with sophisticated statistical techniques, simply because football is quite an unpredictable game. This is, of course, precisely why football is so exciting to watch.
Euro 2020—Modelling the Beautiful Game
Scoring Goals
Exhibit 1: Goals Scored
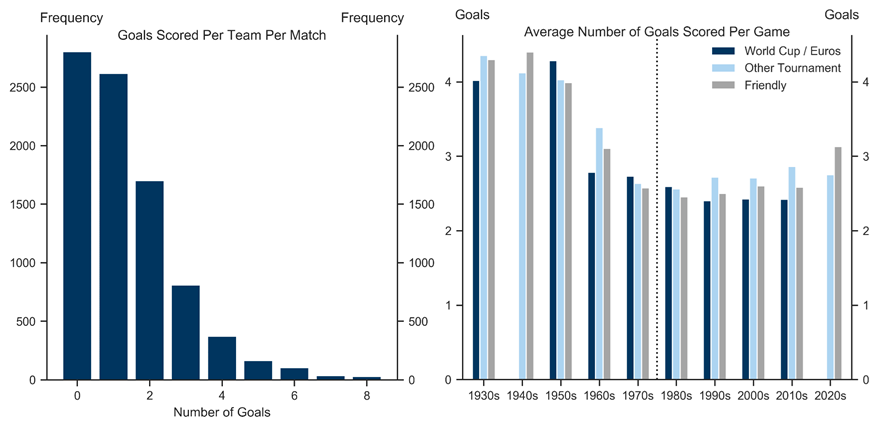
Exhibit 2: The Strength of a Team
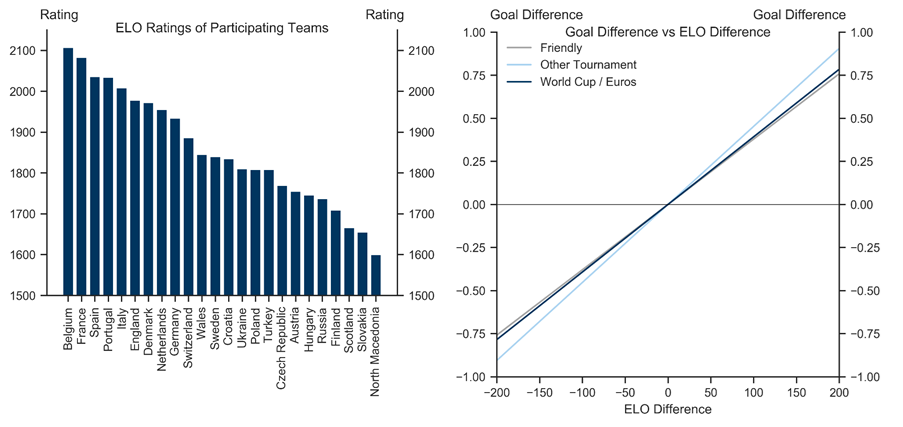
Exhibit 3: A Football Model
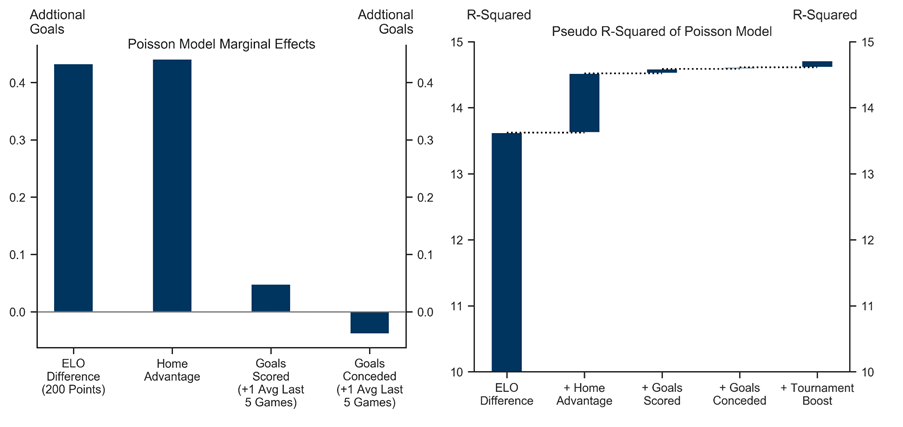
Exhibit 4: Home Advantage and Tournament Teams
Picking a Winner
Exhibit 5: The Knockout Stage
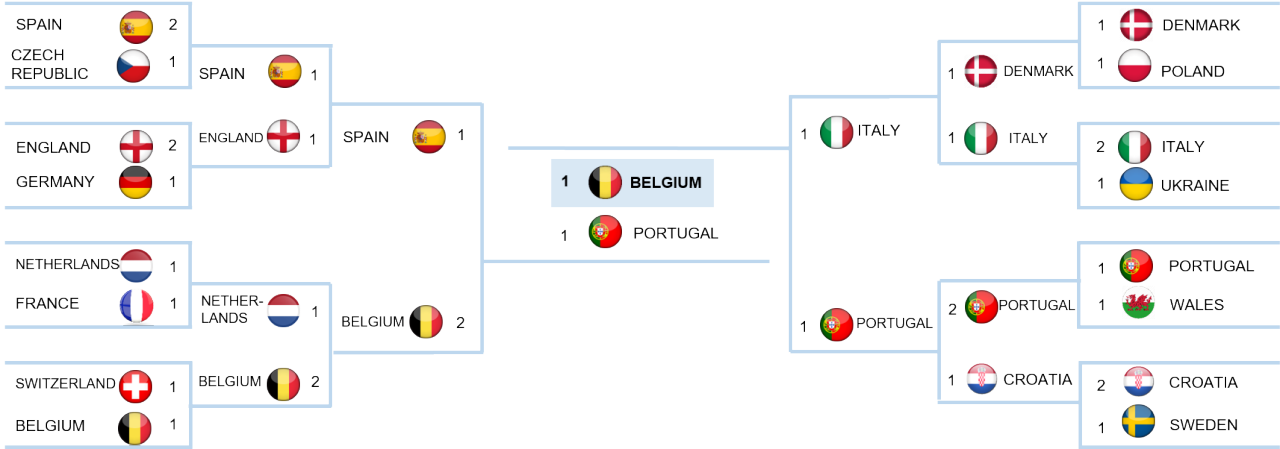
Exhibit 6: The Chance of Success
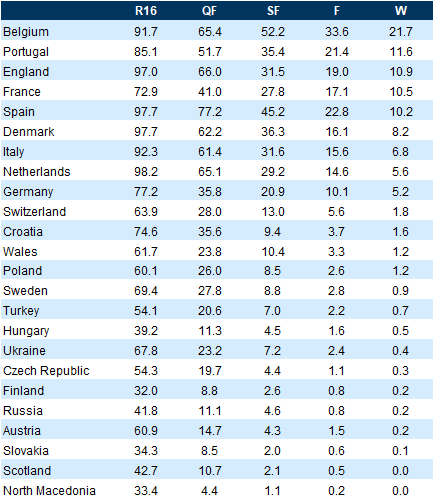
Exhibit 7: The Path to Glory
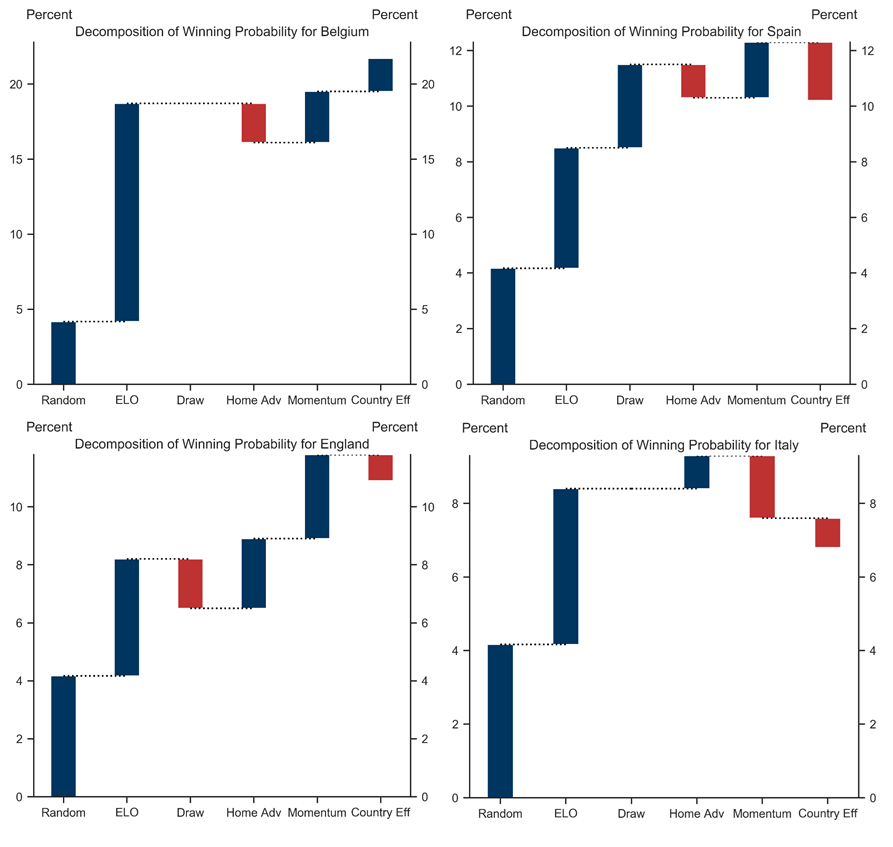
Exhibit 8: GS vs. Betting Odds
Skill and Luck
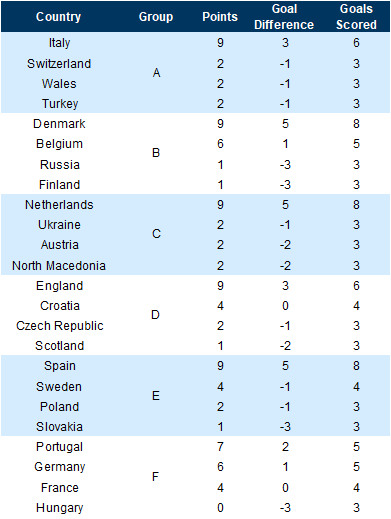
Appendix: Group Results
Exhibit 9: Model Predictions for the Group Stage
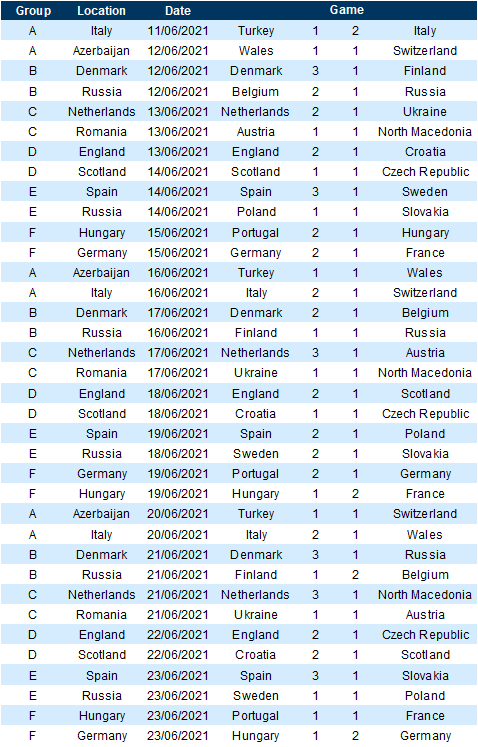
Exhibit 10: Model Predictions for the Group Outcomes

Investors should consider this report as only a single factor in making their investment decision. For Reg AC certification and other important disclosures, see the Disclosure Appendix, or go to www.gs.com/research/hedge.html.