Goldman Sachs Research
US Economics Analyst
No Taxation Without Emigration (Briggs)
31 May 2021 | 7:53AM EDT | Research | Economics| By Jan Hatzius and others
More
  • The Tax Cuts and Jobs Act (TCJA) capped state and local tax (SALT) deductions against federal income taxes, effectively raising state and local (S&L) taxes and increasing incentives for high-income households to relocate to low-tax states. More recently, two proposed policy changes—a lifting of the cap on SALT deductions, and state income tax increases on high earners—have revived questions about whether S&L tax increases induce migration from high- to low-tax states, and how such moves might affect S&L budgets.

  • The incentives to migrate for tax reasons can be quite large—for example, the TCJA’s cap on S&L tax deductions effectively raised total taxes on top earners in California and New York by over 4pp, to as much as 12pp more than they would pay in states without income taxes. Consistent with prior academic studies, we find small increases in population outflows from high-tax to low-tax states after the SALT deduction cap went into effect.

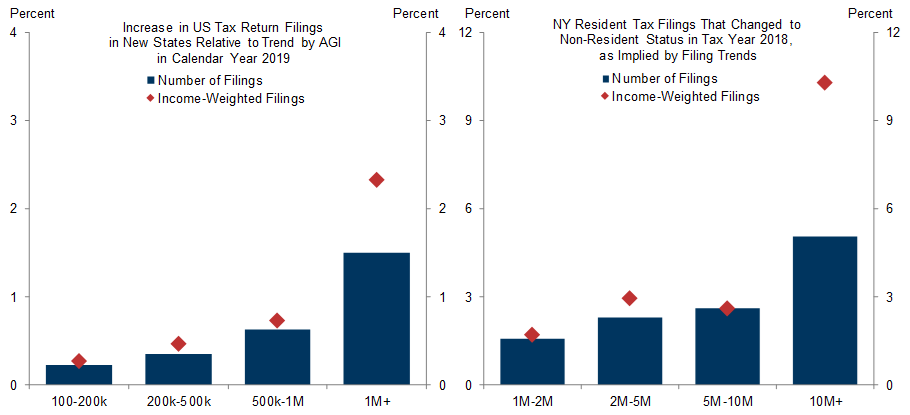
  • Of course, tax-based migration incentives were largest for high-earning households, and IRS tax filings by income levels suggest that around 1.5% of households earning over $1M moved to low-tax states after the SALT deduction cap was introduced, relative to the prior trend. Furthermore, trends in New York resident and non-resident tax filings suggest that over 5% of households earning over $10M per year left the state due to the SALT deduction cap.

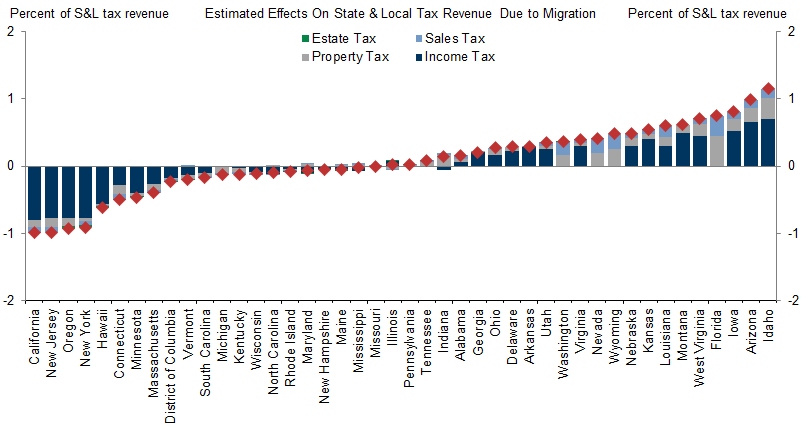
  • We estimate that the SALT deduction cap lowered tax revenues in high-tax states by up to 1% due to tax revenue declines from emigration. Although revenue increases in lower-tax states that experienced more in-migration partially offset these declines, we estimate that aggregate S&L tax revenues declined by just under 0.5% due to the SALT deduction cap.

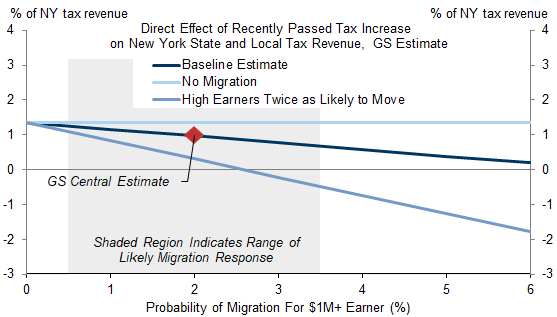
  • Looking ahead, our baseline assumption is that Congress will raise the cap on SALT deductions to $50k, which should slow but not reverse the recent tax-driven migration. However, tax hikes on high-income households like the one that recently passed in New York will likely increase emigration from high-tax areas. After modeling the New York tax change, we estimate that the loss from emigration will offset about 30% of the revenue increase from higher taxes, although the post-pandemic uncertainty is large and skewed to the higher side.

No Taxation Without Emigration

The Tax Cuts and Jobs Act (TCJA) capped state and local tax (SALT) deductions against federal income taxes at $10k through 2025, effectively raising state and local (S&L) taxes and increasing incentives for high-income households to relocate to low-tax states. More recently, two proposed policy changes—a lifting of the cap on SALT deductions, and state income tax increases on high earners—have revived questions about whether S&L tax increases induce migration from high- to low-tax states, and how such moves might affect S&L budgets. We examine both of these questions in this week's US Economics Analyst.

Benchmarking Emigration Incentives and Responses

To first highlight how the TCJA changed interstate migration incentives, Exhibit 1 plots the percent of pre-tax income that a married couple jointly filing in high-tax locations like New York City (left chart) and California (right chart) would save in federal income taxes by moving to states without S&L income taxes and low property taxes if SALT deductions are uncapped (pre-2018 law, dark blue bars) and limited to $10k (current law, light blue bars).
Although emigration incentives increased for households making over $100k, emigration incentives increased by much more for higher-income households.[1] For example, the potential savings for households earning $500k/year increased by 3pp of pre-tax income in both California and New York, and by over 4pp for households making over $10M/year. These estimates are actually conservative since they do not factor in S&L taxes besides income and property taxes, but they illustrate that SALT deduction cap significantly increased the financial incentives to leave high-tax states.

Exhibit 1: Caps on SALT Deductions Effectively Lowered Income in High-Tax States

1. Caps on SALT Deductions Effectively Lowered Income in High-Tax States. Data available on request.
Source: Internal Revenue Service, Goldman Sachs Global Investment Research
Of course, very few households rank the effective tax rate as the primary consideration when choosing where to live, and moving to a new state typically entails significant financial, social, and time costs. Furthermore, very few households—particularly those in high-tax cities—could relocate freely without taking a cut in pre-tax income. How much increases in effective tax rates increase interstate migration and the implications for S&L budgets is therefore an empirical question that must be evaluated using historical data.
To help benchmark the typical migration response to tax changes, we first review the academic literature (Exhibit 2). Most studies focus on high-income households because lower-and middle-income households are less responsive to tax changes, and estimates of migration responses to tax changes vary substantially across studies. However, most find that tax increases encourage emigration, and the median study suggests a 2% decline in the number of top-income earners after a 1pp relative increase in a region’s tax rate. Based on estimates from prior episodes and before Congress passed the TCJA in 2017, we guessed[2] that the SALT deduction caps could eventually lower the number of top-income earners in high-tax states by 2-4%.

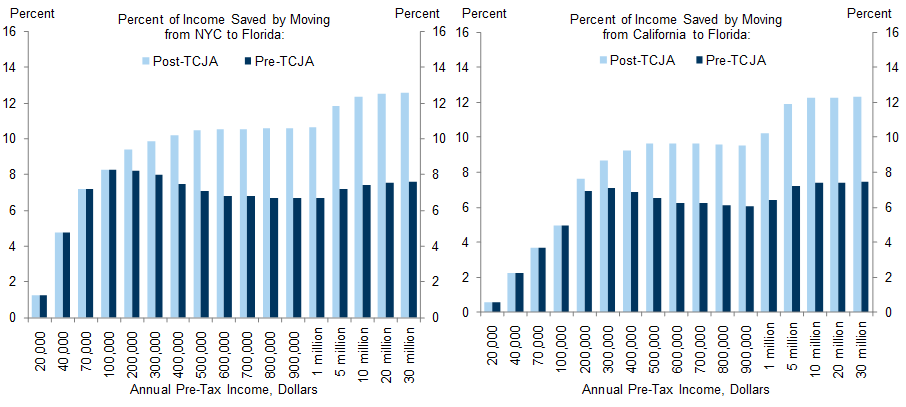
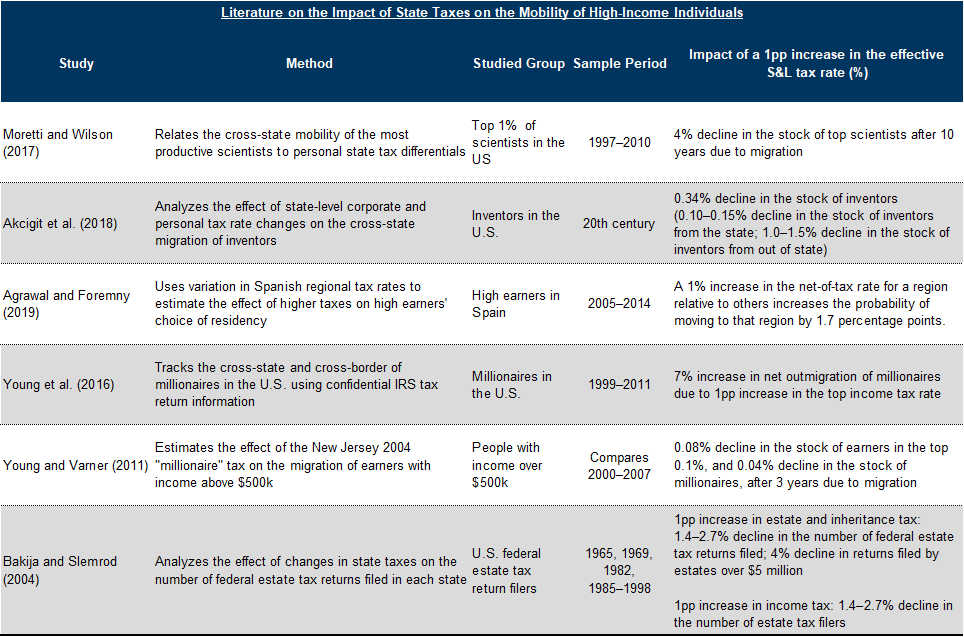
Exhibit 2: Academic Studies Suggest That Increases in Tax Differentials Across States Encourage Emigration

2. Academic Studies Suggest That Increases in Tax Differentials Across States Encourage Emigration. Data available on request.
Source: Goldman Sachs Global Investment Research
There are several caveats to bear in mind when forecasting the migration responses to tax increases based on academic studies. First, most studies focus on a very specific sample, so the effects of tax changes on migration of the general population are uncertain. Relatedly, effects are context specific and depend heavily on the exact policy change and particularly on whether a low-tax location is easily accessible. Finally, barriers to migration have declined as technological innovation has made it easier for some households to work remotely. In the current environment—where the pandemic caused many people to leave high-cost cities[3] and accelerated adoption of technology that facilitates working from home[4] —the migration response to tax changes is likely stronger than normal, and prior empirical estimates are probably a lower bound.

The SALT Deduction Cap and Interstate Migration

The IRS recently released updated migration data that allow us to estimate the effect of SALT deduction caps on migration, although there are two statistical challenges. First, migration rates vary over time for reasons unrelated to tax policy changes. Second, households had on net migrated from high- to low-tax states in the years before the TCJA was passed, as evidenced by the higher outflows from high- to low-tax states in the left chart of Exhibit 3.
In the right chart of Exhibit 3 we normalize the outflows to check whether migration from high- to low-tax states accelerated after SALT deduction caps were introduced. There are some differences in the years prior to the policy change, and outflows from high- to low-tax states and low- to high-tax states fell similarly in 2017-2018. However, outflows from high- to low-tax states remained relatively stable while outflows from low- to high-tax states fell further in 2018-2019, suggesting that the SALT deduction caps may have increased net migration from high- to low-tax states.

Exhibit 3: Households Were Already Migrating From High- to Low-Tax States Before SALT Deductions Were Introduced, But Net Outflows May Have Accelerated Slightly in 2018-2019

3. Households Were Already Migrating From High- to Low-Tax States Before SALT Deductions Were Introduced, But Net Outflows May Have Accelerated Slightly in 2018-2019. Data available on request.
Exhibit 3 controls for population growth by scaling each state’s population relative to its 2009 level before aggregating into tax-rate groupings. Tax-rate groupings are defined by terciles of total tax burden from income, property, and sales tax.
Source: Internal Revenue Service, Goldman Sachs Global Investment Research
The evidence in Exhibit 3 is only suggestive, however, since the groups are aggregated at a high level and other factors may explain the divergence between high-to-low and low-to-high outflows in 2018-2019. In Exhibit 4, we therefore estimate the relationship between effective tax rate differences and migration using a panel of state-pair outflows from 2010-2019.[5] In our regressions, the outcome variable is the percent change in annual migration between states, and the coefficients of interest are the interaction between effective tax rate differences and the years when SALT deductions were capped.
In the first column, we find that higher tax differentials significantly predicted higher outflows across states from 2010-2019 as a whole, and that the effect was larger in 2018-2019 by a statistically significant amount. In contrast, we find no difference from the sample average effect in 2017-2018, possibly because moving takes time and most households reported residency for IRS purposes when they filed taxes in early 2018. The second column—which controls for matched state-pair fixed effects instead of origin state-fixed effects—finds very similar results.

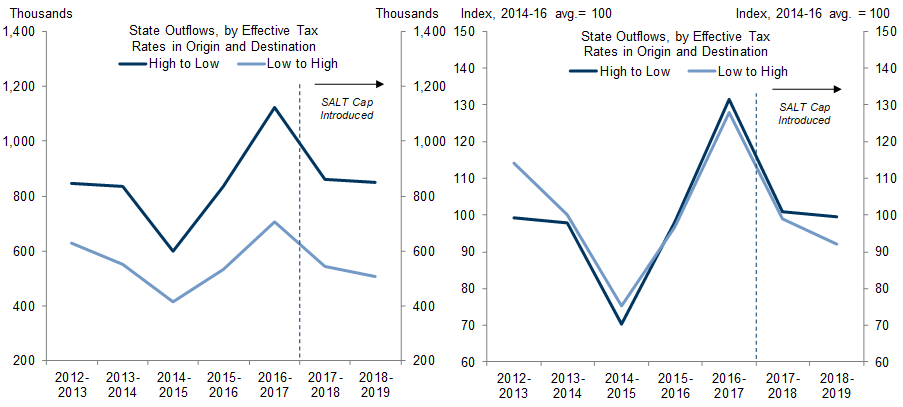
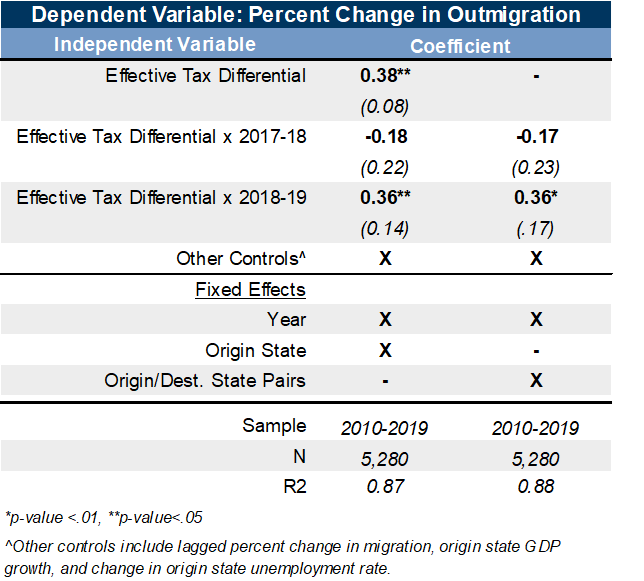
Exhibit 4: Regression Analysis Also Suggests That Effective Tax Rate Differentials Had Larger Effects on Outmigration in 2018-19 Than in Previous Years

4. Regression Analysis Also Suggests That Effective Tax Rate Differentials Had Larger Effects on Outmigration in 2018-19 Than in Previous Years. Data available on request.
Source: Internal Revenue Service, Goldman Sachs Global Investment Research
Although the relationship between effective tax rate differences and outflows is statistically significant, the implied effect is very small. For example, multiplying the 4pp average difference in effective tax rates between New York and other states by the 2018-2019 coefficient (.36) suggests that outflows increased by roughly 1.4% in 2018-2019. In recent years, annual outflows in New York totaled about 2% of its population, so only 1.4%*2%≈.03% of New York’s population—or a bit less than 6000 taxpayers—left the state in response to SALT deduction caps in 2018-2019. Because our analysis focuses on state pairs, we can also apply our model to calculate the effect on inflows in low tax states. For example, tax burdens in Florida are about 2pp less than average and recent inflows have totaled about 3% of its population, so our model suggests that the SALT deduction cap increased inflows by about 2pp*3%*.36=.02% of Florida’s population—or a bit more than 4,000 tax payers.

SALT Deduction Caps and Emigration of High Earners

Of course, migration incentives mostly increased for households earning a high level of income, so it’s not surprising that the effects for the general population are small. We therefore next focus on higher-income households that have higher incentives to migrate by analyzing a second IRS data set that records tax-filings by income levels for each state, with residency determined by the address on the federal tax return.
In the left chart of Exhibit 5, we compare trends in tax return filings with over $1M in adjusted gross income (AGI) for three groups of states: states without income taxes (dark blue line), the top-ten highest taxed states (gray line), and all other states (light blue line).[6] Before the TCJA passed, the number of $1M+ tax returns followed a similar trend across all groups, suggesting that common factors—e.g. the ups and downs of the business cycle—determined the number of $1M+ filings and that interstate migration patterns were stable. However, filings in states without income taxes increased sharply starting in 2018 while filings in highly-taxed states grew relatively little, suggesting the TCJA and SALT deduction cap affected residency decisions of high earners.
We also see informative patterns in specific states, as illustrated in the right chart of Exhibit 5. California’s share of $1M+ tax returns grew steadily prior to the TCJA but decelerated in 2018 and 2019, lowering its share by over 1pp relative to the pre-TCJA trend. In contrast, Florida’s share of total $1M+ tax filings was relatively stable before the TCJA, but jumped by 1-2pp in 2018 and 2019.

Exhibit 5: High-Income Tax Filings Increased in States Without State Income Taxes After Caps on SALT Deductions Went Into Effect

5. High-Income Tax Filings Increased in States Without State Income Taxes After Caps on SALT Deductions Went Into Effect. Data available on request.
Source: Internal Revenue Service, Goldman Sachs Global Investment Research
In Exhibit 6 we use the pre-TCJA trend in each state’s share of total $1M+ tax return filings to construct a counterfactual estimate of filings if the SALT deduction caps were never implemented. We then plot the implied percent change in each state’s $1M+ tax filings due to the SALT deduction cap against its top marginal tax rate.
This exercise shows that $1M+ tax filings decreased in high-tax states like California, Connecticut, New Jersey, and New York, and increased in states without state income taxes like Florida, Nevada, and Washington in 2019. While other state-specific factors also contributed to deviations from pre-TCJA trends, the clear negative relationship between changes in $1M+ tax filings and tax rates indicates that the SALT deduction cap encouraged a meaningful number of high-earners to move from high- to low-tax states.

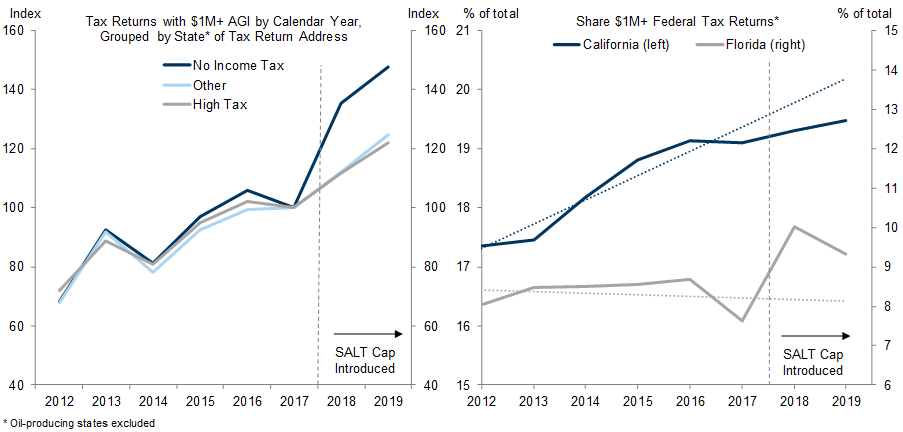
Exhibit 6: Tax Filings From Households Earning $1M+ in Income Decreased in High-Tax States and Increased in Income Tax Free States in Calendar Year 2019

6. Tax Filings From Households Earning $1M+ in Income Decreased in High-Tax States and Increased in Income Tax Free States in Calendar Year 2019. Data available on request.
Source: Internal Revenue Service, Goldman Sachs Global Investment Research
To evaluate how much of the movement from high- to low-tax states in Exhibit 6 is explained by the TCJA, we repeat our estimates for calendar years 2015-2017, three years when SALT deduction caps would not have influenced interstate migration. We then compare the average gross migration from these estimates with the estimate from 2019 to assess how many high-income households moved specifically due to the SALT deduction cap. We also construct corresponding estimates for income levels below $1M, and repeat this exercise using changes in total AGI instead of tax filing counts to construct income-weighted estimates.
We estimate that about 1.5% of households earning over $1M moved states by 2019 in response to the SALT deduction caps, as did 0.7% of households earning $500k-$1M (Exhibit 7, left chart). On an income-weighted basis, we estimate that over 2.3% of households earning $1M+ moved to a new state—a 60% increase relative to our unweighted estimate—suggesting that the migration response of very-high earners was even larger.
To zero in on very high-income households, in the right chart of Exhibit 7 we construct similar estimates using New York state tax data on resident and non-resident fillings of households earning over $1M. Nonresident and resident filings followed very similar trends before the TCJA passed, but diverged sharply after SALT deduction caps were introduced in 2018, with nonresident filings notably increasing and resident filings slightly declining.[7] Assuming that resident and non-resident filings would otherwise have instead followed common trends, our analysis suggests that over 5% of households earning over $10M changed residency for tax purposes in 2018, as did 2-3% of households earning $2-5M or $5-10M. Moreover, results are again larger on an income-weighted basis for households in the top income group, which suggests a very strong migration response for the highest-earning households.

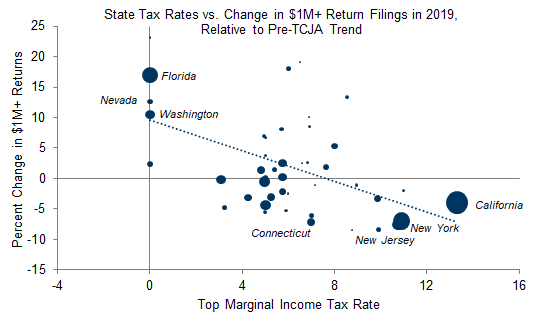
Exhibit 7: High-Income Households Were More Likely to Move to New States Due to the SALT Deduction Cap, and Very High-Income New York Residents Were Even More Likely to Move

7. High-Income Households Were More Likely to Move to New States Due to the SALT Deduction Cap, and Very High-Income New York Residents Were Even More Likely to Move. Data available on request.
Source: Internal Revenue Service, New York State Department of Taxation and Finance, Goldman Sachs Global Investment Research

The Impact of SALT Deduction Caps on State and Local Budgets

The documented migration responses, particularly for high-earning households, have significant implications for S&L budgets. We use our state-level migration estimates from Exhibit 6 (scaled down to account for baseline migration patterns not explained by the SALT deduction caps) to estimate how SALT deduction caps affected each state’s income, property, sales, and estate tax revenue, and then add these together to arrive at an overall budget impact.
  • Income Tax – We use our estimates of income-weighted net migration by income group and state and apply the appropriate tax rate for each state and income group to estimate the change in income tax revenue.

  • Property Tax – We first use the Federal Reserve’s Survey of Consumer Finances (SCF) to calculate the average primary residence value by income level, and apply the effective property tax rate for the largest city in each state to estimate annual property tax payments per household. We then multiply by our net migration estimates by state and income levels to estimate the change in property tax revenue.

  • Sales Tax – We first use the Bureau of Economic Analysis’s Consumer Expenditure Survey (CEX) to calculate the share of income spent on taxable items. We then apply the general sales tax rate for the largest city in each state to estimate the annual sales tax payments per household, and multiply by our net migration estimates by state and income levels to estimate the change in sales tax revenue.

  • Estate Tax – For the 13 states with estate taxes, we first use the SCF and state tax laws to calculate the incidence of estate taxes by income group. We then use our net migration estimates for each state and income level to calculate the implied decline in estate tax revenue, and rescale by average estate tax revenue in recent years.

We estimate that the SALT deduction cap lowered tax revenues in high-tax states like California, New Jersey, and New York by up to 1% of state tax revenue (Exhibit 8). Lost income tax revenue accounts for the majority of the decline, although lost property tax revenue also contributes. Adding across all states, we estimate that revenue increases in lower-tax states only partially offset these declines, and that aggregate S&L tax revenues declined by a bit less than 0.5% due to the SALT deduction cap.

Exhibit 8: Interstate Migration Led to Significant Declines in Tax Revenues in High-Tax States Like California, New Jersey, and New York

8. Interstate Migration Led to Significant Declines in Tax Revenues in High-Tax States Like California, New Jersey, and New York. Data available on request.
Source: Internal Revenue Service, Goldman Sachs Global Investment Research
One important caveat to our revenue estimates is that we only account for the direct impacts of migration on tax receipts, and second-round effects–for instance, changes in property values and employment declines due to business migration–may have caused even larger revenue shifts from high- to low-tax states.

How Much Will Emigration Offset the Revenue From New York’s Recent Tax Increase?

Two proposed policy changes—a lifting of the cap on SALT deductions, and state income tax increases on high earners—could impact migration patterns and S&L budgets going forward.
Regarding SALT deduction caps, we expect that Congress will raise the cap to $50k for couples, which would revert tax savings and migration incentives for most households making less than $300k/year to the same as prior to the TCJA. However, our analysis suggests the migration response was much larger for very-high income households that would not benefit as much from this change, and it’s unlikely that households that have already moved would return. Our best guess is that raising the cap on SALT deductions would slow but not reverse out-migration from high tax-states until the caps expire under current law in 2025.
Turning to New York’s recent tax increase—which raised tax rates by 0.8pp for married households earning over $2M and up to 2pp for those earning over $25M—we expect that this policy change will meaningfully increase emigration from New York, which will in turn reduce the almost $3bn in revenue we estimate it would generate if no households moved.
To calculate the New York law’s net revenue impact, we subtract the revenue losses associated with emigration (lower income, property, sales, and estate tax receipts) from the estimated revenue increase. We allow for a stronger migration response due to the increased mobility in the current environment by assuming that the response is as large as after the SALT deduction cap was introduced—which raised effective tax rates by about twice as much as New York’s recent tax increase—and also allow for a stronger response from higher-earning households (as shown in Exhibit 7). Because we see risks as skewed toward a larger migration response if households that left due to the pandemic don’t return, the tax increases push households into a nonlinear part of their response function, or these factors interact positively, we also consider a scenario where high-earning households are twice as likely to move as in our baseline.
Our estimates are shown in Exhibit 9. In our baseline assessment, we expect that the loss from emigration will offset a bit less than 30% of the revenue increase from higher taxes, although the net budgetary impact will remain positive. However, our baseline model also suggests that plausible emigration responses could offset almost 50% of the potential tax revenue increase, and we cannot rule out a net negative revenue impact if the emigration response is much larger than expected. Furthermore, our analysis focuses on overall S&L tax revenue in New York, and because local governments will likely lose tax revenue from emigration but not directly gain revenue from higher state income taxes, the tax change could create budget challenges for some local governments.

Exhibit 9: Increased Revenue From New York’s Income Tax Increase Will Likely More Than Offset Revenue Declines Due to Increased Migration

9. Increased Revenue From New York’s Income Tax Increase Will Likely More Than Offset Revenue Declines Due to Increased Migration. Data available on request.
Source: Goldman Sachs Global Investment Research
Finally, our analysis only accounts for the direct effects of New York’s tax increase, and second-round effects could have significant longer-run budget implications.

Joseph Briggs

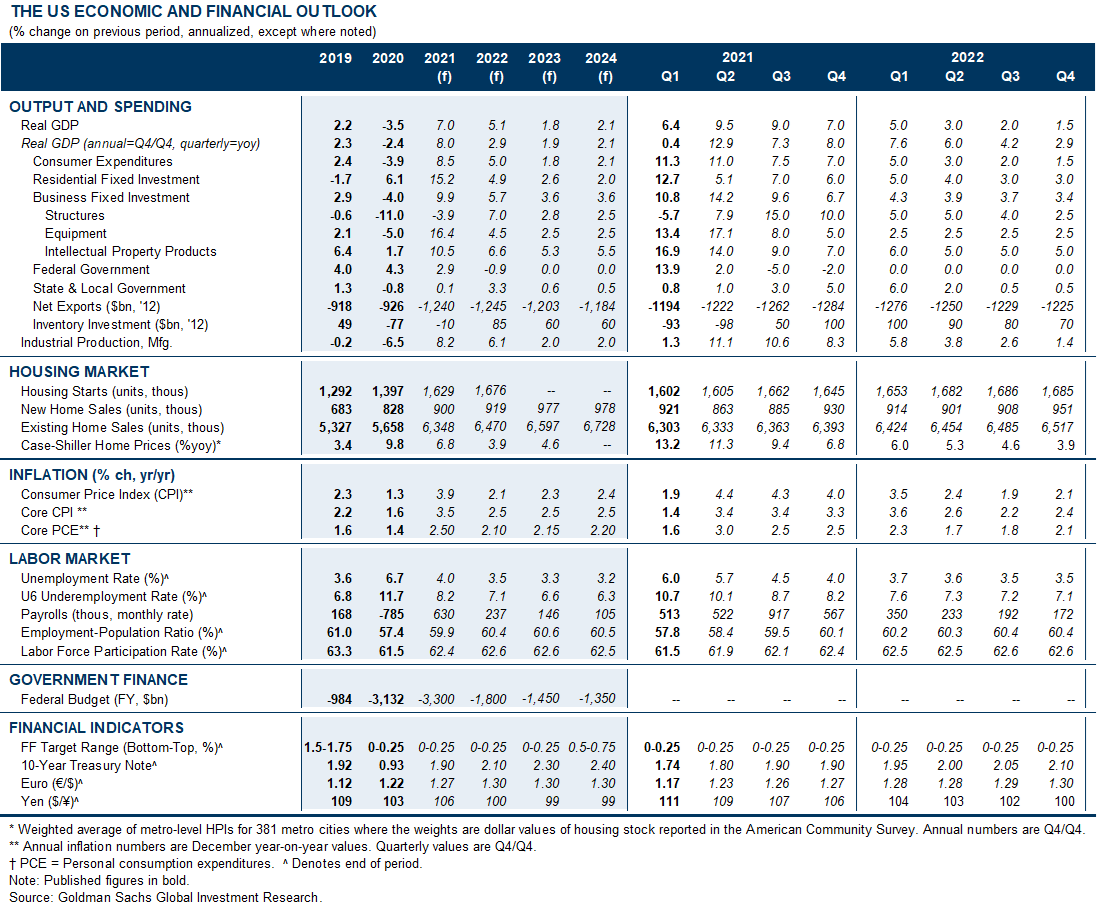
The US Economic and Financial Outlook
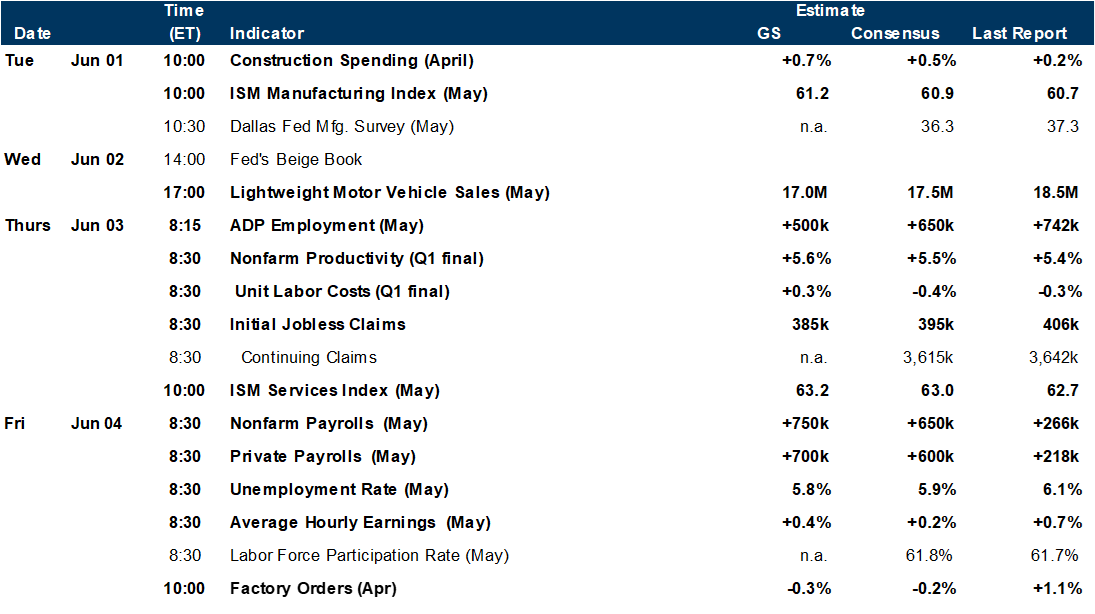
Data available on request.
Source: Goldman Sachs Global Investment Research

Economic Releases

Data available on request.
Source: Goldman Sachs Global Investment Research
  1. 1 ^ Tax incentives for households with incomes below this level were unchanged because most households take the standard deduction.
  2. 2 ^ Struyven, Daan, “Losing My Deduction”, US Economic Analyst, November 24, 2017
  3. 3 ^ Coven, Joshua, Arpit Gupta, and Iris Yao. "Urban flight seeded the covid-19 pandemic across the United States." Available at SSRN 3711737 (2020).
  4. 4 ^ Spencer Hill, “The Work-from-Home Windfall: A Productivity Update”, US Daily, December 23, 2020
  5. 5 ^ We restrict analysis to the top 12 destination states for each origin state to exclude state-pairs for which little interstate migration occurs. Our results are robust to alternative thresholds.
  6. 6 ^ In our analysis we exclude oil-producing states like Texas, Alaska, South Dakota, and North Dakota because the number of $1M+ tax returns is largely determined by transitory oil price shocks, making it difficult to find an adequate control group to test for deviations from trend. Omitting these states likely yields conservative estimates of tax-induced migration, however, since most oil-producing states have low or no income taxes.
  7. 7 ^ Moreover, results are again larger on an income-weighted basis for households in the top income group, which suggests a very strong migration response for the highest-earning households.

Investors should consider this report as only a single factor in making their investment decision. For Reg AC certification and other important disclosures, see the Disclosure Appendix, or go to www.gs.com/research/hedge.html.