In this week’s Analyst we update our estimates of the key growth impulses that drive our GDP forecast: reopening, fiscal stimulus, pent-up savings, easy financial conditions, and net trade. We then add up their combined impact to reassess the growth outlook and the risk of overheating.
Reopening is on track to deliver a large mid-year growth boost. The rebound in virus-exposed services has accelerated in recent months and has plenty of room to run, which should more than offset a normalization in demand for goods.
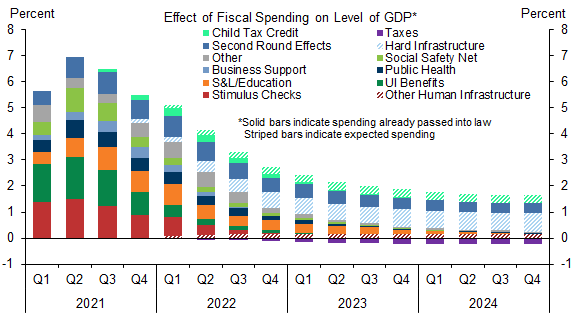
The fiscal impulse peaks in 2021Q2, partly due to the stimulus checks, and then declines substantially through next year. We incorporate our latest estimates of the upcoming infrastructure and social benefits package, and we now assume that the expanded eligibility and extended duration of unemployment benefits will expire in September, alongside the $300 weekly top-up.
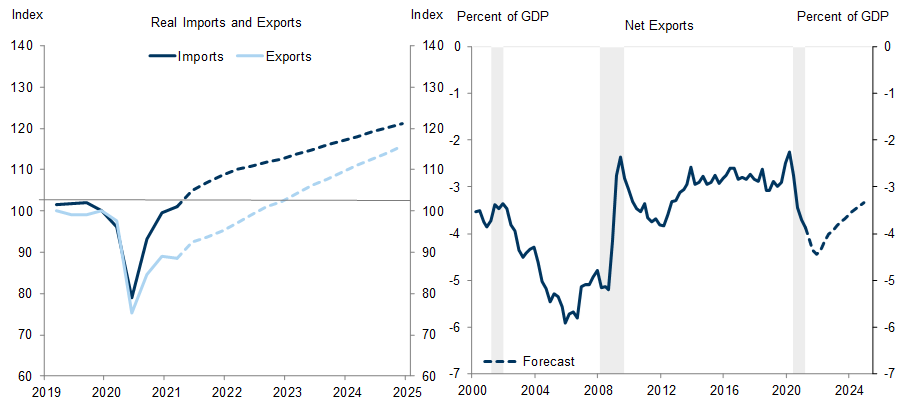
We have made only modest changes to our estimates of the other key growth impulses. We use new spending and saving data to update our analysis of the impact of pent-up savings on spending, take on board the further easing in financial conditions to estimate the impact on growth, and use our latest forecasts of imports and exports to estimate the degree to which a wider trade deficit will help to absorb strong US demand.
Our analysis implies that the total impact of these key impulses will raise the level of GDP (relative to trend) by a further 3pp from 2021Q2 to the peak in 2022Q1. The total impact on the growth rate of GDP is peaking now in 2021Q2, remains strongly positive in Q3, begins to decline quickly in Q4, and turns negative by the middle of 2022, largely reflecting the reduction in fiscal support.
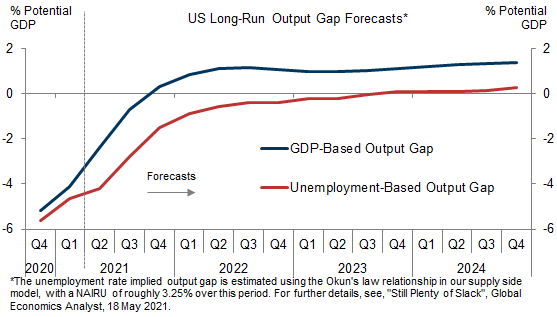
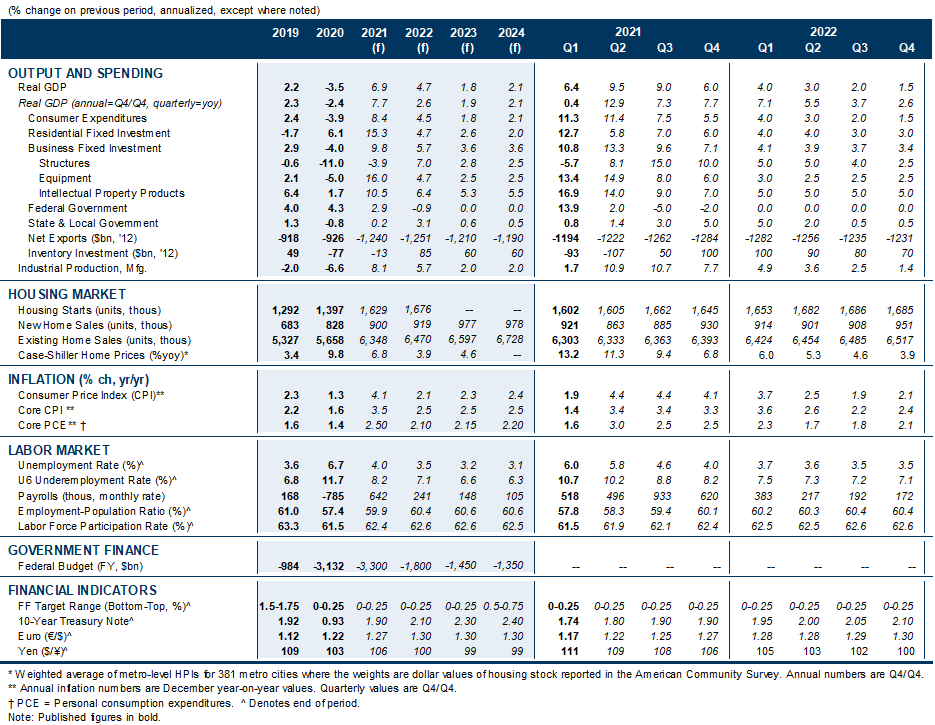
Our official GDP forecast follows the same pattern. We continue to forecast growth of 9.5% in 2021Q2 and 9% in 2021Q3, but have lowered 2021Q4 and 2022Q1 by 1pp each to 6% and 4%. This implies 2021 growth of +6.9% on a full-year basis or +7.7% on a Q4/Q4 (vs. +6.6%/+6.8% consensus) and 2022 growth of +4.7% on a full-year basis but just +2.6% on a Q4/Q4 (vs. +4%/+2.8% consensus). Our forecast implies a roughly 1.5% overshoot of our estimate of potential GDP, which we expect to push inflation moderately but not dramatically above 2% over 2022-2024, in line with the Fed’s goal.
Adding Up the Growth Impulses: A Second Look
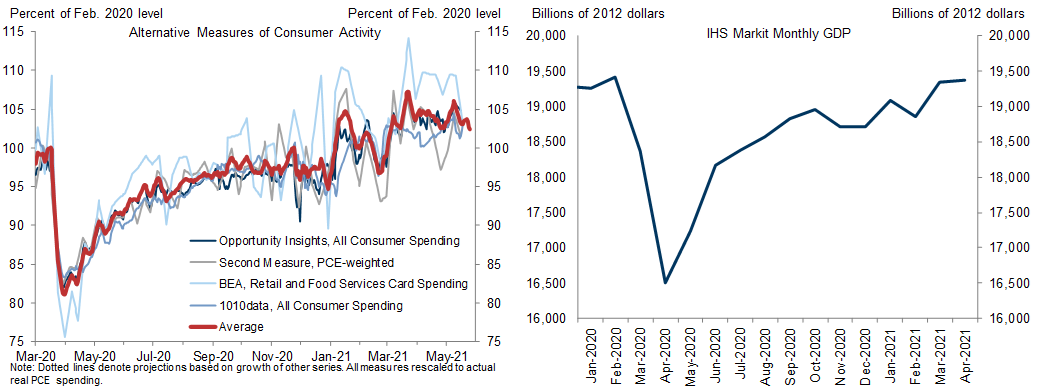
Exhibit 1: A Faster Pace of Recovery in Recent Months Has Brought Consumption Back to Its Pre-Pandemic Trend and GDP Back to Roughly Its Pre-Pandemic Level
Reopening
Exhibit 2: Covid-Depressed Services Are Bouncing Back But Have Plenty of Room to Recover Further
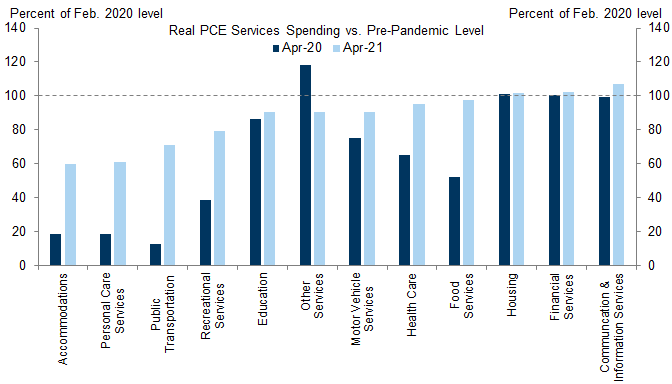
Exhibit 3: Consumers Increasingly Say They Plan to Return to Even the Most Virus-Exposed Activities
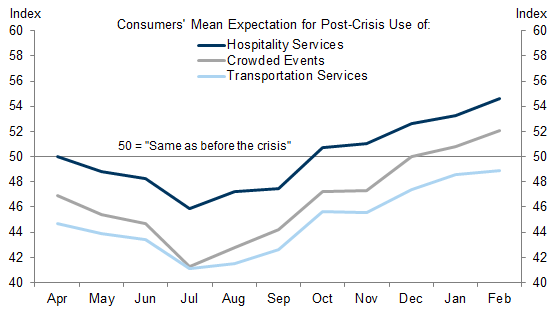
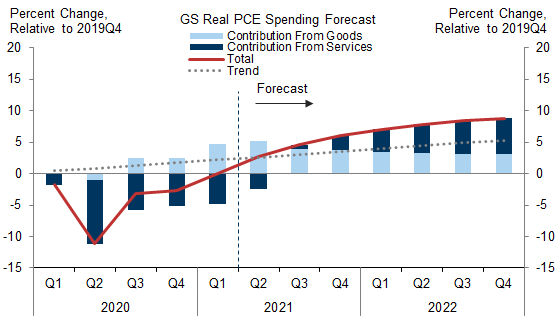
Exhibit 4: Rising Demand for Services Should More Than Offset Normalization of Demand for Goods
Fiscal Support
Exhibit 5: The Fiscal Impulse Is Peaking Now, in 2021Q2, and Will Fade Sharply Through 2022
Pent-Up Savings
Exhibit 6: A Large Share of Excess Savings Are Held in Bank Deposit Accounts, but They Are Skewed Toward Higher-Income Households
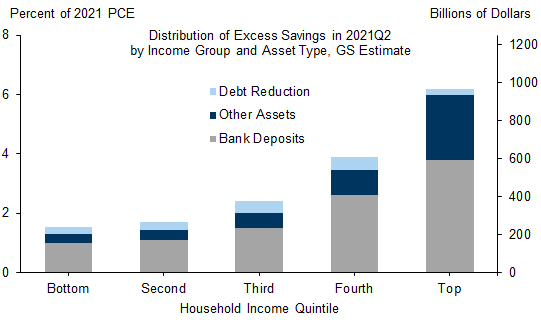
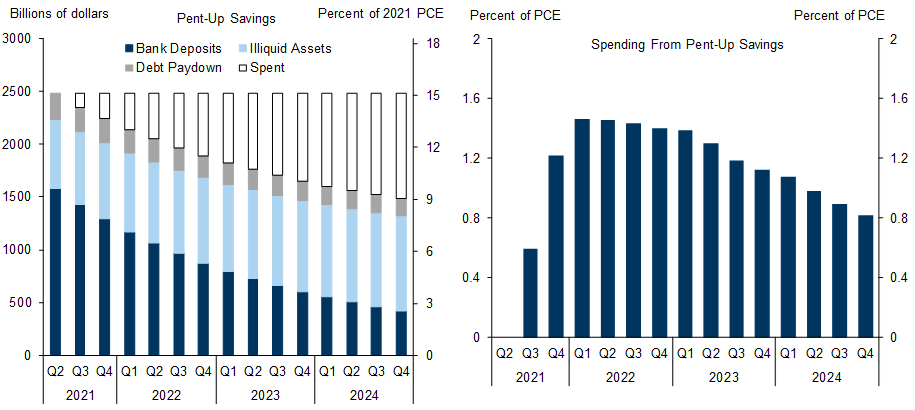
Exhibit 7: Spending of Pent-Up Savings Should Provide a Large, Sustained Boost to Consumption
Easy Financial Conditions
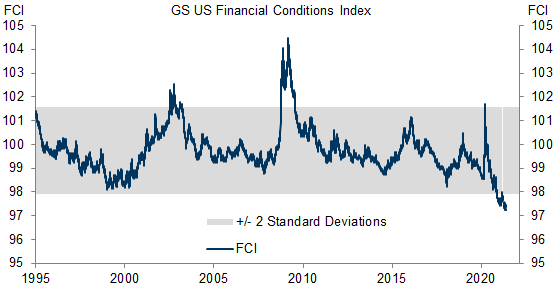
Exhibit 8: Further Easing in Financial Conditions Should Continue to Boost Growth in Coming Quarters
International Trade
Exhibit 9: The Widening of the Trade Deficit Helps to Partially Absorb US Demand at Its Peak
Adding Up the Growth Impulses
Exhibit 10: The Combined Impact of the Key Growth Impulses Raises the Level of GDP by a Further 3% (Relative to Trend) from 2021Q2 to 2022Q1
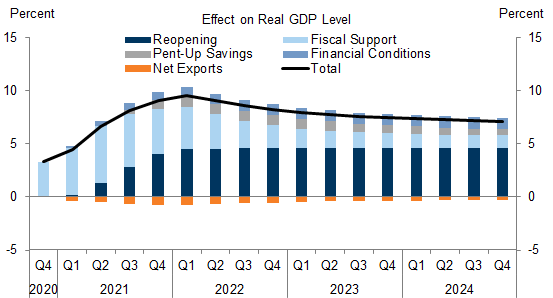
Exhibit 11: The Boost to Quarterly Annualized Growth Peaks in 2021Q2 but Turns Negative by Mid-2022
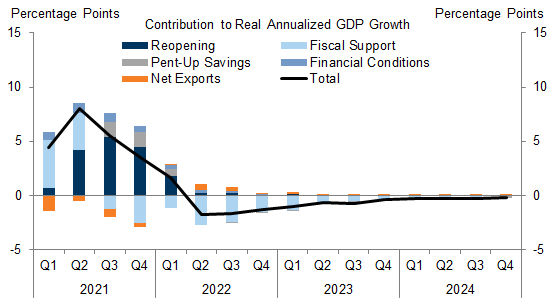
Exhibit 12: We Expect Very Strong Growth in 2021, but a Sharp Sequential Deceleration in 2022
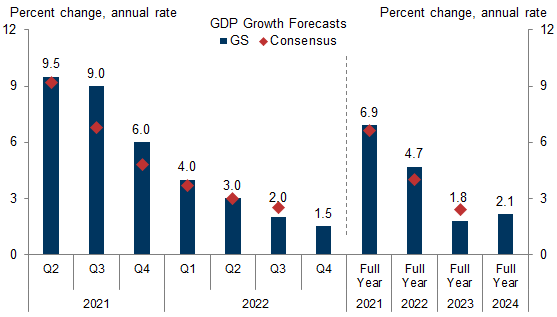
Exhibit 13: Our Forecast Implies a Roughly 1.5% Overshoot of Our Estimate of Potential GDP
Joseph Briggs
David Mericle
The US Economic and Financial Outlook
Forecast Changes
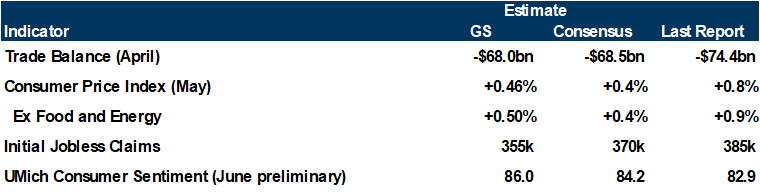
Economic Releases
Investors should consider this report as only a single factor in making their investment decision. For Reg AC certification and other important disclosures, see the Disclosure Appendix, or go to www.gs.com/research/hedge.html.