Goldman Sachs Research
Japan Economics Analyst
What Japan's Womenomics Tells Us About Demographic Strategy in Asian Nations
  • Japanification was initially triggered by worsening demographics. However, thanks partly to a steep increase in the female participation rate, Japan's GDP has decoupled from the steadily declining working-age population. Given that many other Asian countries have begun to face demographic headwinds, we draw possible lessons for these countries from the successes to date and challenges ahead of "Womenomics" in Japan.

  • The core Womenomics strategies implemented in recent years include: (1) incentivize companies to promote women’s participation in the workplace particularly by requiring disclosure of gender diversity-related information, (2) improve the parental leave system and increase uptake rates, (3) expand childcare capacity, and (4) implement work-style reforms that limit overtime hours and mandate equal pay for equal work.

  • Strategies (1) to (3) above have already started having a tangible effect, in our view. In particular, we highlight that Japan’s parental leave system is now among the most generous in the world and more parents are using it. By contrast, more time will be needed to assess the effectiveness of the work-style reforms in strategy (4), given that these reforms are still in their infancy.

  • Heightened awareness among businesses, enhancement of parental leave systems, and expansion of childcare facilities have also likely increased incentives for working women to have two or more children, and this is likely to be contributing to the rise in the fertility rate among Japanese women in their 30s.

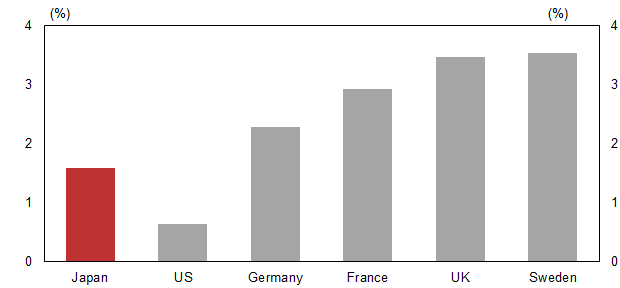
  • However, we think that there remain significant challenges to be addressed to improve the future female labor environment in Japan, which include: (1) the gender pay gap stemming from a much higher non-regular worker ratio in the female workforce, (2) men’s willingness to participate in housework/child-rearing, and (3) more general fiscal support for family assistance. Regarding (3), the former Abe administration decided to earmark some of the increased tax revenue from the October 2019 consumption tax hike for making pre-school education free. We view this positively as a manifestation of the government’s sense of urgency, but see continued, long-term efforts as essential.

What Japan's Womenomics Tells Us About Demographic Strategy in Asian Nations

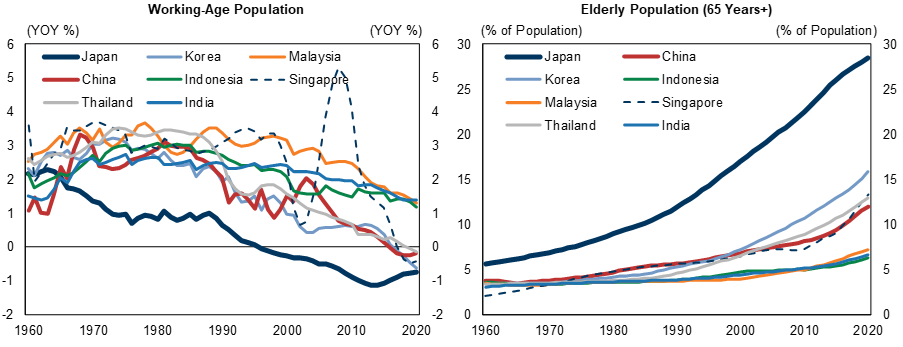
Demographic Headwinds Overshadowing Asian Nations

Our analysis of Japanification—Japan’s structurally low growth, inflation, and interest rates—has shown that it is initially triggered by worsening demographics.[1] Although the risk of Japanification is typically discussed in connection with European countries of late, recent data show that many other Asian countries also began facing demographic headwinds.[2] For instance, growth in the working age population, which is often considered one of the most fundamental determinants for long-term economic growth potential, has in recent years turned negative in Korea, Thailand, Singapore, and even China, and has now come close to the level in Japan, which has seen a recovery in recent years (Exhibit 1, LHS).[3]
While elderly ratios are still well below that in Japan, the data also show that population aging has accelerated notably in some countries over the past 10-20 years, against the backdrop of prolonged average life spans and declining fertility rates (Exhibit 1, RHS).
Any approach to solving demographic issues requires a long lens (usually decades), so countries experiencing a downturn in their working age populations will likely need to start implementing comprehensive measures as soon as possible in order to avoid falling into the Japanification trap.

Exhibit 1: Worsening Demographics an Emerging Issue for Many Asian Countries Too

1. Worsening Demographics an Emerging Issue for Many Asian Countries Too. Data available on request.
Source: United Nations (UN), Data compiled by Goldman Sachs Global Investment Research

Japan's GDP Decouples from the Secular Downtrend in the Working-Age Population

As we have discussed previously, however, Japan's real GDP has remained on a modest growth trend despite a secular downtrend in the working-age population, resulting in a decoupling of economic activity from a demographic trend (Exhibit 2, LHS).[4] A particularly noteworthy point here is that despite the decline in working-age population, the number of workers has shown a clear uptrend in the last decade or so (Exhibit 2, middle, Exhibit 3, LHS)), and real GDP has returned to a growth trajectory on the back of this increase (Exhibit 2, RHS). In addition to a pickup in capex aimed at enhancing efficiency and ample financial support by both public and private financial institutions, the mobilization of the female workforce underpinned by a notable increase in the female participation rate has made significant contribution, in our view (Exhibit 3, RHS).
With this in mind, in this report, we highlight both the successes to date and challenges ahead surrounding Japan's attempts to improve the working environment for women. These may provide some lessons from Japan's experience for other Asian countries that face the prospect of worsening demographics. We also highlight that the experience in Australia may be beneficial for Asian countries, as well.[5] 

Exhibit 2: Japan's GDP Structurally Decoupling from Working-Age Population

2. Japan's GDP Structurally Decoupling from Working-Age Population. Data available on request.
Source: Cabinet Office, Ministry of Internal Affairs and Communications, Data compiled by Goldman Sachs Global Investment Research

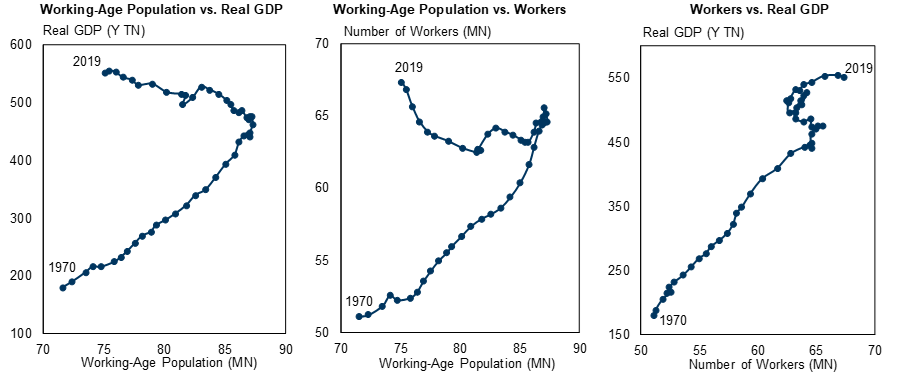
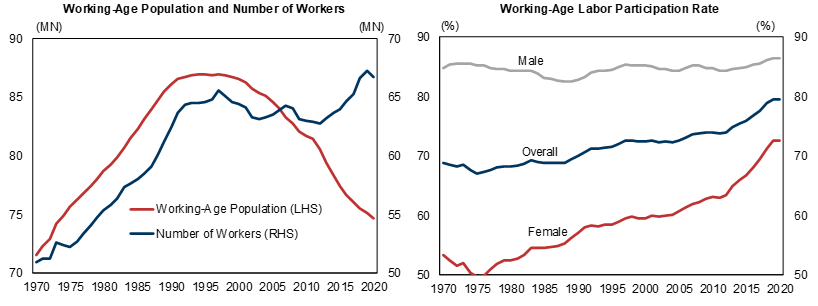
Exhibit 3: Japan's Workers Increasing, Mainly on Rapidly Rising Female Participation Rate

3. Japan's Workers Increasing, Mainly on Rapidly Rising Female Participation Rate. Data available on request.
Source: Ministry of Internal Affairs and Communications

Japan's Female Participation Rate Has Increased Substantially, Even Compared with Other Asian Nations

Next, we look at how the female labor participation rate in Japan compares with the rates in some of Asian countries. Japan’s rate reached 73% in 2019, the highest among our sample countries (Exhibit 4, LHS). This was also higher than the rates in the US (68%) and the EU27 average (68%). Moreover, we can see that the cumulative change in Japan's female participation rate since 1990 has been quite strong, only second to Singapore (Exhibit 4, RHS). Also notable is the visible acceleration from around 2013, which marked the start of the former Abe administration. By contrast, female participation rates in China, where 2020 census data indicates that working-age populations have started to shrink, as well as in India, have declined by around 10 pp since 1990.
We also look at fertility rates. Japan’s fertility rate was 1.36 in 2019, the third lowest in our sample countries only after South Korea and Singapore (Exhibit 5, LHS). However, Japan’s rate has somehow improved after hitting a bottom in 2005 at 1.26, while the rates in South Korea and Singapore continue to trend downward (Exhibit 5, RHS). Breaking down fertility rates in Japan by age group, we find that as of 2018, the fertility rate for women in their 20s has declined further since 2005, but the rate for women in their 30s has increased, more than offsetting the former (Exhibit 6).
Having identified key demographic and labor market trends in Asian countries, we now turn our focus to Japanese government policies of recent years that appear to have had an impact on female labor participation and fertility rates, seeking to identify both the successes so far and challenges ahead.

Exhibit 4: Japan's Female Participation Rate Has Increased Substantially, Even Compared with Other Asian Nations

Female Labor Participation Rates (Working-Age Population)
4. Japan's Female Participation Rate Has Increased Substantially, Even Compared with Other Asian Nations. Data available on request.
Source: ILO, Data compiled by Goldman Sachs Global Investment Research

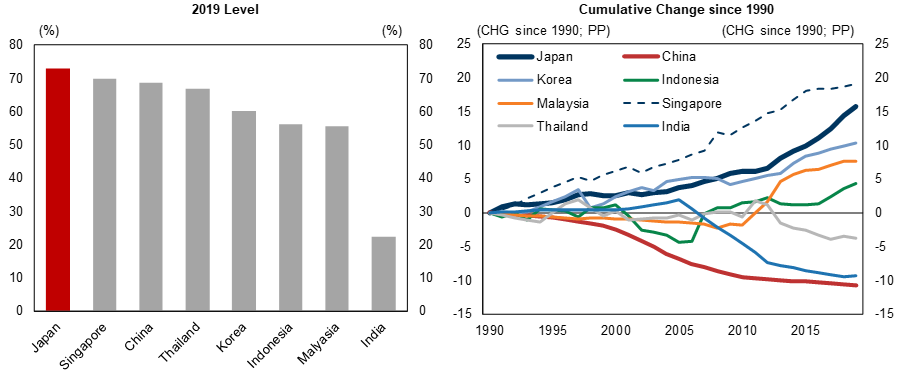
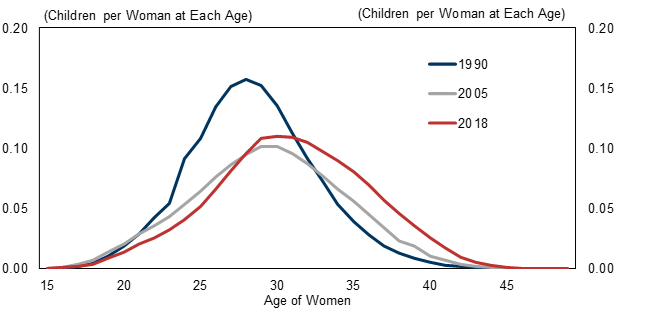
Exhibit 5: Japan's Fertility Rate Remains Low, but Somehow Improving since 2005

Fertility Rates
5. Japan's Fertility Rate Remains Low, but Somehow Improving since 2005. Data available on request.
Source: Ministry of Internal Affairs and Communications, United Nations (UN), Data compiled by Goldman Sachs Global Investment Research

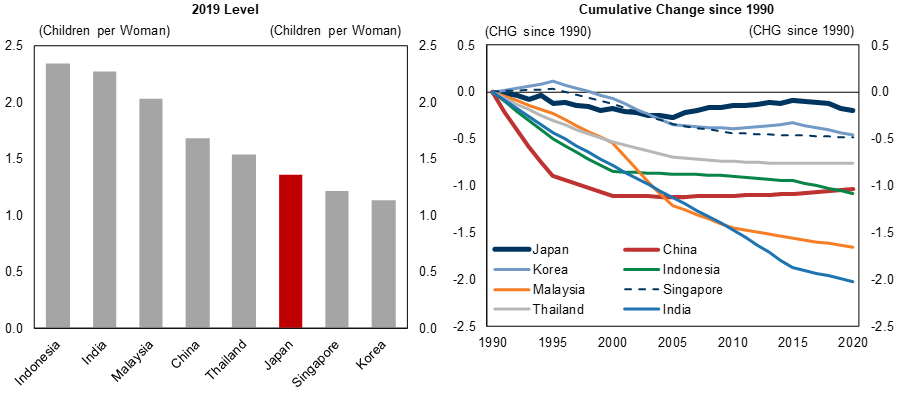
Exhibit 6: Japan's Fertility Rate is Rising for Women in Their 30s

Fertility Rates by Age in Japan
6. Japan's Fertility Rate is Rising for Women in Their 30s. Data available on request.
Source: Cabinet Office, National Institute of Population and Social Security Research

Unpacking the Successes and Challenges of Japan’s Womenomics

The idea that women are the most underutilized resource in Japan, and that making effective use of this resource is a pressing issue, has now become widely accepted thanks to the Womenomics project, first launched in 1999 by Kathy Matsui (our Chief Japan Equity Strategist until 2020).[6] However, it was not until the early 2010s, after the second Abe administration was established, that this idea began to seriously inform government policy.
The core Womenomics strategies implemented under Abenomics were as follows: (1) incentivize companies to promote women’s participation in the workplace particularly by requiring disclosure of gender diversity-related information, (2) improve the parental leave system and increase uptake rates, (3) expand childcare capacity, and (4) implement work-style reforms that limit overtime hours and mandate equal pay for equal work.
Strategies (1) to (3) above have already started having a tangible effect, in our view. However, more time will be needed to assess the effectiveness of the work-style reforms in strategy (4), given that these reforms are still in their infancy. Specifically, rules to reduce overtime hours were implemented only from FY2019 (FY2020 for SMEs), and equal pay for equal work legislation did not take effect until FY2020 (FY2021 for SMEs). Below we look at the success so far and challenges ahead for each strategy.

Success to Date: The M-Curve Has Improved Considerably

Regarding strategy (1), the “Act on Promotion of Women’s Participation and Advancement in the Workplace,” which came into effect in FY2016, marked the start of serious efforts to incentivize companies to promote the participation of women. The Act requires that central and local government bodies and large companies disclose gender diversity-related information and publish diversity action plans. The government launched a certification system (Eruboshi) to recognize companies that are successfully implementing these plans, and the number of certified companies has been steadily increasing (Exhibit 7, LHS). At the same time, the number of companies acknowledged under the so-called "Kurumin" system for their provision of parental support has also been increasing (Exhibit 7, RHS).
Furthermore, the government strengthened the Corporate Governance Code in June, which now requires listed companies to disclose their approach to ensuring diversity, associated voluntary/measurable targets, and their progress for all employees in addition to executive members.[7] These attempts will continue to provide a strong incentive to companies, as they prove to be beneficial for them in recruiting and boosting their corporate images, among others.

Exhibit 7: Disclosure Policies Aimed at Incentivizing Companies to Increase Female Participation Have Proven Effective in Japan

7. Disclosure Policies Aimed at Incentivizing Companies to Increase Female Participation Have Proven Effective in Japan. Data available on request.
Source: Ministry of Health, Labour and Welfare, Gender Equality Bureau Cabinet Office
Regarding strategy (2), Japan’s parental leave system is now among the most generous in the world (Exhibit 8, LHS). Japanese mothers and fathers are both eligible for up to one year of parental leave before the child reaches the age of one, and can receive 67% of their base salary for the first six months and 50% thereafter (paid as employment insurance benefits). Social insurance premiums are waived during parental leave, which means that the actual amount paid amounts to around 80% of take-home pay prior to the leave period.
Improvement of this system has resulted in a notable increase in the percentage of fathers actually taking this leave during the last few years (Exhibit 8, RHS). However, the percentage remains low, at 7-8%, well short of the government’s 2020 target of 13%. We see scope for this to improve as Japanese men start to shoulder a larger share of household and child-rearing duties, as we discuss below.

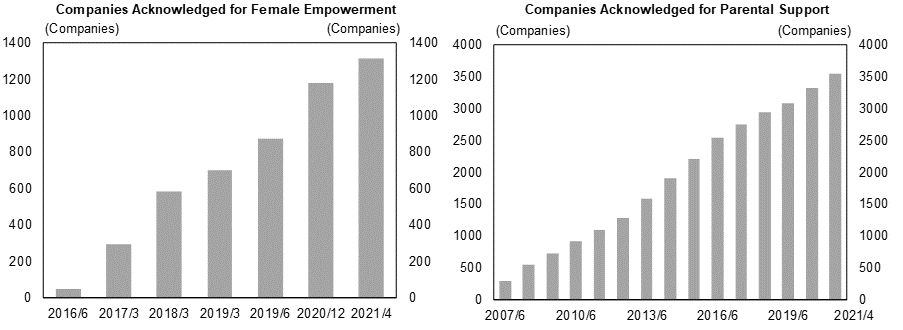
Exhibit 8: Japan's Parental Leave System is Now Among the Most Generous in the World

8. Japan's Parental Leave System is Now Among the Most Generous in the World. Data available on request.
Source: OECD, Ministry of Health, Labour and Welfare, Data compiled by Goldman Sachs Global Investment Research
Regarding strategy (3), Japan’s childcare capacity has increased greatly—nearly 40% over the past 10 years—and with this the number of children waiting to get into childcare has declined substantially—by over 50% over the same period (Exhibit 9). Continued effort is needed in order to reach the government target of having no children waiting to get into childcare. Nevertheless, this strategy is already producing significant results.

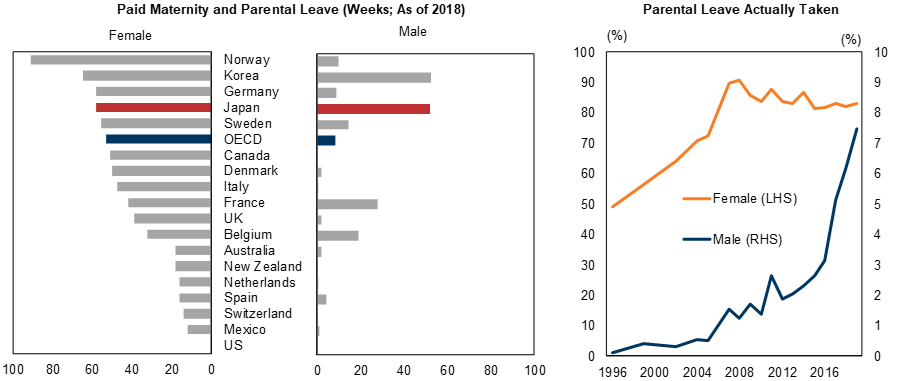
Exhibit 9: Childcare Capacity Steadily Increasing

Number of Children Waiting to Get into Childcare and Childcare Facility Capacity in Japan
9. Childcare Capacity Steadily Increasing. Data available on request.
Source: Ministry of Health, Labour and Welfare
Meanwhile, the so-called M-curve, which represents relatively low labor participation rates especially among women in their child-rearing years, is improving sharply (Exhibit 10, LHS). Examination of trends by cohort (generations divided by birth year) reveals that the younger the generations are, the higher the incentive to work (Exhibit 10, RHS). The participation rate should be affected, to some degree, by changes in societal norms and the economic cycle, but it seems clear that the policies described above are contributing to improvement in the labor force participation rate underpinned by an increasingly strong incentive to work among Japanese women.
Heightened awareness among businesses, enhancement of parental leave systems, and expansion of childcare facilities have also likely increased incentives for working women to have two or more children, and this may be contributing to the rise in the birth rate among women in their 30s shown in Exhibit 6.

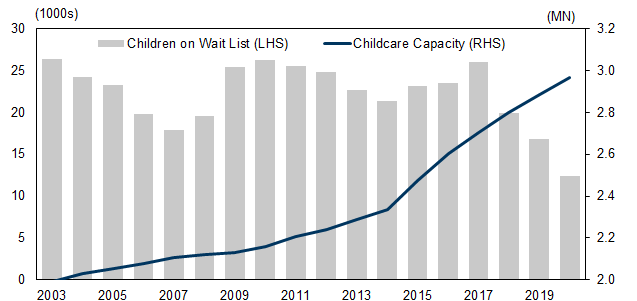
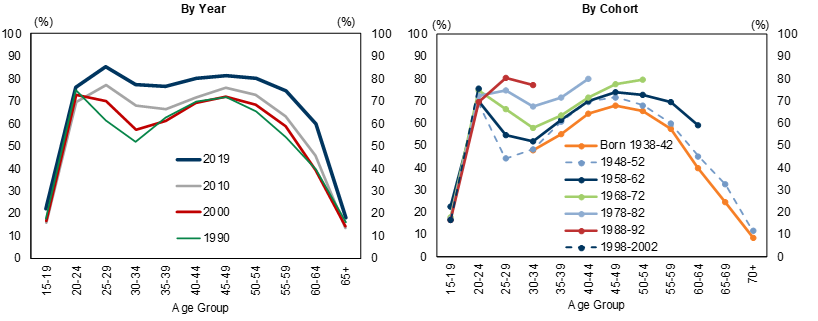
Exhibit 10: Japan’s Female Labor Participation Rate M-Curve Improving Significantly

Female Labor Participation Rates
10. Japan’s Female Labor Participation Rate M-Curve Improving Significantly. Data available on request.
Source: Ministry of Internal Affairs and Communications, Goldman Sachs Global Investment Research

Challenges Ahead: Gender Pay Gap, Male Participation in Child-Rearing, Government Family Assistance

In our opinion, remaining challenges to be addressed to improve the future female labor environment in Japan include the following: (1) the gender pay gap, (2) men’s willingness to participate in housework/child-rearing, and (3) fiscal support for family assistance.
Firstly, the gender pay gap has been on a secular narrowing trend, but it remained at nearly 25% as of 2019, the second highest level after Korea among the 37 OECD countries for which data are available (Exhibit 11). This is chiefly due to a high non-regular employment ratio among women in a wide age range, from 25 to 64 in particular (Exhibit 12). Examination of a time series of the average ratio shows that the ratio has risen nearly to 60% over the past several years. Under such circumstances, some women may be having second thoughts about entering the labor force given low wages, and—even if they are working—may well be vacillating about having children for an economic reason.
The most promising measure in addressing this issue should be work-style reforms, especially equal pay for equal work initiatives. However, it has begun to be adopted at large companies only from FY2020 and at smaller ones from FY2021, and thus developments in this area warrant further monitoring.

Exhibit 11: Gender Pay Gap Remains Wide, Though It Is Improving

Gender Pay Gap
11. Gender Pay Gap Remains Wide, Though It Is Improving. Data available on request.
Source: OECD, Data compiled by Goldman Sachs Global Investment Research

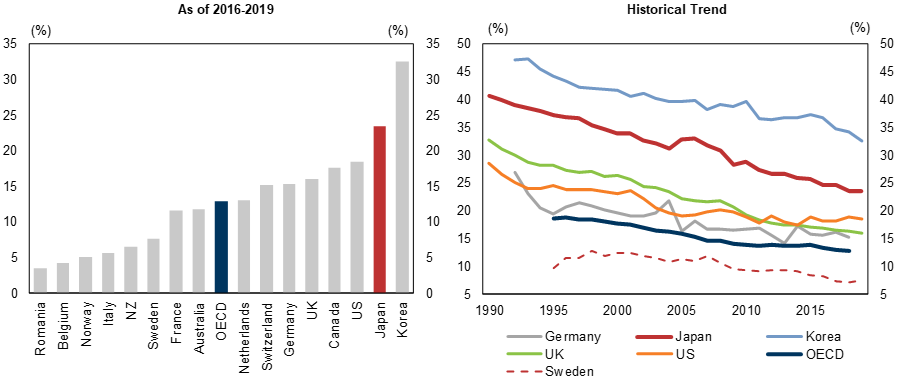
Exhibit 12: Lowering Non-Permanent Employment Ratio among Women Is an Important Challenge Ahead

Non-Regular Employment Ratios in Japan
12. Lowering Non-Permanent Employment Ratio among Women Is an Important Challenge Ahead. Data available on request.
Source: Ministry of Internal Affairs and Communications
Secondly, the time men in Japan spend on housework and child-rearing shows that the daily average was 83 minutes as of 2016, up 16 minutes compared to 2011, but is still the lowest level among developed economies (Exhibit 13). Meanwhile, the ratio of men working long hours remains high compared to that in other developed economies, although it has been rapidly declining since the mid-2000s (Exhibit 14). Improvement is therefore critical in terms of both mens' willingness to shoulder the burden and creating more time for it, the latter of which should be achieved through extensive work-style reforms.

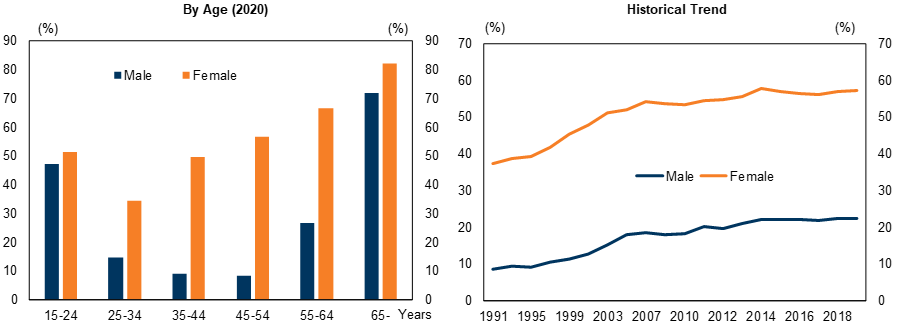
Exhibit 13: Increased Participation by Men Is Essential

Time Spent a Day by Parents on Housework/Childrearing in Families with Children under the Age of Six
13. Increased Participation by Men Is Essential. Data available on request.
Source: Cabinet Office

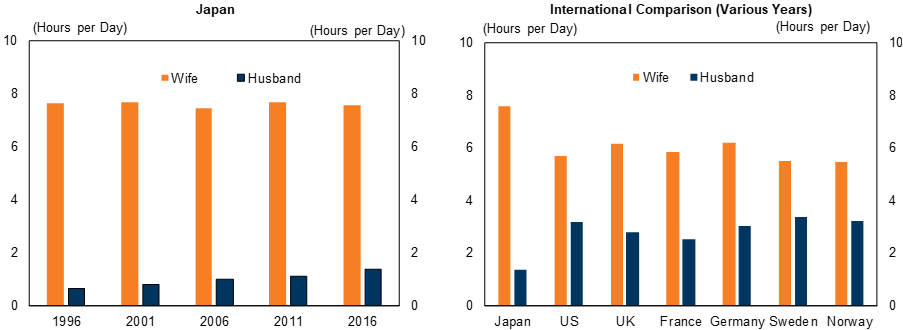
Exhibit 14: Long Working Hours Are Being Reduced Rapidly for Men, but There Is Still Room for Improvement

Percentage of Men Who Work 49 or More Hours per Week
14. Long Working Hours Are Being Reduced Rapidly for Men, but There Is Still Room for Improvement. Data available on request.
\"Working long hours\" means more than 49 hours a week, which corresponds to the longest working hour category, according to the definition of ILO.
Source: Ministry of Internal Affairs and Communications, Japan Institute for Labour Policy and Training, Data compiled by Goldman Sachs Global Investment Research
Thirdly, government cash and in-kind assistance for families quite limited in Japan compared to that in European countries (Exhibit 15). As we have previously noted, this is likely due to the government’s slowness in recognizing the problem of a declining birth rate and aging society (due to a long-term optimistic bias in population forecasts) and increasingly severe fiscal constraints. The former Abe administration decided to earmark some of the increased tax revenue from the October 2019 consumption tax hike (to 10% from 8%) to make pre-school education free and high school free for low-income households. We view this positively as a manifestation of the government’s sense of urgency, but see continued, long-term efforts as essential.

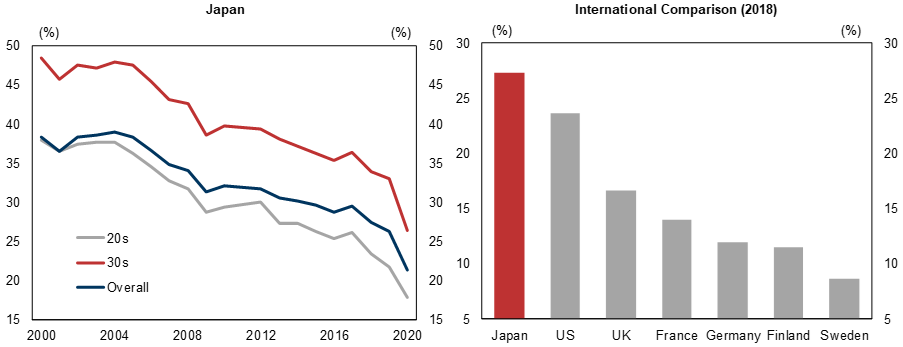
Exhibit 15: Family Assistance Expenditures Very Small Compared to Those in European Countries

Family-Related Social Expenditures as a Percentage of GDP (2015-2017)
15. Family Assistance Expenditures Very Small Compared to Those in European Countries. Data available on request.
Source: National Institute of Population and Social Security Research
Naohiko Baba and Yuriko Tanaka

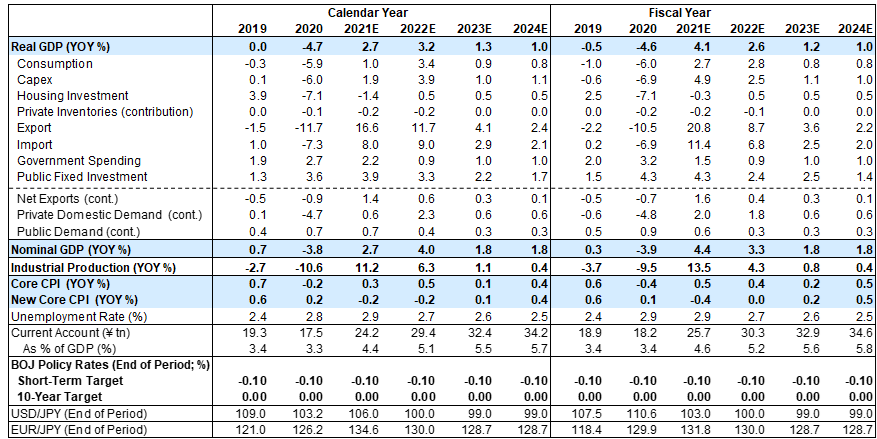
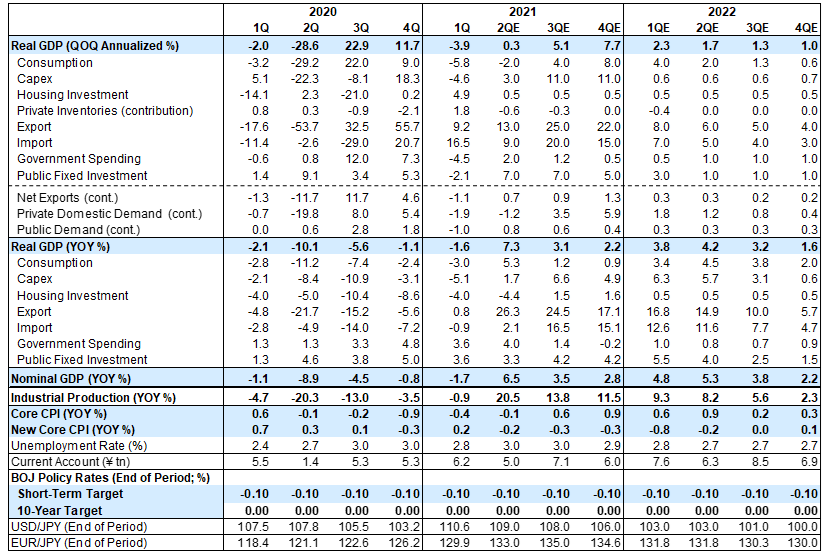
Japan Main Economic Forecasts

Data available on request.

Data available on request.
Note: Both Core CPI and New Core CPI include impacts from consumption tax hike, free education and mobile phone charge reduction.
Source: Goldman Sachs Global Investment Research

Recent Publications

Japan Economic Analyst

Spillover of Global Supply Chain Disruptions to Japan

Jun 1, 2021

Pent-Up Demand - How Much Will Be Unlocked, and By Whom?

Apr 28, 2021

Revisiting Japan's Fiscal Situation Based on New Guidepost

Apr 14, 2021

Headwinds for Female Employment To Linger Post-COVID

Mar 31, 2021

Carbon Neutrality: A Policy Primer

Mar 26, 2021

YCC Credibility Through the Lens of UST-JGB Yield Sensitivity

Mar 9, 2021

Déjà Vu: Comparing Nikkei ¥30,000 Eras

Mar 2, 2021

Have COVID Relief Policies Raised Zombification Risk?

Feb 25, 2021

Corporate Debt Overhang: How Serious Is It?

Feb 19, 2021

Managing "Japanification": What Japan's Experience Tells Us

Jan 27, 2021

Updated Outlook for the Japanese Economy with Renewed State of Emergency

Jan 7, 2021

Digitalization: Moving Up the Ladder of Productivity

Dec 10, 2020

Regional Bank Reform is Gaining Momentum

Nov 26, 2020

Suganomics and SME Reforms: The Challenge of Enhancing Productivity

Nov 12, 2020

2021 Japan Outlook: Looking for Above-Consensus Rebound

Nov 9, 2020

Possibility of Central Bank Digital Currency in Japan

Oct 15, 2020

"Going Digital" Led by Suganomics

Oct 2, 2020

Reliance on China to Meet "Remote Working" Demand Likely to Persist Post COVID-19

Sep 18, 2020

Retail Investors Returning to USD

Sep 16, 2020

Mounting Corporate Debt: A Cost-Benefit Analysis

Aug 27, 2020

Higher value-added supporting exports and reducing vulnerability to JPY appreciation

Aug 18, 2020

Living with COVID-19: Impact on Consumption Persists

Aug 7, 2020

Living with COVID-19: Economic Costs of Tokyo Isolation

Jul 28, 2020

Sharp Decline in USD Hedge Cost Would Provide Impetus for US Bond Investment

Jul 17, 2020

Yield Curve Control Q&A: Lessons from Japan

Jul 10, 2020

  1. 1 ^ See Naohiko Baba, "Lessons from Japan's Demographics: Delayed Recognition, Delayed Action," Japan Economics Analyst, June 28, 2019.
  2. 2 ^ See Sharon Bell, "European Equities and Japanification," Global Strategy Paper, July 1, 2019.
  3. 3 ^ See Maggie Wei, "The Implications of China's Shrinking Working-Age Population," Asia Economics Analyst, May 25, 2021.
  4. 4 ^ See Naohiko Baba, "Managing Japanification: What Japan's Experiece Tells Us," Japan Economics Analyst, Janaury 27, 2021.
  5. 5 ^ See Andrew Boak, BIll Zu, and William Nixon, "Womenomics in Australia - Some Progress, but More Potential," Australia and New Zealand Economics Analyst, November 29, 2019.
  6. 6 ^ See Kathy Matsui, Hiromi Suzuki, and Kazunori Tatebe, "Womanomics 5.0: 20 Years On," Japan Portfolio Strategy, April 16, 2019.
  7. 7 ^ See Hiromi Suzuki and Kazunori Tatebe, "2021 AGMs: Corporte Governance Focus Points," Japan Corporate Governance Monitor, June 19, 2021.

Investors should consider this report as only a single factor in making their investment decision. For Reg AC certification and other important disclosures, see the Disclosure Appendix, or go to www.gs.com/research/hedge.html.