Goldman Sachs Research
European Daily: The Delta Variant—A Manageable Risk (Dacic)
25 June 2021 | 4:30PM BST | Research | Economics| By Sven Jari Stehn and others
More
  • The spread of the delta variant across Europe has raised concerns that a renewed wave of infections could slow the reopening and weigh on the Euro area economic outlook. Using a simple framework motivated by standard epidemiological models, we jointly analyse the scope for renewed outbreaks in the presence of ongoing mass immunisation, mitigation measures, and weather effects. While uncertainty is high, our analysis suggests there is a risk of rising infections in the Euro area later in the summer and into the winter months, given the high transmissibility of the delta strain.

  • That said, our analysis suggests that the risk of strong upward pressures on Covid hospitalisations has fallen sharply given high and steadily rising levels of collective immunity across Europe. Assuming policymakers remain primarily focused on limiting hospitalisations, we therefore think the delta variant poses a manageable risk to the reopening and our constructive view on the European recovery.

The Delta Variant—A Manageable Risk

Although economic activity is rebounding strongly across Europe in light of the ongoing reopening, there are rising concerns around the spread of the more transmissive 'delta' variant of COVID-19. While new infections continue to decline in the Euro area as a whole, a number of European countries—including the UK, Portugal and Russia—have seen a renewed rise in new cases (Exhibit 1). In today's Daily, we analyse the Covid situation and the rationale behind our view that the delta variant poses a manageable risk to our constructive view on Europe.

Exhibit 1: Low (and Still Falling) New Cases in Euro Area, Rising in the UK

1. Low (and Still Falling) New Cases in Euro Area, Rising in the UK. Data available on request.
Source: Goldman Sachs Global Investment Research, Our World In Data
The available data from genome sequencing shows that a high proportion of new cases in the UK—most recently, as high as 90%—is attributable to the delta variant, with the remaining cases mostly related to the previously dominant 'alpha' strain that first appeared in the UK in the fall of 2020 (Exhibit 2, left). The prevalence of the delta variant is significantly lower in most other European countries, but has been rising steadily (Exhibit 2, right).[1] In Lisbon, the delta variant accounts for more than 60% of new cases, with the share even higher at around 90% in Moscow. In the US, the delta variant now accounts for around a third of all new cases—a tripling of its share over around 10 days.

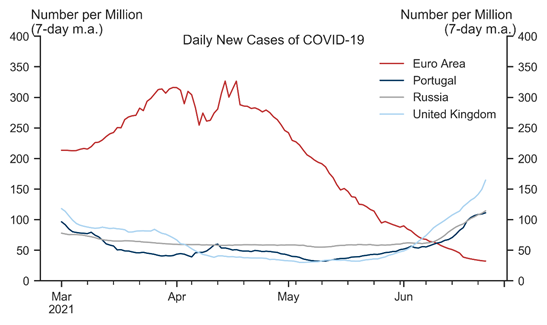
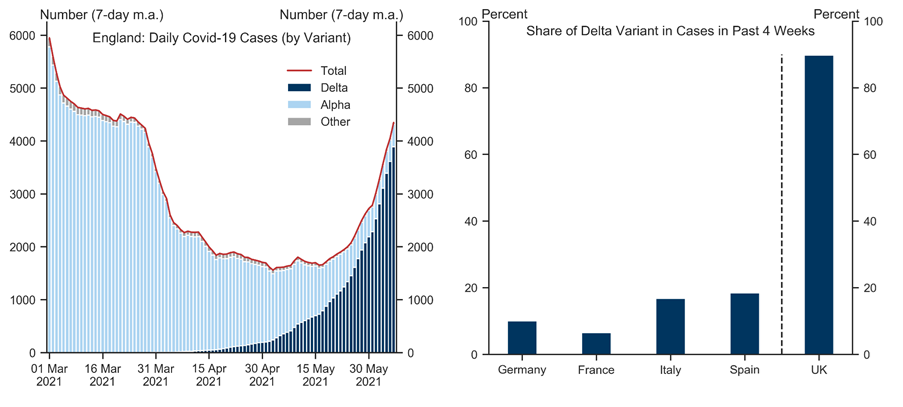
Exhibit 2: Delta Variant Spreading

2. Delta Variant Spreading. Data available on request.
The values in the right panel are based on data from GISAID, available at https://www.gisaid.org/hcov19-variants/.
Source: Goldman Sachs Global Investment Research, Public Health England, GISAID
To analyse how much of a downside risk the spread of the more transmissive delta variant poses to Europe, we proceed in two steps: (1) by analysing the scope for renewed large-scale outbreaks, and (2) by assessing the potential pressure on hospital capacity in case infections surge.

The Risk of Large Outbreaks

To analyse the scope for renewed large outbreaks, note that the reproduction number (the 'R number', or simply 'R') of a virus strain—the average number of individuals each infected person will infect—plays a key role in epidemiological models of pandemics. If R is less than 1, the epidemic is subsiding (and vice versa in case R is above 1). As we had noted in our previous work, these models generally imply a linear relationship between R and the non-immune share of population.[2] In practice, R also depends on a number of other factors, including the weather (with colder weather pushing up on R, and vice versa in warmer conditions) and any mitigation measures. We therefore assume that R (denoted by Rt) is governed by:

Data available on request.
where immunet denotes the share of population that's immune to Covid-19 (ranging from 0 to 1), lockdownt denotes the intensity of containment measures (as measured by Oxford University's lockdown index), and weathert denotes the temperature deviation in a given month from the yearly average.[3] The basic reproduction number that is strain-specific is given by the constant parameter R0, whereas 𝛿 and γ capture the lockdown and weather effects on virus transmissivity, respectively.
Intuitively, assuming no lockdown or weather effects for simplicity, it follows that in order to bring down Rt below 1 for a given virus strain, the share of immune population needs to be no less than 1-1/R0. Therefore, for a strain that has an R0 of 2.6 (the original strain first discovered in Wuhan), collective immunity needs to be around 62% to prevent large outbreaks.
Next, we simulate the evolution of Rt for three different strains—the original strain, the alpha variant first discovered in the UK in the autumn of last year, and the delta variant—by making the following assumptions about its determinants:
  • R0: Using external estimates, we assume that the basic reproduction number is 2.6-2.9 for the original strain, 3.2-3.5 for the alpha variant, and 5.0-5.5 for the delta variant, with the higher values applicable to the UK;[4]

  • immunet: Our Global team's vaccination timelines, combined with (fairly conservative) assumptions on natural immunity from past infections, yield paths for the share of immune population;[5]

  • 𝛿 and lockdownt: In our previous work, we have estimated the effect of lockdowns on R, hence we set 𝛿 = 0.017 and assume the path for lockdown easing, lockdownt, that is the same as in our growth forecasts;

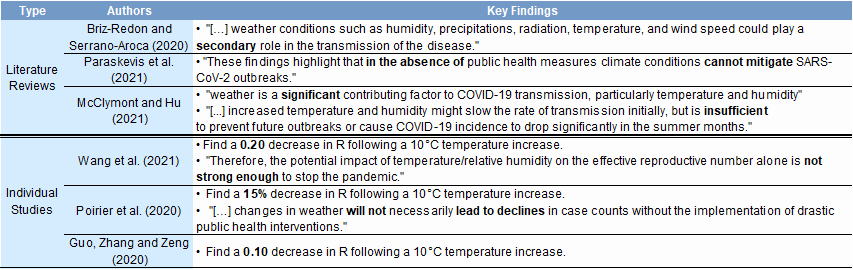
  • γ and weathert: We assume that a 10-degree Celsius increase in temperature lowers R by 0.15 (a mid-point of the studies shown in the Appendix).[6]

Exhibit 3 shows the resulting evolution of the effective reproduction number for the three strains under our above assumptions for the UK and the Euro area. Note that the country-level R is a weighted average of the R numbers of various strains (where the weights are related to the prevalence of each strain).

Exhibit 3: Variants vs. Immunity, Lockdowns, and Weather

3. Variants vs. Immunity, Lockdowns, and Weather. Data available on request.
Source: Goldman Sachs Global Investment Research
We make three observations.
First, the decline in R of the original strain (grey line) during the spring of 2020 was almost solely driven by strict lockdown measures (along with modest effects due to warmer weather).
Second, the emergence and spread of the alpha strain (blue line) during late 2020 led to renewed outbreaks, in response to which renewed lockdowns were put in place across Europe until the spring. The progress in mass immunisation (a sharp increase in immunet) has been the main driver behind steady declines in R since January. Prior to the spread of the delta variant in the UK, UK government's official estimates of R were indeed well below 1, close to those implied by our simple model. In the Euro area, steadily declining new cases over recent weeks are also consistent with an R below 1.
Third, the emergence of the delta strain (red line) and its dominance in new cases in the UK have pushed the official estimates of R to around 1.2-1.4, consistent with the numbers implied by our model. Our approach suggests that the continued progress in vaccinations along with rising temperatures may push down R of the delta variant in the UK to below 1 in the later part of the summer. In the Euro area, the increased spread of the delta variant may push the overall R number above 1 in coming weeks. With our estimates of collective immunity in the Euro area during the summer around 6-8% below those for the UK, our model cannot rule out renewed upward pressures on new cases later in the summer. Beyond the summer, our simple framework then suggests that the combination of remaining containment measures being gradually lifted along with colder weather may push R of the delta strain back up above 1 in both the UK and Euro area as we approach the winter.
It is essential that we emphasise the sensitivity of our results to:
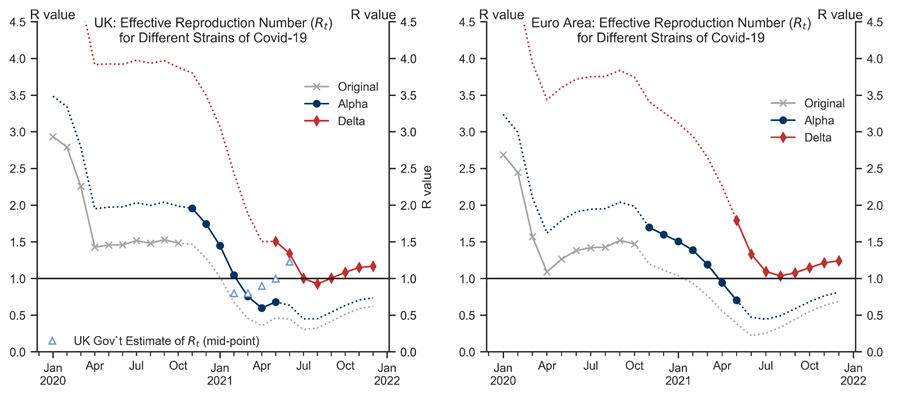
  • Parameter uncertainty: While we have tried to calibrate the three parameters (R0, 𝛿, and γ) using both external estimates and our previous work, there is large uncertainty around each of them. For example, the values of R0 may differ across countries (e.g. due to different population density) and there are wide ranges in the literature for each of the three strains. Changing this parameter for a particular strain would shift the corresponding line shown in Exhibit 3 up or down.

  • Linear specification: Our previous work suggests lockdown measures may have non-linear effects on R (for simplicity, we assume this away here). Moreover, voluntary social distancing and other behavioural factors (e.g. mask wearing) may also affect R. Insofar as people remain more cautious, that could additionally push down on R going forward relative to our results in Exhibit 3.

That said, we think the key takeaway from our analysis is that Europe's mass immunisation success should significantly suppress the R number of the delta variant despite our reopening assumptions. While this analysis does suggest there is a risk rising infections in the Euro area later in the summer and during the winter, we think the key concern for policymakers will likely be the extent to which this may pose a risk of overflowing hospital capacity, which we discuss next.

The Risk of Hospital Overflow

Although the delta variant is responsible for a sharp rise in new cases in the UK, hospitalisations have nonetheless remained unusually low relative to previous waves of infections (Exhibit 4, left). This mainly reflects the significant skew of new infections towards younger age groups, which are less likely to be in need of hospitalisation. Moreover, recent evidence from the UK suggests that vaccines provide more protection against hospitalisations than infection risk (even among older age groups).[7] The steady progress in vaccinations across Europe has given immunity to large shares of the population, whereas the prioritisation of vulnerable groups early on has significantly frontloaded the gains in terms of lowering the overall risk of hospitalisation. To illustrate the latter, we use our vaccination timelines and assume vaccines have been distributed down the age distribution in buckets (similar to the approach in the UK).[8] Using external estimates of hospitalisation probabilities across age groups, we can compute the average risk of hospitalisation for a susceptible person (Exhibit 4, right).[9] We see that overall hospitalisation probabilities have fallen very sharply in both the UK and Euro area, from around 6-8% in December 2020 to below 1% at present (to as low as 0.4% in the UK).

Exhibit 4: The Decoupling of Cases and Hospitalisations

4. The Decoupling of Cases and Hospitalisations. Data available on request.
Source: Goldman Sachs Global Investment Research, Our World in Data, Public Health England
In a final step, given that our above analysis suggested non-zero risk of renewed outbreaks both in the Euro area and the UK later in the year, we calculate the pressure on hospital capacity in a very extreme scenario where every non-immune individual (i.e. either unvaccinated or without a prior infection) gets infected. This provides an upper bound on the potential pressure on hospitals in case of renewed large-scale outbreaks.
Exhibit 5 shows our results. Assuming all susceptible individuals had an infection in December last year would have implied the need for hospital beds that is vastly greater than actual capacity, ranging from 10 times in Germany to almost 25 times in Spain. Instead, we find that assuming all those non-immune in August this year get infected would result in a need for 60-140% of all available hospital beds. In October, this percentage falls to 60-90% across each of the EMU-4 economies and the UK. Therefore, even in a very extreme and very unlikely scenario where every susceptible person gets infected, the pressure on hospital capacity from here on would be comparable to the experiences during prior waves' peaks.[10] We consider this as a very unlikely and extreme worst-case scenario; our key takeaway instead is that the risk of hospital overflow from here on is vastly lower than at any point since February 2020.

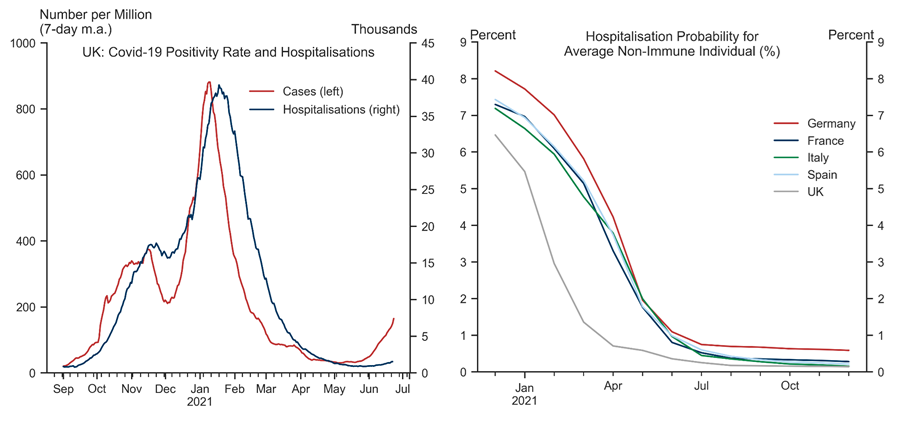
Exhibit 5: A Manageable Risk

5. A Manageable Risk. Data available on request.
Source: Goldman Sachs Global Investment Research
All in all, while the spread of the delta variant could pose some risk to our assumed reopening timelines across Europe—including via disruptions to international travel during the summer—we think the underlying risk it poses to our constructive view on Europe is manageable. Continued vaccine efficacy against all strains is a crucial element of our assessment.

Nikola Dacic

Appendix

Exhibit 6: An Overview of Recent Studies of the Impact of Weather Conditions on COVID-19 Transmission

6. An Overview of Recent Studies of the Impact of Weather Conditions on COVID-19 Transmission. Data available on request.
Source: Goldman Sachs Global Investment Research
  1. 1 ^ A caveat to this is that the amount of genome sequencing differs across countries, with more sequencing in the UK than in many other European countries, which could lead to an understatement of the prevalence of the delta strain in new cases in those countries.
  2. 2 ^ See, for example, equation (3.2) in Shaw and Kennedy (2021).
  3. 3 ^ See also "Lockdowns in SIR Models" by Benjamin Moll, May 2020.
  4. 4 ^ We calibrate the R number of the original strain to 2.9 in the UK and 2.63 in the Euro area following two respective studies (here and here). We assume the alpha strain has an R number that is 6-tenths higher than that of the original strain (see here). We assume the delta variant has an R that is 60% higher than that of the alpha variant (so equal to 5)—see here and here.
  5. 5 ^ Although our assumptions on natural immunity from past infections are fairly conservative, we do assume 'cross-variant' immunity. In other words, past infections with strains other than the delta strain are assumed to provide some immunity against the delta strain. Assuming away this form of natural protection against the delta variant would tend to raise the R number schedules shown in Exhibit 3 for the delta variant.
  6. 6 ^ A recent study by professors at Yale University has found that 17.5% of the virus' reproductive number was attributable to meteorological factors—implying potentially more significant effects of the climate than we assume here (additionally, we only focus on the temperature, and ignore factors such as humidity or radiation during the year).
  7. 7 ^ See, for example, a study from Public Health England, which estimates vaccine efficacy against hospitalizations at 94% after dose 1 and 96% after dose 2 for the Pfizer vaccine, and 71% after dose 1 and 92% after dose 2 for the Oxford-AstraZeneca vaccine. By contrast, another study from Public Health England estimates vaccines efficacy against symptomatic disease at 33% after dose 1 and 88% after dose 2 for the Pfizer vaccine, and 33% after dose 1 and 60-67% after dose 2 for the Oxford-AstraZeneca vaccine.
  8. 8 ^ This simplifying assumption is a proxy for the actual distribution process for vaccines across Europe.
  9. 9 ^ We obtain the age-specific hospitalisation rates from the "COVID-19 surveillance report" by the ECDC, available at https://covid19-surveillance-report.ecdc.europa.eu/. For simplicity, we assume these are identical across countries.
  10. 10 ^ For example, nearly 90% of hospital beds in England were reported to be full in mid-December last year as the alpha variant was spreading rapidly.

Investors should consider this report as only a single factor in making their investment decision. For Reg AC certification and other important disclosures, see the Disclosure Appendix, or go to www.gs.com/research/hedge.html.