Goldman Sachs Research
US Economics Analyst
A Persistent Productivity Pickup (Hill)
12 July 2021 | 8:34PM EDT | Research | Economics| By Jan Hatzius and others
More
  • Stronger productivity growth has been one of the silver linings of the pandemic, with 3.1% annualized growth in output per hour since the start of the crisis (vs. +1.4% in the previous business cycle). Higher-frequency measures indicate further gains in the middle of the year. In this Analyst, we explore the composition of the productivity acceleration to better understand its drivers and sustainability.

  • We find that productivity gains since 4Q19 are most pronounced in industries where virtual meetings are feasible and in-person expenses like travel & entertainment have scope to decline, for example information technology services, professional services, and product development/wholesale trade. These efficiency improvements from digitization continued in Q1 despite the reopening of the in-person economy and the partial return to corporate office buildings.

  • The retail sector ranks fourth across industries in terms of pandemic productivity performance, consistent with a boost from ecommerce and from evolving brick-and-mortar business models (expanding curb-side pickup, “Buy Online Pickup In Store”). Timely data indicate these gains persisted in Q2 even as malls reopened and the stimulus boost faded. The composition of retail employment is also consistent with efficiency gains from digitization, with four fewer cashiers and salespeople for every hundred workers (June 2021 vs. 2019).

  • Decomposing the 1.7pp acceleration in the productivity trend, we find that non-virus-sensitive services account for more than all of the within-industry acceleration (+1.1pp), with retail (+0.1pp) and goods production (+0.3pp) also contributing. We also find that the offsetting drag from still-depressed virus-sensitive categories (-0.7pp) itself has been roughly offset by the temporary boost from industry composition (+1.0pp). A full reversal of the final two effects would bring the annualized productivity trend to +2.8%, double its pre-crisis pace and within a tenth of our fundamental estimates of pandemic efficiency gains.

  • Company data mirror the productivity growth rebound in the GDP statistics and suggest that it continued into Q2. Operating margins for S&P 1500 nonfinancial services firms are tracking 180bp higher than pre-crisis, with even larger gains in industries where gains from digitization are clear-cut: technology services, professional services, and non-virus-sensitive consumer services.

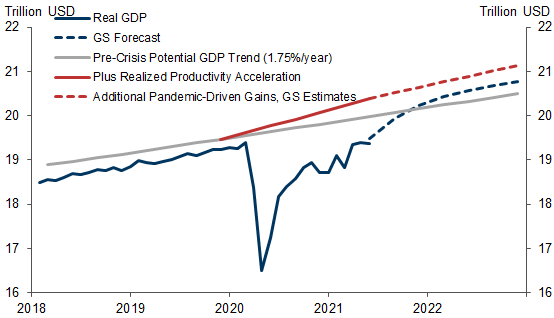
  • We continue to expect the evolution of business models and gains in worker efficiency to boost the level of productivity in the nonfarm business sector by around 4% by 2022—or a +1.3pp boost to annual productivity growth over three years. The productivity acceleration to date and our fundamental-based estimates suggest that the output gap is roughly twice as large as the pre-crisis trend would imply (at 4-4.5% in Q2). This would lengthen the runway for expansion as the business cycle matures.

A Persistent Productivity Pickup

Stronger productivity growth has been one of the silver linings of the coronacrisis. Output per hour in the nonfarm business sector rose 4.1% year-on-year in the first quarter, nearly triple its pre-crisis trend (1.4% since 2006). While year-on-year comparisons can be flattered by the early stages of the crisis, the multi-year trend is also improving (blue line in Exhibit 1). And higher-frequency productivity measures—monthly GDP per worker and the activity-employment spread in business surveys—indicate that the pickup was sustained into the middle of the year (grey and red lines, respectively).

Exhibit 1: The Reopening of the Economy Hasn’t Slowed the Productivity Acceleration

1. The Reopening of the Economy Hasn’t Slowed the Productivity Acceleration. Data available on request.
Source: Department of Commerce, Department of Labor, Haver Analytics, Goldman Sachs Global Investment Research
We estimate that the mix shift away from lower-productivity workers or industries accounts for less than 1pp of the cumulative productivity gains as of June[1] (see Exhibit 2), implying a pickup in the underlying trend as well.

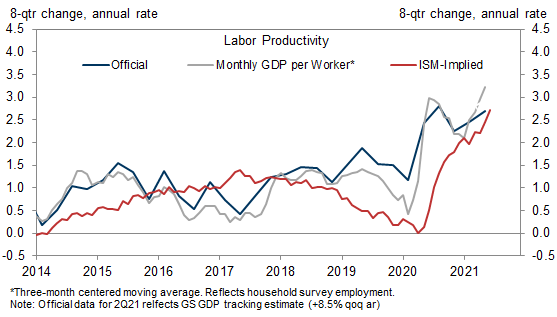
Exhibit 2: The Composition Boost from Fewer Hospitality and Retail Workers Has Mostly Unwound

2. The Composition Boost from Fewer Hospitality and Retail Workers Has Mostly Unwound. Data available on request.
Source: Department of Commerce, Department of Labor, Haver Analytics, Goldman Sachs Global Investment Research
In this edition of the Analyst, we explore the composition of the productivity acceleration in order to better understand its drivers and sustainability.
Pandemic Productivity Gains by Sector
In previous research, we argued that the digitization of the workplace would boost efficiency in industries for which virtual meetings are feasible and in-person expenses like travel and entertainment could sustainably decline. If this hypothesis is correct, the composition of coronacrisis productivity gains should be skewed towards these industries as well.
In Exhibit 3, we plot the cumulative growth in industry GDP per employee hour over the last 5 quarters, with dark blue columns representing services industries that are less reliant on face-to-face contact with customers and coworkers. Non-virus-sensitive services take the top 3 spots on this basis, and 4 of the top 6. Productivity in the information technology sector in particular appears to have benefited, probably reflecting a combination of worker efficiency gains and the boost to demand from the pandemic itself.

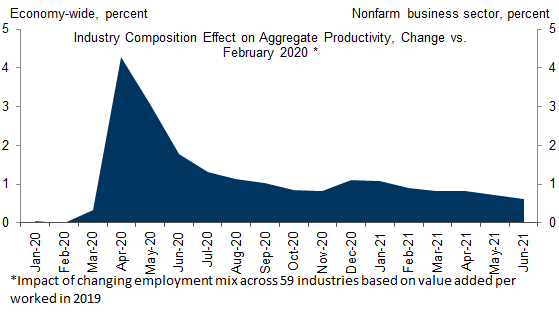
Exhibit 3: Post-Pandemic Productivity Gains Skewed Towards Industries Ripe for Digitization

3. Post-Pandemic Productivity Gains Skewed Towards Industries Ripe for Digitization. Data available on request.
Source: Department of Commerce, Department of Labor, Haver Analytics, Goldman Sachs Global Investment Research
If gains from workplace digitization are indeed sustainable, the reopening of corporate office buildings and the face-to-face economy should not be associated with a pause or reversal of these trends. And as shown in Exhibit 4, productivity improvement continued during the first quarter in three of these four industries—and it remained stable in the fourth.

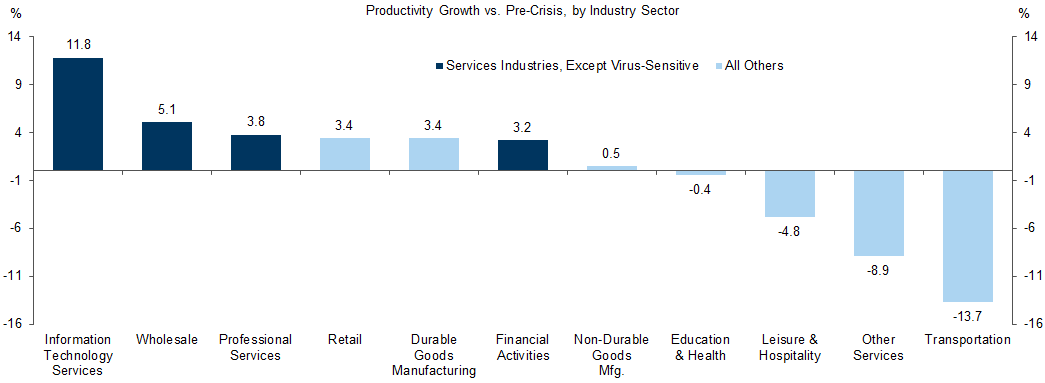
Exhibit 4: Productivity Surge in Non-Virus-Sensitive Services Continued During Q1

4. Productivity Surge in Non-Virus-Sensitive Services Continued During Q1. Data available on request.
Source: Department of Commerce, Department of Labor, Haver Analytics, Goldman Sachs Global Investment Research
A second channel boosting productivity during the pandemic was the accelerated demand shift to ecommerce, which generally requires less labor and real estate than brick-and-mortar retail. On top of this mix shift—which as of this spring shows no sign of reversing—traditional retailers evolved their own business models, expanding curb-side pickup, “Buy Online Pickup In Store”, and fulfillment of online orders directly from stores (as opposed to a distribution center). The combination of these two tailwinds likely explains why the retail sector ranks fourth in productivity growth over the last five quarters, despite the still-depressed level of mall traffic in Q1.
More recent data indicate that retailer productivity gains have persisted even as malls reopened. As shown in the left panel of Exhibit 5, goods consumption growth has continued to handily outpace employment in retail and support occupations like trucking and warehousing. And while the demand boost from the ARP Act stimulus checks likely exaggerated the underlying productivity of the sector in March and April, the May retail sales report and June high-frequency data continue to indicate revenue efficiency gains on the order of 10-15%.

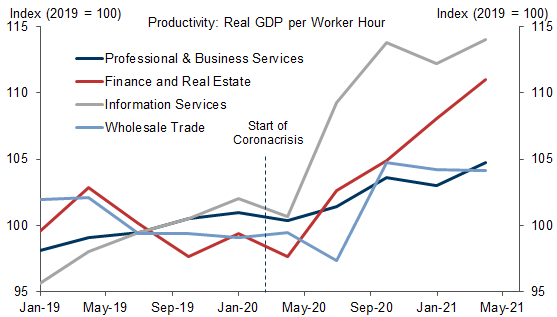
Exhibit 5: Retailer Productivity Gains Haven’t Reversed Despite the End of Stimulus Checks and the Reopening of Brick & Mortar; Digitization of the Consumer Experience Could Mean Fewer In-Person Sales Staff

5. Retailer Productivity Gains Haven’t Reversed Despite the End of Stimulus Checks and the Reopening of Brick & Mortar; Digitization of the Consumer Experience Could Mean Fewer In-Person Sales Staff. Data available on request.
Source: Department of Commerce, Department of Labor, Haver Analytics, Goldman Sachs Global Investment Research
As shown in the right panel of the same exhibit, the composition of retail employment is also consistent with efficiency gains from digitization, with four fewer cashiers and salespeople per hundred workers in the industry (June 2021 vs. 2019 average).
Temporary or Sustainable?
In Exhibit 6, we decompose nonfarm business-sector productivity growth since 4Q19 into three parts: a long-term trend (1.4% annualized since 2006), the contribution from within-industry growth (+0.7pp above trend), and a between-industry impact from changing employment shares (fewer leisure and retail workers on net, a +1.0pp annualized boost). Interestingly, more than all of the within-industry acceleration reflects non-virus-sensitive services (+1.1pp contribution), whereas still-depressed activity levels in virus-sensitive categories (ex-retail) have reduced business-sector productivity growth by 0.7pp (relative to trend).

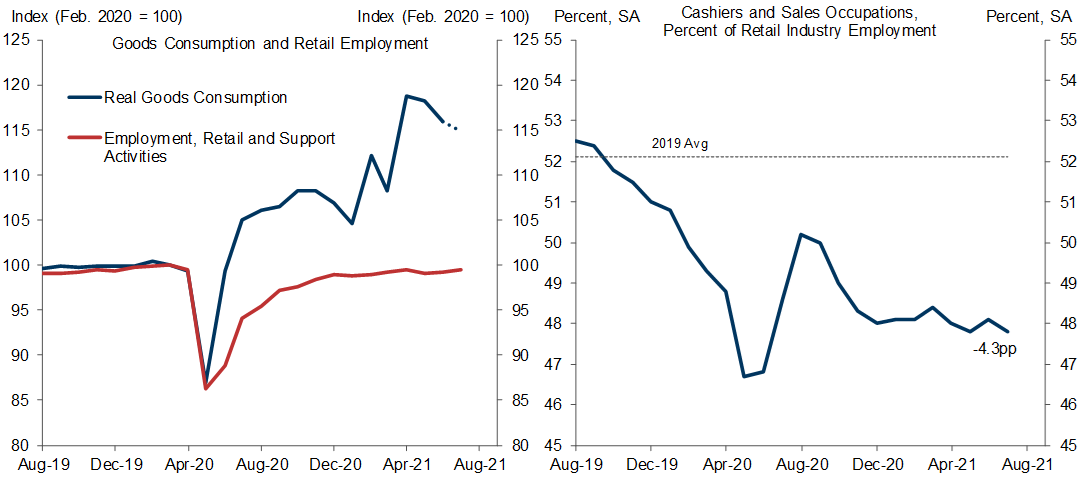
Exhibit 6: Most of the Productivity Pickup Looks Sustainable, as the Lingering Virus Drag and Composition Boost Are Roughly Offsetting

6. Most of the Productivity Pickup Looks Sustainable, as the Lingering Virus Drag and Composition Boost Are Roughly Offsetting. Data available on request.
Source: Department of Commerce, Department of Labor, Haver Analytics, Goldman Sachs Global Investment Research
Looking ahead, we expect most of the virus drag and the composition effect to reverse as the reopening continues, labor supply normalizes, and the economy approaches full employment. Illustratively, a full reversal of both would take the annualized pace of productivity growth to 2.8%. We see this as a reasonable assessment of the underlying pace of efficiency gains so far, and it is also very close to our fundamental estimates of pandemic-related productivity gains (final column, +1.3pp relative to the pre-pandemic trend).
We also do not expect a reversal of the +0.2pp contribution from the manufacturing industry. As an “essential industry” during the pandemic—but also one for which a remote or socially distanced workforce was not viable—the manufacturing sector was forced to confront many of the challenges of the pandemic early on. And it too found ways to adapt, specifically though a combination of safety equipment and protocols, employee quarantines and testing, and advance production- and inventory-planning.
By July 2020, manufacturing production had recovered over two thirds of the March/April collapse. And as shown in Exhibit 7, the full-year productivity results are even more impressive, with stable or higher real GDP per worker hour in nearly all subindustries—with the notable exception of aerospace, where the grounding of the 737-MAX disrupted production plans.

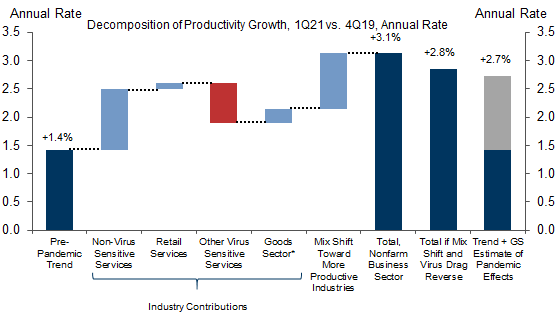
Exhibit 7: Manufacturers Generally Achieved Strong Productivity Growth During the Coronacrisis, Despite the Lockdowns and Rigid Health Protocols that Followed

7. Manufacturers Generally Achieved Strong Productivity Growth During the Coronacrisis, Despite the Lockdowns and Rigid Health Protocols that Followed. Data available on request.
Source: Department of Commerce, Department of Labor, Haver Analytics, Goldman Sachs Global Investment Research
The Corporate Crosscheck
Corporate profit margin data this year mirror the productivity growth rebound and its industry composition. As shown in Exhibit 8, operating margins for publicly traded firms in nonfinancial services industries are tracking 180bp higher than pre-crisis.

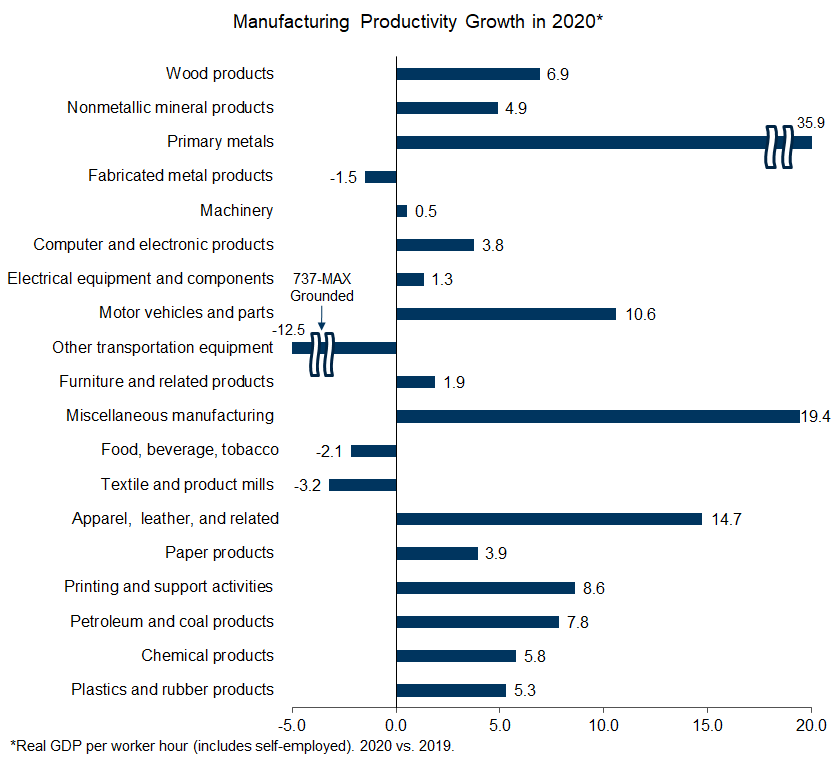
Exhibit 8: Corporate Margins Also Consistent with a Productivity Boost in the Service Sector

8. Corporate Margins Also Consistent with a Productivity Boost in the Service Sector. Data available on request.
Excludes Financials, Real Estate, Utilities, Telecom, and Goods-Producing industries. 2Q21 reflects analyst estimates based on pre-annoucements, company guidance, and projections, as well as actuals where available. SA by GS. Red reflects avearge in 1H21 .
Source: Department of Commerce, Department of Labor, Haver Analytics, Goldman Sachs Global Investment Research
And the improvement has been especially pronounced in the same set of industries where gains from digitization are most clear-cut: information technology services, professional services, and non-virus sensitive consumer services. The expansion of retailer margins this year—even when excluding internet retailers like Amazon and eBay— also echoes the productivity strength in the GDP statistics. Margin improvement most likely continued in these four industry groupings during the rapid reopening of the economy in the second quarter, based on company guidance and analyst estimates.

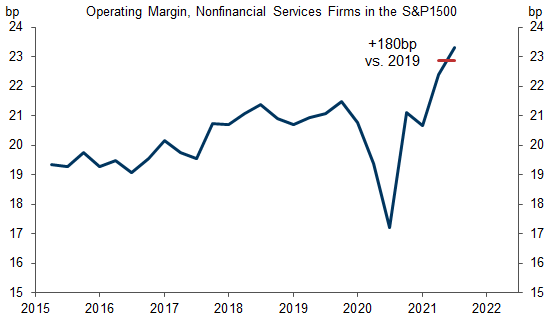
Exhibit 9: Margin Improvement Is Particularly Impressive Among Remote Work-Friendly Industries; Brick & Mortar Retailers Also Benefiting

9. Margin Improvement Is Particularly Impressive Among Remote Work-Friendly Industries; Brick & Mortar Retailers Also Benefiting. Data available on request.
Change vs. same quarter in 2019. 2Q21 reflects analyst estimates based on pre-annoucements, company guidance, and projections, as well as actuals where avaialble.
Source: Department of Commerce, Department of Labor, Haver Analytics, Goldman Sachs Global Investment Research
Taken together, the GDP by industry and corporate earnings data are consistent with a pickup in the productivity trend from 1½% pre-pandemic to around 3% over 2020-2022. As illustrated in Exhibit 10, the realized productivity acceleration and our fundamental based-estimates imply an output gap of 4-4.5% in Q2—roughly double the amount of economic slack than the pre-crisis productivity trend would imply. If sustained, these efficiency gains could delay the closure of the output gap into 2022 or beyond.

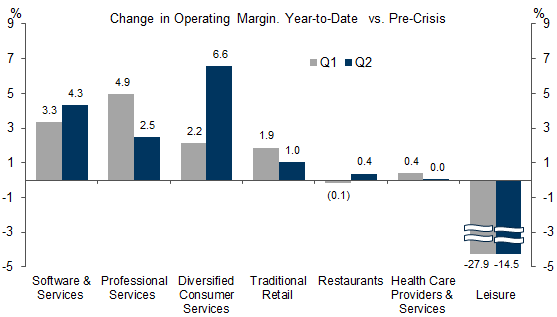
Exhibit 10: Pandemic-Driven Productivity Gains Imply a Longer Runway for Expansion

10. Pandemic-Driven Productivity Gains Imply a Longer Runway for Expansion. Data available on request.
GS estimates reflect a 1.3pp potential boost to nonfarm business sector productivity growth each year during 2020-2022. All potential GDP series assumes GS standing estimate of pre-pandemic output gap (-1.1% in 4Q19).
Source: Department of Commerce, Department of Labor, Haver Analytics, Goldman Sachs Global Investment Research

Spencer Hill

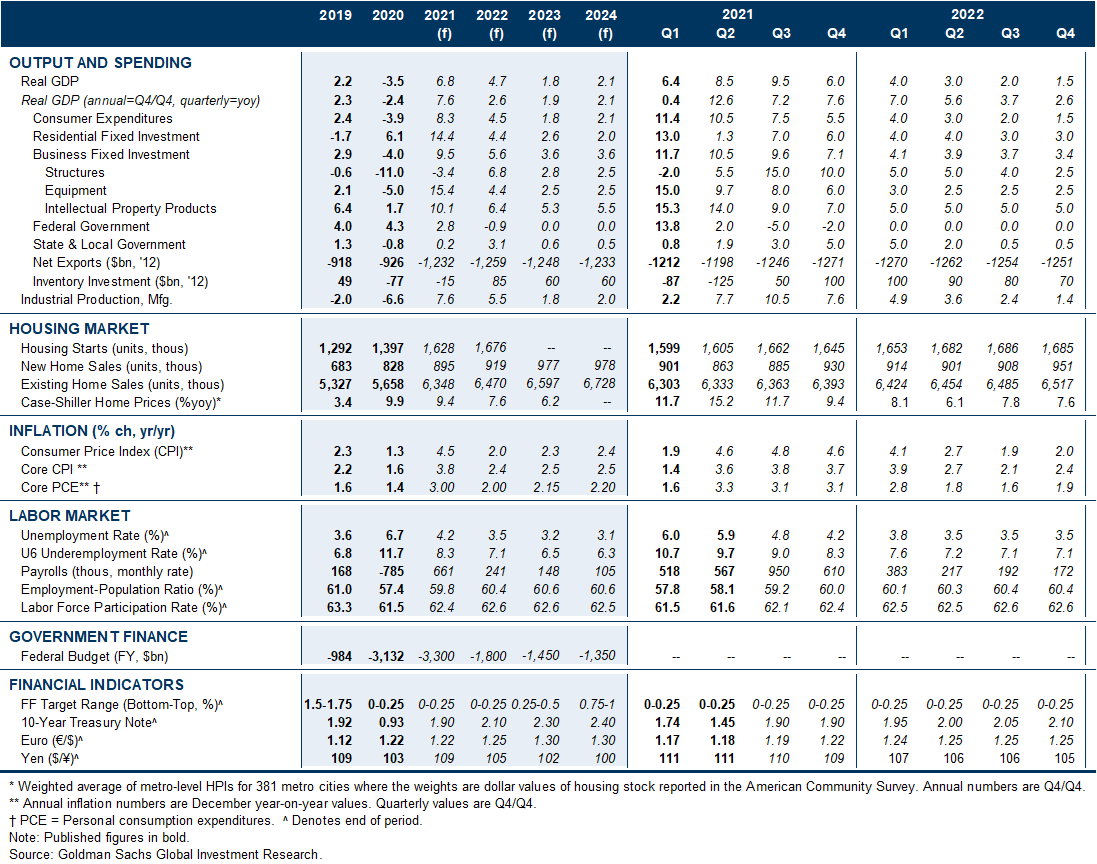
The US Economic and Financial Outlook
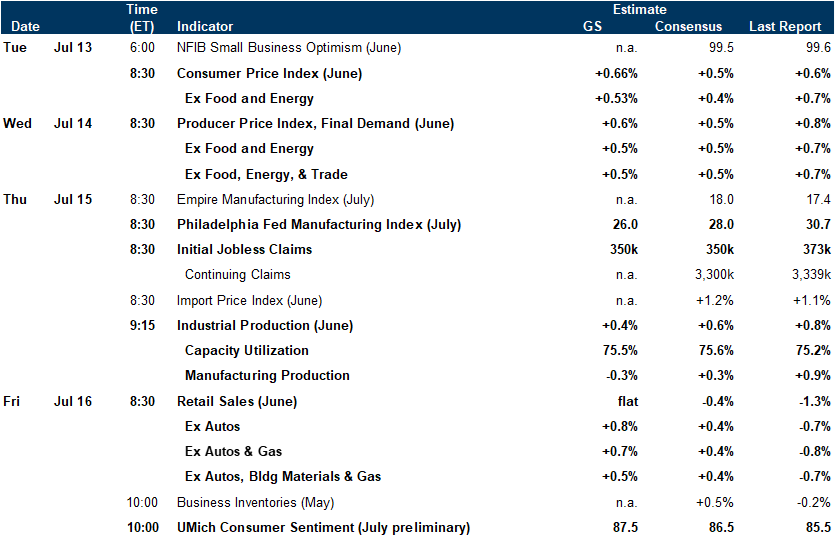
Data available on request.
Source: Goldman Sachs Global Investment Research

Economic Releases

Data available on request.
Source: Goldman Sachs Global Investment Research
  1. 1 ^ Over three-quarters of the lockdown-period distortions to productivity levels have unwound alongside the normalization in the jobless rate itself (5.9% in June, down from 14.8% in April 2020).

Investors should consider this report as only a single factor in making their investment decision. For Reg AC certification and other important disclosures, see the Disclosure Appendix, or go to www.gs.com/research/hedge.html.