Goldman Sachs Research
Global Economics Analyst
The Boost From Pent-Up Savings (Bhushan/Struyven)
15 July 2021 | 10:22PM EDT | Research | Economics| By Jan Hatzius and others
More
  • Market worries about a global growth slowdown have increased following virus resurgence, uncertainty about US fiscal stimulus, and China growth concerns. At the same time, the spending of "excess" savings households have accumulated during the pandemic once normal economic life returns could in principle sustain rapid growth. We estimate the growth boost from running down these “excess” savings in large economies.

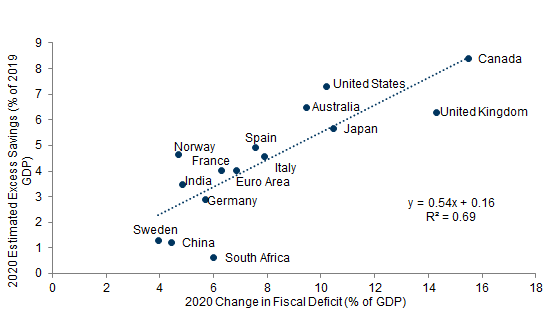
  • Households have accumulated $5tn in excess savings globally, concentrated among advanced economies, led by the US and Canada with 12% of 2019 GDP, and the UK with 10%. Excess savings are generally smaller in the emerging world but do account for 5% of GDP in India. Not surprisingly, countries with the most fiscal support in 2020 also have the highest excess savings.

  • Both the form in which excess savings are held and their distribution across households suggest that the propensity to consume out of savings will be larger than the typical propensity to spend out of wealth. We estimate that liquid currency and deposits have increased by an amount corresponding to 90% of excess savings across DMs. Although most of the excess savings in the US, Japan, and Canada are held by top income earners, when viewed as a share of consumption, they are distributed more equally.

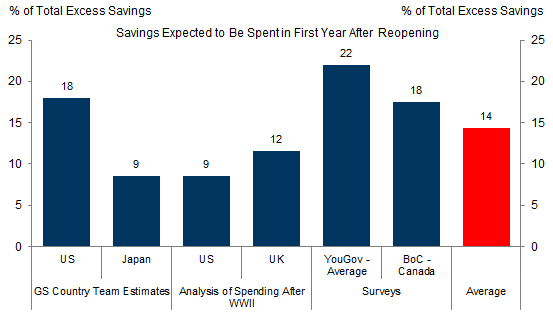
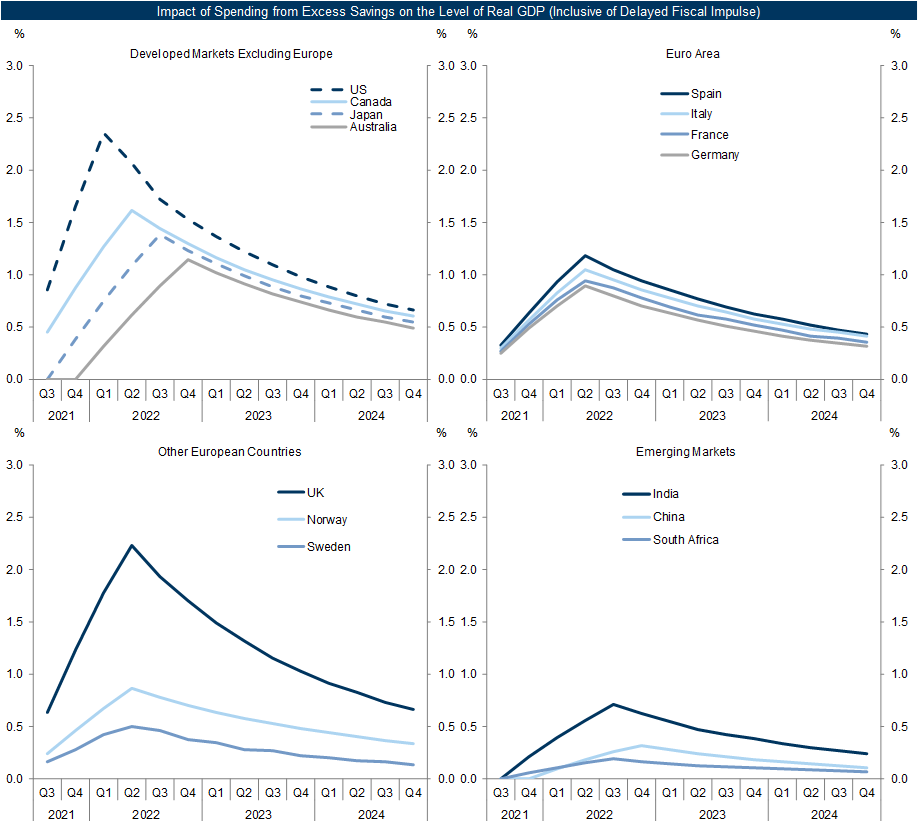
  • We estimate that 14% of excess savings will be spent within a year of reopening, on average, based on estimates from our US and Japan teams, the US and UK WW2 experience, and surveys. We estimate a peak boost from the run-down in excess savings, and inclusive of delayed effects of fiscal support to households, to the level of global GDP of 1% in mid-2022, and to global growth of 1¼pp at the start of next year. The GDP boost is the largest in the US and UK, peaking at 2¼%, followed by Canada, Japan, and Australia. The impact is more moderate in the Euro Area, and smaller in emerging markets, except for India.

  • Overall, our analysis of pent-up savings supports our still above consensus global GDP growth forecasts of 6.5% in 2021 and 4.8% in 2022, along with our optimistic view on global vaccinations.

The Boost From Pent-Up Savings

Market worries about a global growth slowdown have increased following the rapid spread of the Delta strain, downside risks to the US fiscal outlook, and China growth concerns. At the same time, the spending of "excess" or forced savings households have accumulated during the pandemic once normal economic life returns could in principle sustain rapid growth. In this Analyst, we use a globally consistent methodology to estimate the GDP boost from the run-down of excess savings in major economies.[1]

$5tn of Excess Savings

We first quantify global “excess” savings accumulated by households over the last six quarters, resulting from depressed consumption during the pandemic and strong fiscal support to disposable income. We estimate excess savings accumulated through 2021Q1 as actual savings minus the trend savings ratio estimated in 2015-2019 using national accounts data.[2] Next, we estimate excess savings accumulated in 2021Q2 as the average of 1) excess savings accumulated in 2021Q1—scaled by our GS Effective Lockdown Index[3] – and 2) the quarterly change in excess savings implied by the 2021 fiscal deficit (discussed in Exhibit 3).
We estimate that households have accumulated $5tn in excess savings globally, with 90% held in developed markets, especially the US (50%), and the Euro Area (20%). Intuitively, savings were built up the most rapidly in 2020Q2 and 2021Q1, when hospitalizations, restrictions, and fiscal support peaked in advanced economies (Exhibit 1). Excess savings are concentrated in advanced economies, led by the US and Canada with 12% of 2019 GDP, and the UK with 10%, followed by the Euro Area with a still notable 7% (Exhibit 2). Excess savings are generally smaller in the emerging world but do account for 5% of 2019 GDP in India.

Exhibit 1: We Estimate That Globally Households Have Accumulated $5tn in Excess Savings

1. We Estimate That Globally Households Have Accumulated $5tn in Excess Savings. Data available on request.
Source: Haver Analytics, Goldman Sachs Global Investment Research

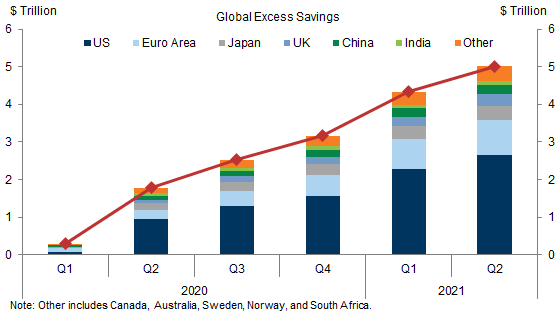
Exhibit 2: The US, Canada, and the UK Have the Highest Stock of Excess Savings

2. The US, Canada, and the UK Have the Highest Stock of Excess Savings. Data available on request.
Source: Haver Analytics, Goldman Sachs Global Investment Research
Not surprisingly, countries with the most fiscal support in 2020 also show the highest excess savings, as fiscal support replaced labor income for many people who became unemployed or furloughed. Exhibit 3 shows the tight relationship between the 2020 change in the fiscal deficit and excess savings accumulated in 2020, with advanced economies in North America and Asia-Pacific standing out on both dimensions.

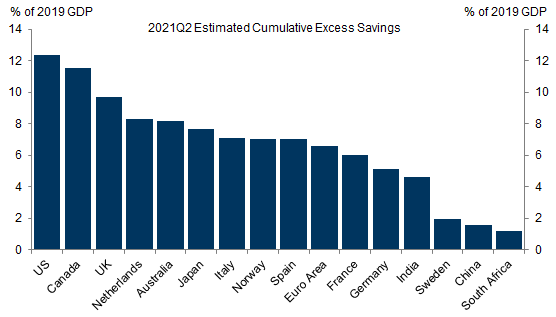
Exhibit 3: Countries with the Most Fiscal Support in 2020 Also Show the Highest Excess Savings

3. Countries with the Most Fiscal Support in 2020 Also Show the Highest Excess Savings. Data available on request.
Source: Goldman Sachs Global Investment Research

Who Saved During the Pandemic and How?

Statistical models of consumer spending generally imply that households consume only a few cents per dollar out of their wealth. However, both the form in which excess savings are held and their distribution suggest that the propensity to consume out of excess savings will be larger than the typical propensity to spend out of wealth.
Exhibit 4 shows that the increase in currency and deposits—the most liquid and thus easy to spend asset—corresponds to around 90% of excess savings on average across DMs. Excess currency and deposits as a share of excess savings are larger in Sweden and the US, but at only 40% in Canada and Norway, suggesting that the share of savings that will be spent will differ substantially across countries.

Exhibit 4: Across DMs, The Increase in Excess Liquid Currency and Deposits Corresponds to 90% of Excess Savings

4. Across DMs, The Increase in Excess Liquid Currency and Deposits Corresponds to 90% of Excess Savings. Data available on request.
Source: Goldman Sachs Global Investment Research
The distribution of excess savings across households also matters because lower income households have a higher marginal propensity to consume. When viewed as a share of total aggregate excess savings, large proportions are held by top income earners in the US, Japan, and Canada (Exhibit 5, left). However, excess savings as a share of consumption are distributed much more equally.

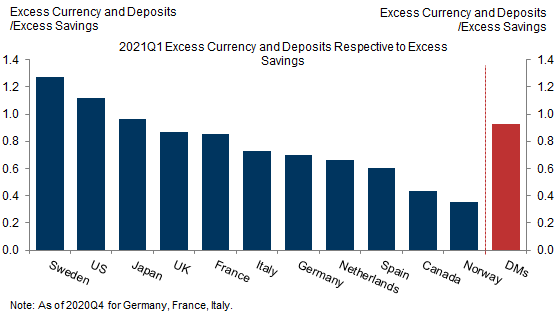
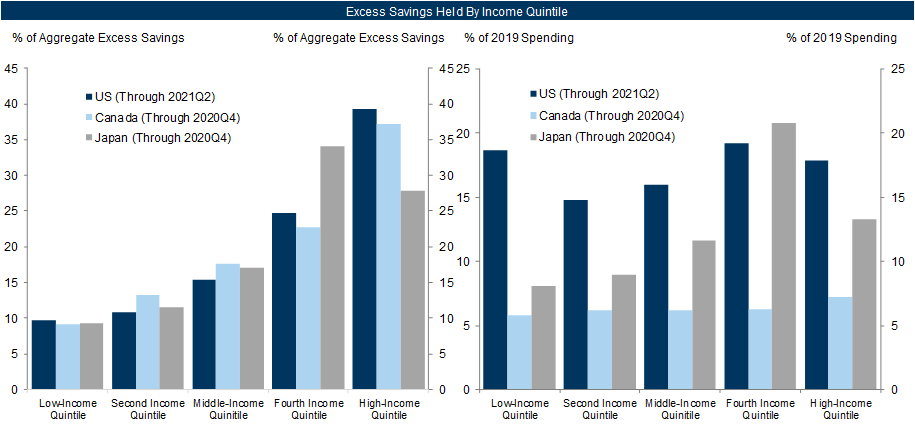
Exhibit 5: A Large Share Of Aggregate Excess Savings Are Held by the Rich, but Are More Equally Distributed as a Share of Consumption

5. A Large Share Of Aggregate Excess Savings Are Held by the Rich, but Are More Equally Distributed as a Share of Consumption. Data available on request.
Source: Goldman Sachs Global Investment Research, Bank of Canada

How Much Will Be Spent: A Global Approach

We next construct globally consistent growth impulses from pent-up spending in three steps.

Step 1: Estimation of the International Average Spending Propensity

We estimate the average share of pent-up savings spent in the first year based on three methods:
1. GS country team estimates. Using the distribution of savings across households and assets and a detailed review of spending propensities, our US team estimates that 18% of excess savings will be spent within a year, lifting real GDP (excluding delayed fiscal effects) by 1% in 2022 (Exhibit 6). Our Japan team estimates that 9% of excess savings will be spent in the first year based on the historical elasticity of household spending to lagged cash and deposits.

Exhibit 6: Our US Team Estimates that Spending from Excess Savings Will Lift Real GDP by 1% In 2022, Exclusive of Delayed Spending Effects of Fiscal Support to Households

6. Our US Team Estimates that Spending from Excess Savings Will Lift Real GDP by 1% In 2022, Exclusive of Delayed Spending Effects of Fiscal Support to Households. Data available on request.
Source: Goldman Sachs Global Investment Research
2. WW2 Experience. Excess savings built up during WW2 provide the closest available analogue in modern history. Exhibit 7 shows how the saving rate spiked in the US and the UK during the war and then undershot its long-run average in the late 40s. We estimate that 9% and 12% of the excess savings were spent in the first year after the war in the US and the UK, respectively.[4]

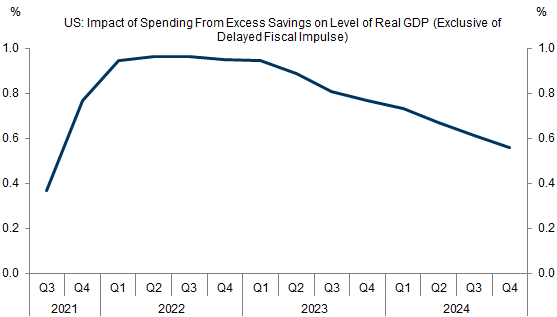
Exhibit 7: The US and UK Ran Down Some of Their Excess Savings Built Up During WW2 in the Postwar Period

7. The US and UK Ran Down Some of Their Excess Savings Built Up During WW2 in the Postwar Period. Data available on request.
Source: Bureau of Economic Analysis, ONS, Goldman Sachs Global Investment Research
3. Surveys. We use the YouGov survey question, “How much of the money you’ve saved during the pandemic do you think you’ll spend before the end of the year?”, to estimate an average 22% share spent in the first year and the Bank of Canada’s Canadian Survey of Consumer Expectations finding that consumers expect to spend over one-third of their excess savings in the next two years, corresponding to around 18% within a year.
Averaging across the three methods, we estimate that 14% of excess savings will on average be spent within a year (Exhibit 8).

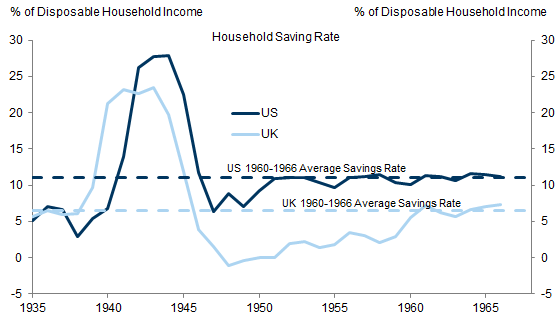
Exhibit 8: We Estimate That 14% Of Excess Savings Will Be Spent Within a Year

8. We Estimate That 14% Of Excess Savings Will Be Spent Within a Year. Data available on request.
Source: Bureau of Economic Analysis, ONS, YouGov, Bank of Canada, Goldman Sachs Global Investment Research

Step 2: Estimation of Country Spending Propensities

We next estimate the country-specific share of saving spent within a year using the international average and range from step 1, shown in Exhibit 8, and a cross-country index of spending propensities, shown in Exhibit 9.[5]
We define the spending propensity index as the weighted average of z-scores of 1) the increase in currency and deposits relative to excess savings (50% weight), 2) the share of population vaccinated by year-end (30%), and 3) an average of YouGov survey based spending estimates (20%).[6] Exhibit 9 suggests that Sweden and emerging markets, where we assume a high share of savings are stored in currency and deposits, are likely to spend the most of their excess savings, alongside the UK, where vaccination is progressing rapidly and which scores highly on surveys. Norway, Italy, and Canada are likely to spend a smaller share of excess savings because they are stored in a less liquid form.

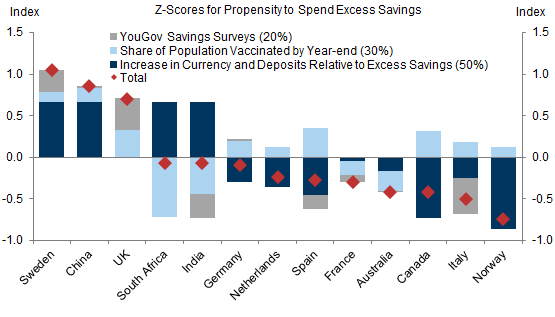
Exhibit 9: Sweden, China, and The UK Will Likely Spend the Most Per Dollar of Excess Savings, While Canada, Italy, and Norway Will Likely Spend the Least

9. Sweden, China, and The UK Will Likely Spend the Most Per Dollar of Excess Savings, While Canada, Italy, and Norway Will Likely Spend the Least. Data available on request.
Source: YouGov, Goldman Sachs Global Investment Research

Step 3: Estimation of the Growth Impulse

Finally, we construct quarterly pent-up spending growth impulses, which are inclusive of the spending impact of fiscal income support to households delayed after 2021H1. For each country, we specify a quarter where excess savings start to be run down based on our vaccination and reopening timelines, and assume that the spending share peaks after about a year, before it declines along with a run-down in the most liquid assets held by high propensity households.
We estimate that spending from excess savings will boost the level of global GDP by a peak of 1% in mid-2022 and annualized global growth by 1¼pp at the start of next year before turning negative in the back-end of 2022. The boost to annualized growth is much larger in advanced economies, peaking at 2pp by the end of this year, than the ½pp boost early next year in emerging markets.

Exhibit 10: Spending from Excess Savings Will Boost Global Growth Rate by 1¼pp at the Start of Next Year

10. Spending from Excess Savings Will Boost Global Growth Rate by 1¼pp at the Start of Next Year. Data available on request.
Source: Goldman Sachs Global Investment Research
By country, the estimated boost to the level of GDP is the largest in the US and UK, peaking at 2¼% next year, followed by Canada, Japan, and Australia (Exhibit 11). The impact is more moderate in the Euro Area, and the smallest in emerging markets, although we expect a larger boost for India than for China and South Africa.

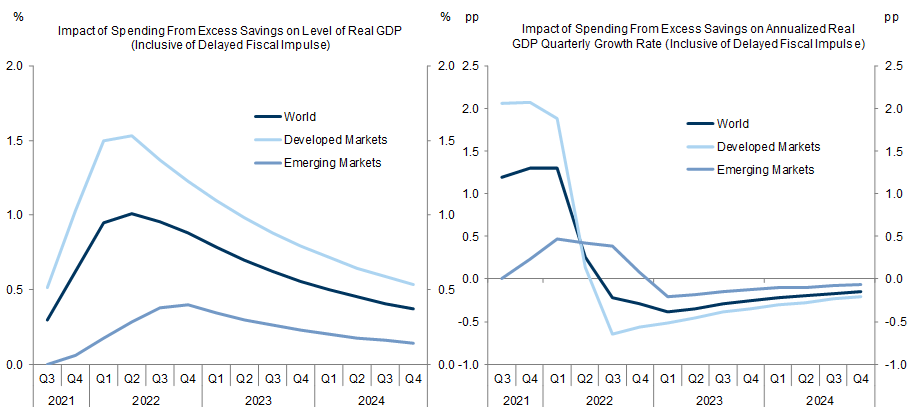
Exhibit 11: The Estimated Impact on Real GDP Is the Largest in the US and UK, Peaking at 2¼% In 2022

11. The Estimated Impact on Real GDP Is the Largest in the US and UK, Peaking at 2¼% In 2022. Data available on request.
Source: Goldman Sachs Global Investment Research
Taken together, our analysis of pent-up savings supports our still-above consensus global GDP growth forecasts of 6.5% in 2021 and 4.8% in 2022, along with our optimistic view on global vaccinations.

Sid Bhushan

Daan Struyven

  1. 1 ^ See Joseph Briggs and David Mericle, “Pent-Up Savings and Post-Pandemic Spending”, US Economics Analyst, 15 February 2021; Christian Schnittker, “The Great Post-Pandemic Savings Unwind”, European Economics Analyst, 17 January 2021; Nikola Dacic, “Consumer Spending After the Saving Windfall”, European Economics Analyst, 12 July 2021; Naohiko Baba, “Pent-Up Demand – How Much Will Be unlocked, and By Whom?”, Japan Economics Analyst, 28 April 2021; Maggie Wei, “China: Households’ excess savings around the pandemic”, Asia in Focus, 15 March 2021.
  2. 2 ^ For Japan and India, where we do not have 2021Q1 savings data, we estimate savings based on consumption growth during the quarter.
  3. 3 ^ Our Europe team has estimated that restrictions drove much of the excess savings. See Christian Schnittker, “The Great Post-Pandemic Savings Unwind”, European Economics Analyst, 17 January 2021 and Nikola Dacic, “Consumer Spending After the Saving Windfall”, European Economics Analyst, 12 July 2021.
  4. 4 ^ See Laura Nicolae, “Pent-Up Savings and inflation After World War 2”, US Daily, 25 February 2021.
  5. 5 ^ For our range, we take the second highest and second lowest of the five estimates in step 1.
  6. 6 ^ YouGov surveys are the average of 1) how much of pandemic savings do you expect to spend by the end of the year, 2) has your household been able to save more, and 3) how has your household’s financial situation changed since the start of the pandemic. For missing values, we assume the sample average, apart from emerging markets which are missing data on currency and deposits, where we assume the maximum because other financial markets (e.g. equity) are likely less developed than in advanced economies.

Investors should consider this report as only a single factor in making their investment decision. For Reg AC certification and other important disclosures, see the Disclosure Appendix, or go to www.gs.com/research/hedge.html.