Goldman Sachs Research
US Economics Analyst
The Capex Reset: New Investment for the New Work Environment (Briggs)
16 August 2021 | 12:25AM EDT | Research | Economics| By Jan Hatzius and others
More
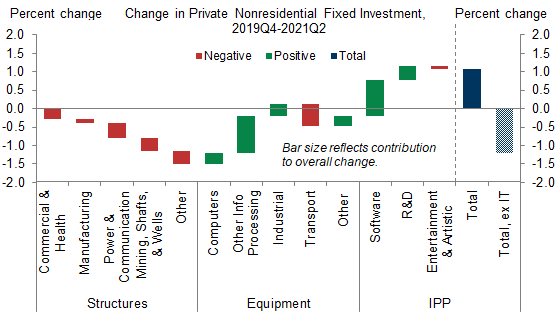
  • Business fixed investment surpassed its pre-recession level in 2021Q2, a much quicker recovery than after other recent downturns. But the recovery has been very imbalanced and mostly driven by information technology spending so far. In this week’s US Economic Analyst we update our capex outlook.

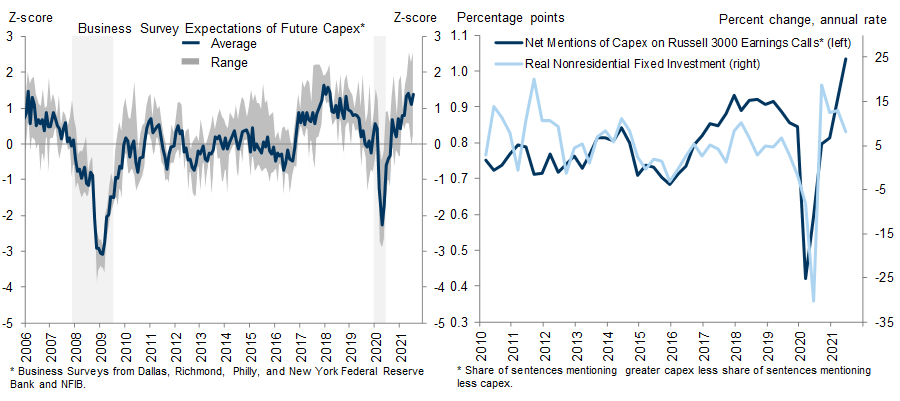
  • In the near-term, we expect the capex rebound to continue at a brisk pace. Our capex tracker, investment expectations from business surveys, and a new measure of capex plans from company earnings calls have all surged to very high levels.

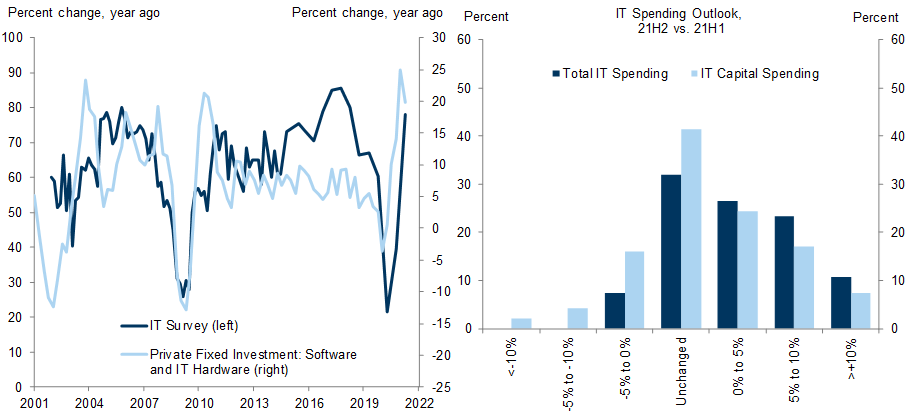
  • In the medium-term, three factors will shape the capex outlook. First, the shift to remote work has led to an oversupply of office space, causing a 20% decline in office structures investment that is unlikely to reverse until 2022. However, the shift to remote work has led to strength in IT investment that will likely continue. We expect spending on hardware to grow strongly in 2022H1 as office attendance increases and supply chains normalize.

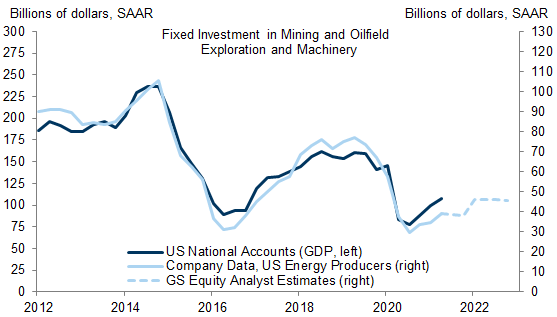
  • Second, oil and gas capex—a volatile category that has historically been a main driver of changes in overall business investment—looks set for a lackluster recovery, although the rise of clean energy could provide a tailwind later in our forecast horizon.

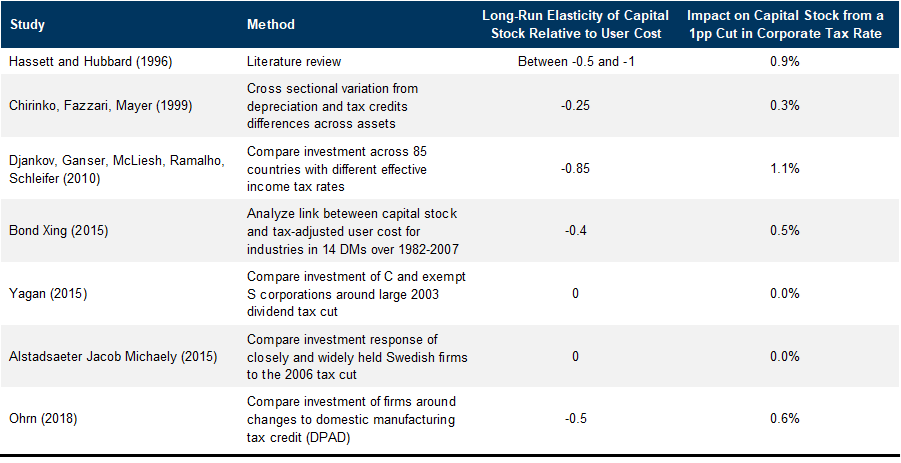
  • Third, we expect the current budget reconciliation bill will increase corporate taxes by more than $900bn over 10 years, corresponding to a 3pp increase in the effective corporate tax rate. Although prior academic studies suggest that such an increase could create a moderate drag on investment, we expect any impact will be small because capex has been relatively insensitive to recent tax changes and investment incentives included in the bill should dampen its impact.

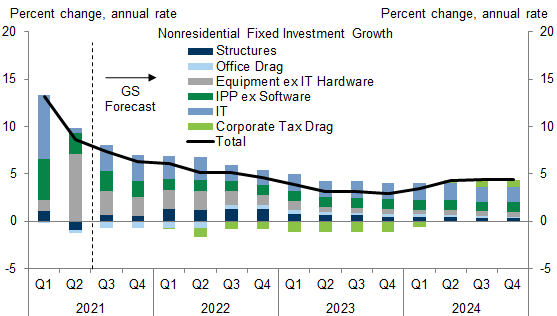
  • After incorporating these factors into our updated business investment model, we expect that capex will grow at a roughly +7% annualized rate in 21H2 and a +6% rate in 2022, before decelerating to +4% in 2023 and 2024.

The Capex Reset: New Investment for the New Work Environment

Nonresidential fixed investment bounced back from the pandemic quickly and surpassed its pre-pandemic level in 2021Q2. This recovery in capex is much quicker than in other recent downturns, which on average took over three years to reach pre-recession levels (Exhibit 1).

Exhibit 1: Business Investment Has Rebounded Faster Than in Recent Downturns

1. Business Investment Has Rebounded Faster Than in Recent Downturns. Data available on request.
Source: Bureau of Economic Analysis, Goldman Sachs Global Investment Research
But the composition of the quick capex recovery is quite imbalanced. Exhibit 2—which decomposes the change in capex since the start of the pandemic—shows that the recovery is predominantly explained by very strong spending on information technology (IT; defined to include computers, other information processing hardware, and software) and R&D, while investment in most other categories, and structures in particular, remains depressed. Moreover, these patterns were broadly mirrored in the Q2 GDP report, which showed continued strength in information processing equipment, software, and R&D and continued weakness in structures, although computer capex pulled back and transport equipment capex received a boost from Boeing resuming 737 MAX shipments.

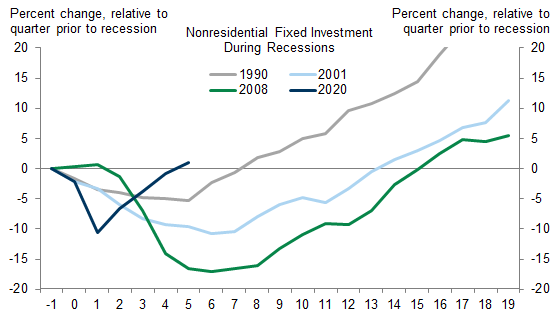
Exhibit 2: The Capex Recovery Has Been Mostly Driven by Investment in Information Technology

2. The Capex Recovery Has Been Mostly Driven by Investment in Information Technology. Data available on request.
Source: Bureau of Economic Analysis, Goldman Sachs Global Investment Research
In light of these trends, in this week’s US Economic Analyst we update our capex outlook. We look first at what survey data tell us about near-term spending intentions. We then look at the three key factors that will shape the medium-term capex outlook: remote work, the energy sector, and tax policy changes. We conclude by incorporating our findings into our business investment forecasting model.

The Near-Term Capex Outlook: A Continued Rebound

We see several reasons to be optimistic about capex spending in the near-term. First, our capex tracker—which summarizes the signal from monthly data related to investment—remains elevated, with the July level consistent with 9.6% growth (Exhibit 3).

Exhibit 3: Our Capex Tracker Continues to Suggest Strong Growth in Nonresidential Fixed Investment

3. Our Capex Tracker Continues to Suggest Strong Growth in Nonresidential Fixed Investment. Data available on request.
Source: Bureau of Economic Analysis, Goldman Sachs Global Investment Research
Forward-looking measures of capex also send a very positive signal. Capex expectations measures from the New York Fed, Philadelphia Fed, Richmond Fed, Dallas Fed and NFIB business surveys—which ask about capital spending plans either 3 or 6 months ahead—are well above their historical averages (left chart, Exhibit 4). Regressing this expectation measure on one quarter ahead capex growth suggests that the current level is consistent with +9% (annual rate) capex growth.
Company commentary also supports a positive-near term outlook. Using an approach we previously developed to predict price changes, we use nearly 100,000 transcripts of earnings calls from Russell 3000 companies over the last decade to construct an aggregate measure of capex plans. We isolate sentences in each transcript that mention capex, count the number that suggest increases or decreases, and define the “net capex score” as the difference between the share mentioning increases and the share mentioning decreases.
This net capex score—which tracked real nonresidential fixed investment reasonably well last cycle—surged in the 2021Q2 earnings season (right chart, Exhibit 4). This finding is consistent with one of our portfolio strategy team’s main takeaways from 21Q2 earning calls: Corporate balance sheets are flush with cash, and many companies intend to use this cash to invest for growth.

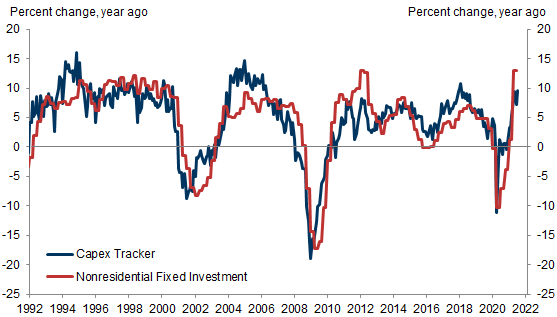
Exhibit 4: Forward Looking Capex Measures Also Send a Very Positive Near-Term Signal

4. Forward Looking Capex Measures Also Send a Very Positive Near-Term Signal. Data available on request.
Source: Federal Reserve, Bureau of Economic Analysis, Goldman Sachs Global Investment Research
Despite several overwhelmingly positive near-term signals, we do see some downside risk to the near-term outlook. In particular, if challenges from the Delta variant of COVID-19 limit supply or push up prices, some companies may delay some equipment investment until supply chains normalize.

The Medium-Term Capex Outlook: Three Factors

Three key factors will determine the strength and composition of capex in the medium term: remote work, the energy sector, and tax policy changes.

The Post-Pandemic Work-From-Home Economy

The first key factor we consider is the shift to increased remote work. According to data from the BLS, the share of workers in industries where work is primarily done in an office (e.g., information, financial activities, professional and business services) who are currently working from home has fallen from over 60% in May 2020 to just under 30% in July 2021. While this share will likely fall further as more offices reopen this fall and winter, by most indications a larger share of workers will work from home in the post-pandemic economy. For instance, the most recent GS Office Survey from our REITs analysts suggests that the average office worker in the median city expects to spend a half day per week less in the office relative to prior to the pandemic (4.0 vs. 4.5 days/week) by mid-2022, suggesting an 11% reduction in office-utilization in the long run.
To quantify the implications of reduced office utilization, the left chart in Exhibit 5 shows the square feet of office space per worker, adjusted for remote work according to the BLS’ data and projected through end-2021 and end-2022 using the GS Office Survey. After fluctuating between 242-278 sq. ft./worker in the 20 years prior to the pandemic, square feet per worker spiked in 2020 when workers shifted to a work-from-home arrangement, currently stands at 355 sq. ft./worker, and is expected to remain near the top-end of its historic range at end-2022 (272 sq. ft./worker).
The decline in utilization has led to decreased investment. Real investment in office structures has declined for 6 consecutive quarters and currently stands 20% below its pre-pandemic level (right chart, Exhibit 5). We see scope for further declines in the near-term, especially since leading indicators like the Architecture Billing Index for commercial and institutional projects—which tends to lead construction by 9-12 months—remained in contractionary territory through March 2021, suggesting a meaningful turn-around won’t start until early-2022.
To project office structures investment forward, we assume that the drag on office investment (relative to trend) increases modestly through mid-2022 before starting to fade slowly at a rate such that the capital stock adjusts to new attendance patterns by end-2025. Although noticeable, the aggregate impact of this drag is limited, since office-investment accounted for only 14% of structures investment and 3% of overall nonresidential fixed investment prior to the pandemic.

Exhibit 5: Office Utilization Has Decreased, Leading to an Increase in Square Feet of Office Space Per Worker and a Decline in Office Structures Investment

5. Office Utilization Has Decreased, Leading to an Increase in Square Feet of Office Space Per Worker and a Decline in Office Structures Investment. Data available on request.
Source: CoStar, Bureau of Economic Analysis, Goldman Sachs Global Investment Research
While the shift to remote work has created a drag on office investment, it has been more than offset by a pick-up in IT capex (see Exhibit 2), with software and hardware purchases both surging as companies adapted to the new work environment. Looking ahead, we expect investment in IT categories to remain strong in the near-term based on commentary from our technology equity analysts and expansionary reads from their leading IT spending indicators.
Supporting this view, the most recent GS IT Spending Survey—which surveys CIOs about spending intentions—jumped into expansionary territory for the first time since the start of the pandemic (left chart, Exhibit 6), with most companies indicating they intend to increase both total IT and IT hardware spending in 2021H2 relative to 2021H1 (right chart, Exhibit 6). We also anticipate increased investment in computers and other information processing equipment in 2022H1 as office attendance and supply chains normalize.

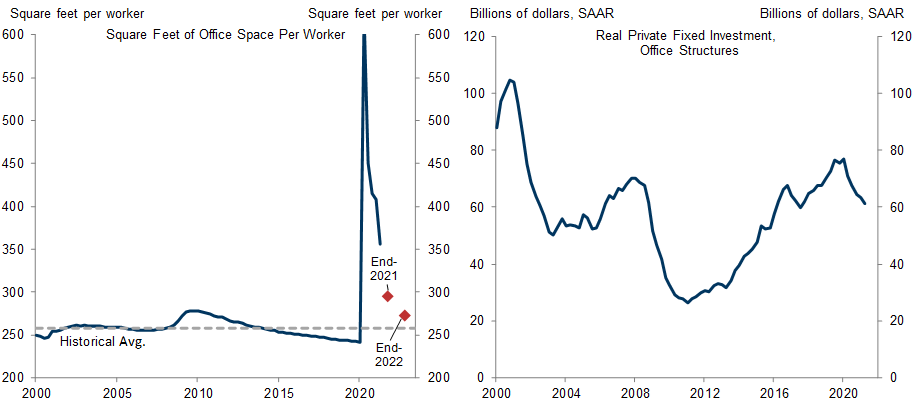
Exhibit 6: The GS Spending Survey Suggests Continued Increases in IT Investment

6. The GS Spending Survey Suggests Continued Increases in IT Investment. Data available on request.
Source: Bureau of Economic Analysis, Goldman Sachs Global Investment Research

A Lackluster Outlook For Oil and Gas

Investment in energy and mining is the second key factor that will shape the medium-term capex outlook. Investment in oil and gas equipment and structures is volatile and has historically accounted for a disproportionate share of variation in overall capex relative to its small share (5% last cycle).
Capex guidance from companies themselves suggests lackluster energy investment through 2022. Aggregating across quarterly capital expenditures of US energy producers in the GS coverage universe provides a capex measure that has historically tracked energy and mining-sector investment in the GDP accounts very closely (Exhibit 7). Projecting forward, our equity analysts expect a slight recovery from a very low level in 2022H1, but see limited scope for a full recovery to pre-pandemic levels through our forecast horizon.

Exhibit 7: Guidance from US Energy Producers Suggests a Lackluster Capex Recovery

7. Guidance from US Energy Producers Suggests a Lackluster Capex Recovery. Data available on request.
Source: Bureau of Economic Analysis, Goldman Sachs Global Investment Research
Investment in clean energy—with support from Biden administration proposals that may be incorporated in the fiscal legislation currently being considered—will likely eventually provide a tailwind to capex and help fill the gap from weak oil and gas investment, but we expect its largest effect will be several years in the future.

A Fiscal Drag on Capex from Corporate Tax Increases

Third, we expect the current budget reconciliation bill will raise $500bn over 10 years by raising the statutory corporate tax rate to 25%, as well as another $400bn by raising taxes on foreign income. In standard economic models, firms choose to invest if the payoff exceeds the user cost of capital. Because the user cost of capital increases with tax rates, such models imply that tax increases should depress investment.
The effect of corporate tax changes on business investment is ultimately an empirical question, and the limited amount of recent research on this topic finds mixed results. As shown in Exhibit 8, a 1 percentage point (pp) increase in the statutory rate is likely associated with a decrease in the capital stock of 0 to 1%. With a nonresidential capital-to-investment ratio of about 10, the cumulative impact on investment from a 1pp statutory rate increase could range from 0 to -10%.

Exhibit 8: Estimates of the Impact of Corporate Tax Changes on Investment Vary Across Studies

8. Estimates of the Impact of Corporate Tax Changes on Investment Vary Across Studies. Data available on request.
Source: Goldman Sachs Global Investment Research
We see two reasons why the impact of corporate tax increases on investment will likely fall towards the lower end of this range. First, the large corporate tax cuts in 2017 had a small impact on investment but led to a jump in cash spent on buybacks. Along these lines, our portfolio strategists expect that coming corporate tax increases will weigh on buybacks—which tend to be more volatile—more than dividends, capex, and R&D.
Second, we expect the coming fiscal legislation will include several investment incentives—including $180bn for R&D, $50bn in semiconductor manufacturing, $10bn for supply chain incentives, and $250bn for power/renewable energy—that should help offset the impact of tax increases.
To forecast the effects of corporate tax changes on capex, we assume that a 1pp increase in the corporate tax rate is associated with a .2% decrease in the capital stock, implying a cumulative long-run capex drag of 2% for each 1pp increase in the effective tax rate. After accounting for investment-related tax credits, we estimate that the effective tax rate will increase by around 1.5pp in 2022-2024, implying a cumulative investment impact of around 3%. Based on recent academic work that finds the investment impact of tax changes peaks with a two-year lag,[1] we assume that the cumulative impact fades in slowly and peaks in early 2024.

Updating Our Business Investment Forecast

To update our private nonresidential fixed investment forecast, we use our standard capex model. To forecast equipment (excluding energy and air transport and IT equipment through 2022) and structures investment (excluding energy), we rely on a statistical model that incorporates changes in our financial conditions index, lagged consumption growth, corporate cash flow, forward-looking expectations of demand such as consensus growth forecasts, and survey measures of forward-looking company expectations.
To forecast energy investment, air transport equipment, and IT equipment, we rely on forecasts from our sector analysts, scaled to align with investment in the GDP accounts. To forecast IPP, we similarly rely on sector analysts’ forecasts for the remainder of 2021, after which we assume growth reverts to its long-run trend.
Finally, we overlay our estimated drag from higher corporate taxes, which we assume affects investment across categories proportionally to their share of overall investment. We also overlay our estimated office-structure investment drag, which subtracts from overall structures investment.
The resulting forecast from this model is shown in Exhibit 9. We expect that the quick recovery in demand seen thus far, positive near-term investment signals, and continued strength in IT investment will continue to support capex growth in the near- and medium-term, but expect a modest drag from corporate tax increases at longer horizons. Overall, we expect that capex will grow at a +7.4% annualized rate in 21H2 and a +6.1% rate in 2022, before decelerating to +4% in 2023 and 2024.

Exhibit 9: We Expect a Solid Capex Recovery through 2022, Driven by Continued Strength in IT Spending

9. We Expect a Solid Capex Recovery through 2022, Driven by Continued Strength in IT Spending. Data available on request.
Source: Bureau of Economic Analysis, Goldman Sachs Global Investment Research

Joseph Briggs

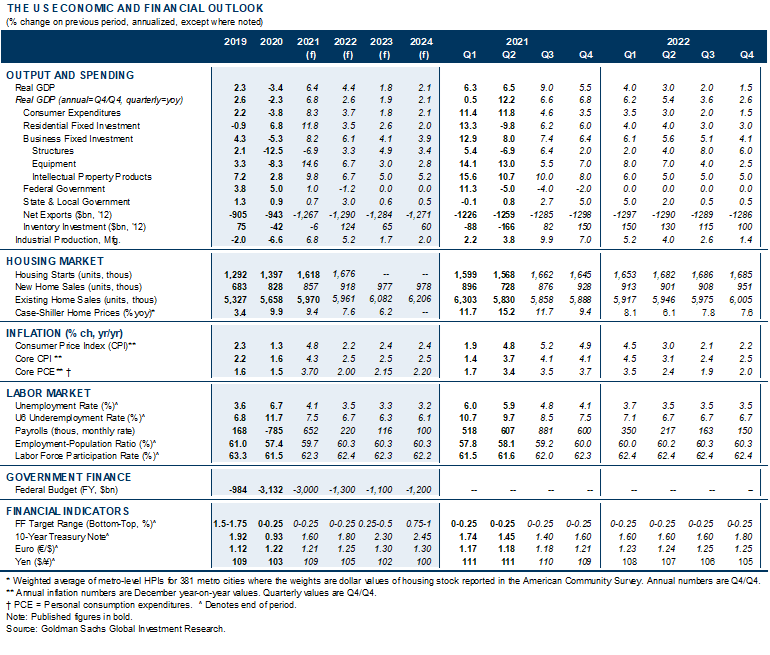
The US Economic and Financial Outlook
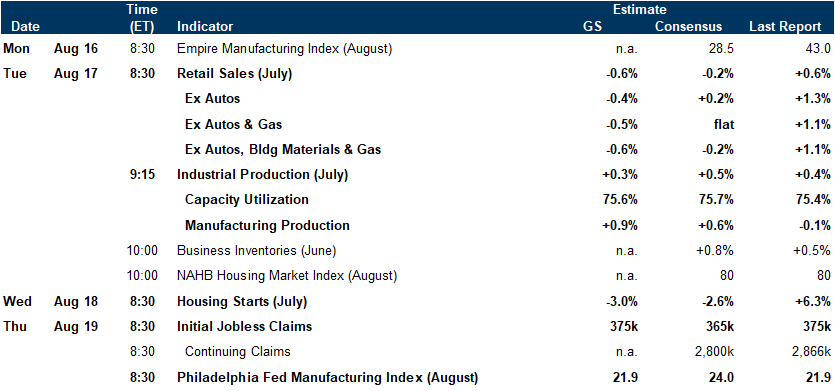
Data available on request.
Source: Goldman Sachs Global Investment Research

Economic Releases

Data available on request.
Source: Goldman Sachs Global Investment Research
  1. 1 ^ Atanassov, Julian, and Xiaoding Liu. "Can corporate income tax cuts stimulate innovation?" Journal of Financial and Quantitative Analysis 55.5 (2020): 1415-1465.

Investors should consider this report as only a single factor in making their investment decision. For Reg AC certification and other important disclosures, see the Disclosure Appendix, or go to www.gs.com/research/hedge.html.