Goldman Sachs Research
Asia Economics Analyst
The past and the future of China’s role in global inflation
27 August 2021 | 6:23PM HKT | Research | Economics| By Hui Shan and others
More
  • Globalization, and the rise of China’s manufacturing power after its entry into the World Trade Organization in particular, has been cited as one of the drivers behind the low and stable global inflation over the past two decades. With the Chinese government committed to de-carbonization and multinationals rethinking global supply chains after US-China tensions and the COVID pandemic, will China turn from a disinflationary force in the past into an inflationary driver in the future? We examine China’s role in global inflation in this note.

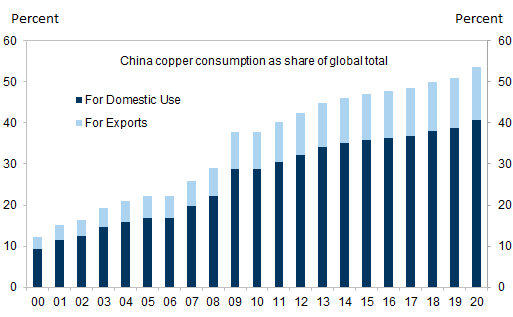
  • While discussions on the link between China and global inflation tend to focus on China supply, China demand plays an equally, if not more, important role. China accounted for almost all of the global metals demand increases over the past 20 years, and three quarters of that were for domestic consumption. The rapid expansion in infrastructure, property, and auto seen since 2000 is unlikely to be repeated. A gradual slowdown in demand growth, such as we expect, should be disinflationary rather than inflationary.

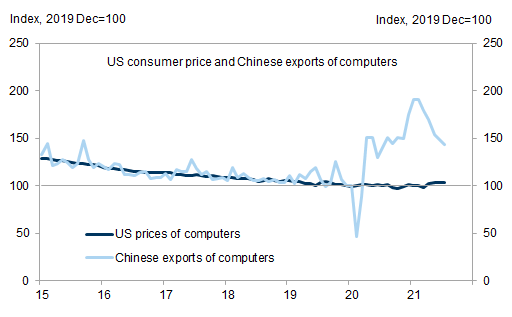
  • For upstream industries such as coal and steel, past capacity cuts to address overcapacity problems and production controls to improve air quality have led to low inventory and inelastic supply. Future de-carbonization moves are likely to keep these markets tight, resulting in high and volatile prices. But the downstream industries are entirely different. The experience of the COVID pandemic shows how flexible Chinese manufacturers can be, almost doubling exports of computers in a year on work-from-home demand surge for instance.

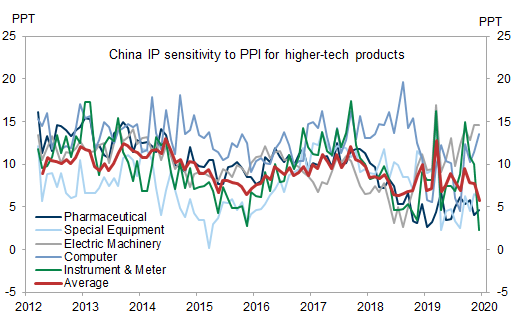
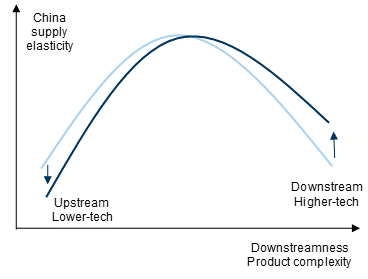
  • Within downstream industries, we observe a notable divergence between lower-tech sectors and higher-tech sectors. Supply elasticity in lower-tech sectors such as textiles and garment consistently trended lower during the 2010s while it stayed relatively stable in higher-tech sectors such as special equipment and electric machinery. Given the government’s emphasis on manufacturing upgrading in the 14th Five-Year Plan, supply elasticity in sectors such as semiconductors and new energy vehicles may increase in coming years with capacity expansion.

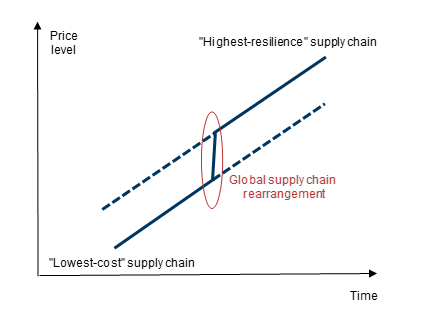
  • The combination of US-China tensions and the COVID-19 pandemic has led manufacturers to rethink input sourcing and supply chain resilience. A shift from a “lowest-cost” global supply chain to a “highest-resilience” one is undoubtedly inflationary in the near-term. However, the implication for inflation in the long run is ambiguous. In fact, if supply chains are indeed more resilient and less prone to disruptions, long-term inflation may even be lower on average as prices are less likely to spike on demand shocks.

The past and the future of China’s role in global inflation

Since the 1990s, inflation in major developed economies has stayed low and stable across the globe compared to the previous decades (Exhibit 1). Many drivers are behind the significant change, including monetary policies successfully anchoring inflation expectations, technological advancements, and better inventory management. One other driver often being cited is globalization, in particular China’s entry into the World Trade Organization (WTO) and the sharp rise in its manufacturing capacity.[1] In 2001, China accounted for less than 2% of global trade. By 2019, 13% of global exports and 28% of global manufacturing value-added had originated from China. As labor costs increase and environmental restrictions are tightened, China’s ability to produce cheap manufactured goods comes into question. On the back of US-China trade tensions and global supply chains rearrangement, the argument goes, China may be turning from a global disinflationary factor to a global inflationary driver.
We look into China’s role in global inflation in this note. Through its demand, supply and industrial policies, the Chinese economy impacts both the level and the volatility of global inflation. The combined effect of China demand and China supply on the level of global inflation is more ambiguous than first meets the eyes. Strong economic growth and rapid urbanization lifted commodity prices (inflationary) on the one hand, while industrial overcapacity depressed PPI and exports prices (disinflationary) on the other. In addition, the likely path of China’s future economic development and policy directions points to less elastic supply in the upstream industries compared to the downstream industries. Within downstream, higher-tech sectors may potentially see more elastic supply relative to lower-tech sectors down the road. This transformation could lead to higher prices and more volatile inflation in upstream industries but lower prices and less volatile inflation in the higher-tech sectors. Lastly, global supply chain rearrangement would be undoubtedly inflationary in the near-term but could result in lower average inflation in the long run if the goal of maximizing production resilience is achieved.

Exhibit 1: Lower and more stable global inflation after the 1990s

1. Lower and more stable global inflation after the 1990s. Data available on request.
Source: Haver Analytics

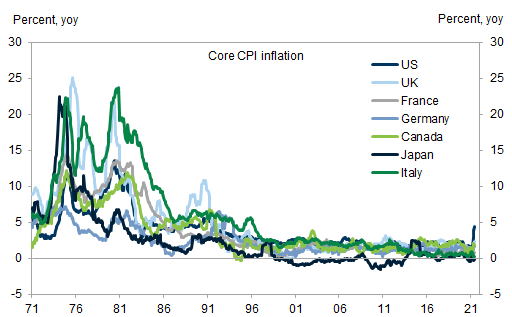
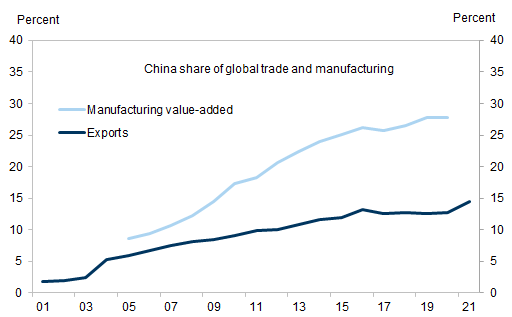
Exhibit 2: China’s share of global exports and manufacturing rose sharply over the past 20 years

2. China’s share of global exports and manufacturing rose sharply over the past 20 years. Data available on request.
Source: Haver Analytics, Goldman Sachs Global Investment Research

The importance of China demand to global inflation

While China’s manufacturing output has garnered most attention in discussions around the role of China in global inflation, Chinese demand plays an equally, if not more, important role relative to Chinese supply in global goods markets. Exhibit 3 shows that China’s new auto sales were only 11% of the US’ back in 2000. In recent years, however, they are 60% above new auto sales in the US. Exhibit 4 shows an even more striking picture in the housing market. The rapid pace of urbanization seen in China over the past two decades has been accompanied by strong growth in property construction and sales. Over the past few years, approximately 16 million newly built apartments are sold in China each year, compared to about 1 million per year in the US.
Because infrastructure, housing and automobiles built in China stay in China, the impact of expansions in these sectors on global goods markets can be attributed to China demand rather than China supply.[2] Metals consumption provides a good example. Exhibit 5 shows that over 60% of steel consumption and over 50% of copper and aluminum consumption in China are in the infrastructure, housing and automobile sectors. In the case of copper, China’s share of global demand jumped from 12% in 2000 to 51% in 2019. Even under a generous assumption that half of all copper uses outside of infrastructure, housing and automobiles are eventually exported in the form of manufactured products, domestic demand still accounts for three quarters of total copper consumption (Exhibit 6).[3]
The copper example echoes more rigorous findings in the academic literature. Previous research using a structural dynamic factor model shows that Chinese demand shocks mattered slightly more than supply shocks to prices in other countries in the sample period of 2002-2011. Going forward, the robust growth in infrastructure, housing and automobile sectors over the past two decades are unlikely to be repeated in China. Real GDP growth is expected to average 4.7% under the policy goal of doubling income by 2035, significantly lower than the average of 8.9% during 2005-2019. These suggest a meaningful disinflationary effect of China demand on global inflation in the coming years.

Exhibit 3: Auto sales in China exceeded those in the US after 2009

3. Auto sales in China exceeded those in the US after 2009. Data available on request.
Source: CEIC, Haver Analytics

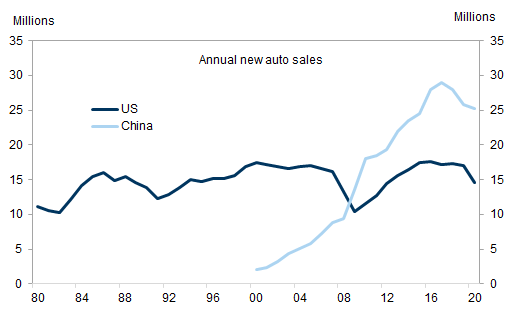
Exhibit 4: New property sales in China are about 15 times those in the US

4. New property sales in China are about 15 times those in the US. Data available on request.
Source: Haver Analytics, Goldman Sachs Global Investment Research

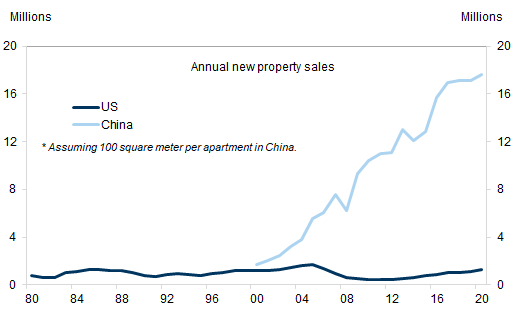
Exhibit 5: Over half of China’s total steel, copper and aluminum consumption is in infrastructure, housing and automobile sectors

5. Over half of China’s total steel, copper and aluminum consumption is in infrastructure, housing and automobile sectors. Data available on request.
Source: Goldman Sachs Global Investment Research

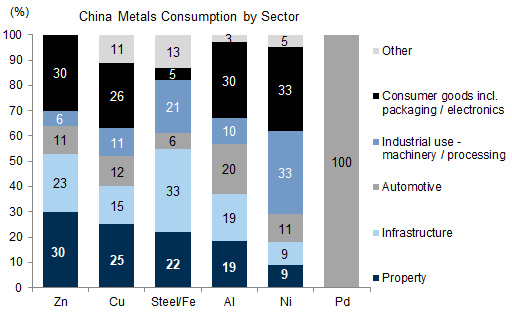
Exhibit 6: Three quarters of the growth in China’s copper demand over the past 20 years is for domestic use

6. Three quarters of the growth in China’s copper demand over the past 20 years is for domestic use. Data available on request.
Source: WoodMac, Goldman Sachs Global Investment Research

Upstream and downstream moving in different directions

China’s upstream sectors such as coal and steel have fundamentally changed. Back in 2013 and 2014, these industries were plagued with overcapacity problems and non-performing loans, threatening both the economy and financial stability. The 2015-2016 capacity cuts, more disciplined production controls in 2017-2019, and further supply restrictions after the government’s pledge last year to achieve carbon neutrality by 2060 all have contributed to an extremely tight market today. Exhibit 7 shows that, with inventory low and production controlled, idiosyncratic factors such as a hotter-than-usual summer or lower-than-usual hydro power generation can send coal prices significantly higher, raising both the level and volatility of inflation. Exhibit 8 shows that, a decade ago, a $100/ton price difference between China and ex-China could increase Chinese monthly steel exports by 3.4mn tons. Nowadays it takes a $1700/ton price incentive for Chinese steel exports to do so, implying a much lower supply elasticity.
The Chinese government appears to be committed to de-carbonization and prices in the upstream sectors, especially those with significant carbon emissions footprint, are likely to stay high and volatile. However, the picture in the downstream sectors looks entirely different. The experience of the COVID pandemic serves as a good example. The virus outbreak deteriorated quickly in other countries in 2020Q2, resulting in a sharp rotation in the types of goods demanded – more personal protection and work-from-home products and less travel-related products for instance. Chinese exporters were quick to adjust production and meet such drastic demand changes (Exhibit 9). In the case of computers, Chinese exports almost doubled from January 2020 to January 2021 to meet the surging work-from-home and online school demand. Consequently, we have seen limited computer price increases overseas. This demonstrates a high supply elasticity across varieties of Chinese downstream manufacturing industries.

Exhibit 7: Coal prices are higher and more volatile now than before

7. Coal prices are higher and more volatile now than before. Data available on request.
Source: Wind

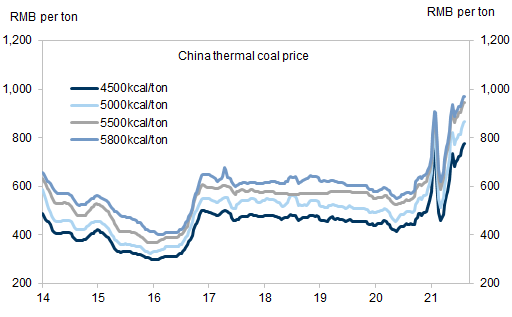
Exhibit 8: China’s steel supply elasticity declined sharply after 2016

8. China’s steel supply elasticity declined sharply after 2016. Data available on request.
Source: Bloomberg, Haver Analytics, Goldman Sachs Global Investment Research

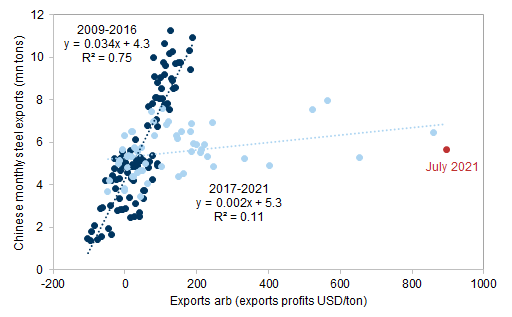
Exhibit 9: The mix of external goods demand changed dramatically after the COVID shock

9. The mix of external goods demand changed dramatically after the COVID shock. Data available on request.
Source: Haver Analytics, Goldman Sachs Global Investment Research

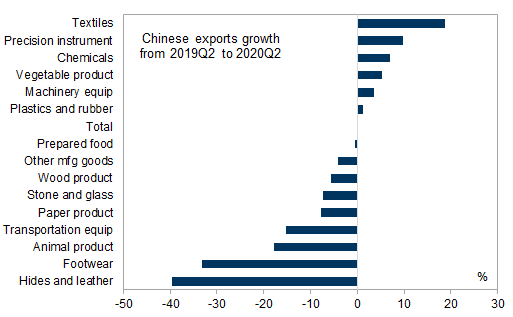
Exhibit 10: Chinese exports of computers almost doubled in a year

10. Chinese exports of computers almost doubled in a year. Data available on request.
Source: Goldman Sachs Global Investment Research

The divergence between higher-tech and lower-tech sectors

Even within the downstream industries, China’s supply dynamics have been evolving differently along the “lower-tech vs. higher-tech” dimension. Precisely estimating producers’ supply elasticity is difficult because of the endogeneity problem (i.e., prices affect supply but supply also affects prices) and valid instrumental variables that only affect prices but not supply are hard to come by. As a crude proxy, we use the difference between IP growth and lagged PPI growth to gauge supply elasticity.[4] For instance, if 5% yoy growth in PPI three months ago is followed by 15% yoy growth in IP, the difference would be 10%. The higher this difference, the more elastic the supply might be. Note that this measure is not equivalent to supply elasticity as the difference between IP growth and PPI growth can be negative whereas supply elasticity cannot.
Among the lower-tech sectors such as textile, garment, and furniture, China’s supply elasticity appears to be trending lower over the past decade (Exhibit 11). A 10% increase in prices would have induced a 20% jump in production in the early 2010s (i.e., 10pp difference between IP and PPI growth in the chart), but only generates a 10% increase nowadays (i.e., zero difference between IP and PPI growth in the chart). By contrast, among the higher-tech sectors such as special equipment, electric machinery, and instruments and meters, China’s supply elasticity has remained relatively stable over the past 10 years (Exhibit 12). Note that due to data limitations, the industries used here are defined relatively broadly and we are not able to fine-tune the analysis using more detailed sub-industry data. To the extent there is divergence within each industry, we think China’s supply elasticity may be rising in some higher-tech sub-sectors with capacity expansion, in particular among those supported by government policies such as semiconductors and new energy vehicles.

Exhibit 11: China’s supply elasticity appears to be falling in lower-tech sectors

11. China’s supply elasticity appears to be falling in lower-tech sectors. Data available on request.
Source: CEIC, Goldman Sachs Global Investment Research

Exhibit 12: China’s supply elasticity appears to be stable in higher-tech sectors

12. China’s supply elasticity appears to be stable in higher-tech sectors. Data available on request.
Source: CEIC, Goldman Sachs Global Investment Research

Differentiating short-term vs. long-term effects

The US tariffs placed on Chinese goods in 2018-2019 and the various supply chain disruptions caused by the COVID pandemic in 2020-2021 have led manufacturers to rethink input sourcing and production locations. On global supply chain rearrangement, we highlight two implications for prices and inflation. First, regarding production relocation that is motivated by costs – whether US tariffs or rising labor costs in China – we think the impact on global inflation is likely small. Even before the US-China trade war, for example, production of labor-intensive goods such as apparel and smartphone assembly had already been moved from China to countries like Bangladesh and Vietnam. Exhibit 13 shows that Chinese exports of footwear fell over the past 5 years but US footwear prices declined as well, suggesting cost-driven production relocation does not necessarily lead to higher prices and inflation.
Regarding the global supply chain rearrangement driven by a shift from the “lowest-cost” model to the “highest-resilience” model, the implication for inflation is different in the short-term vs. in the long-term. Exhibit 14 illustrates this point with a diagram.[5] In the near-term, a move from low-cost regions to high-cost regions is clearly inflationary (there is a discrete jump in costs/prices moving from the lower-cost supply curve to the higher-cost/more resilient supply curve). But once the rearrangement is finished, which may take a few years, it is unclear whether inflation will remain permanently higher as this depends on the steady state inflation rate in low-cost regions vs. high-cost regions. In other words, moving production from China to the US may lead to a one-time increase in production costs because wages are higher in the US than in China. However, if wages grow at a slower pace in the US than in China, then production costs may also grow more slowly after the production relocation. In addition, since the new supply chain is optimized for highest resilience, production should be less likely to experience disruptions and prices should be less likely to spike on demand shocks after the production relocation, also contributing to lower average inflation in the long run.

Exhibit 13: Chinese exports of footwear fell and US footwear prices declined in recent years

13. Chinese exports of footwear fell and US footwear prices declined in recent years. Data available on request.
Source: Haver Analytics

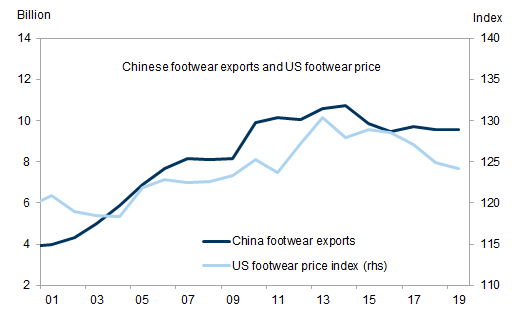
Exhibit 14: Global supply chain rearrangement is inflationary in the short-term but not necessarily in the long-term

14. Global supply chain rearrangement is inflationary in the short-term but not necessarily in the long-term. Data available on request.
Source: Goldman Sachs Global Investment Research

Putting it together

When discussing China’s role in global inflation, it is crucial to take a comprehensive rather than a partial view of this complex question. At the aggregated level, both China demand and China supply matter to the level of global inflation. To be more precise about this point, we estimate a simple structural vector autoregressive (SVAR) model using quarterly data from 2009Q1 to 2019Q4. We use China Current Activity Indicator (CAI) to measure China growth and GDP growth for 23 other countries which collectively account for 55% of global GDP. We apply sign restrictions to separate demand shocks from supply shocks. We find China demand shocks to be significantly more important to CPI and PPI inflation in most of ex-China economies than same-size China supply shocks (Exhibit 15). Looking ahead, the gradual growth deceleration that we expect for China may generate enough disinflationary forces to counterbalance the upward pressure on global inflation from China’s de-carbonization and deleverage efforts.
In our previous analysis on supply chain shifts, we show that Chinese imports are more concentrated at the two ends of the product complexity spectrum, suggesting relatively low domestic supply elasticity among both upstream commodities and most sophisticated tech products. Exhibit 16 shows a stylized illustration of a hump-shaped China supply elasticity across different products. Our analysis above suggests that China’s supply elasticity in some upstream and lower-tech sectors may be falling. But China’s supply elasticity in downstream sectors, and higher-tech industries in particular, is likely to remain high or even increase. This mirrors the government’s push for stabilizing manufacturing share of GDP, manufacturing upgrading, and increased R&D to acquire technologies that are currently bottlenecks to China’s advanced manufacturing. In the fields that policymakers are targeting – semiconductors and new energy vehicles for example – China may drive its supply elasticity higher via capacity expansion in the future. If China's industrial restructuring is successful, its implications are tailwinds to ex-China producers in upstream and lower-tech sectors and headwinds to ex-China producers in downstream and higher-tech sectors.

Exhibit 15: Historically China demand was more important to global inflation than China supply

15. Historically China demand was more important to global inflation than China supply. Data available on request.
Source: Goldman Sachs Global Investment Research

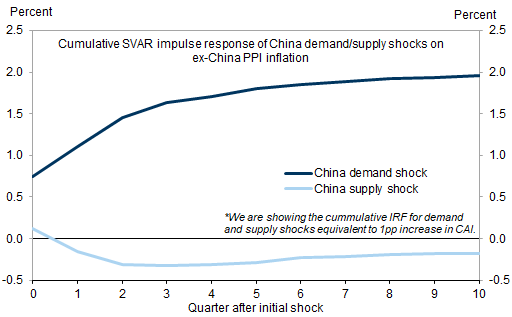
Exhibit 16: China’s future impact on global goods inflation may vary across products

16. China’s future impact on global goods inflation may vary across products. Data available on request.
Source: Goldman Sachs Global Investment Research
  1. 1 ^ See Kristin Forbes 2019, “Inflation Dynamics: Dead, Dormant, or Determined Abroad?” NBER Working Paper 26496 for example.
  2. 2 ^ Most of the automobiles produced in China are for domestic consumption rather than exports. In 2019, for example, China produced 25 million cars and exported 1 million, according to official statistics.
  3. 3 ^ 50% is a generous assumption because NBS data show that “value of industrial export delivery” to “gross output value of industry” ratio peaked at 20% in 2004. Industry contacts suggest about one-third of home appliances produced in China are for exports.
  4. 4 ^ Note that using lagged price changes alleviates, but not completely removes, the endogeneity problem which biases supply elasticity estimates downward. In addition, because PPI growth could be zero, we cannot use the ratio of IP growth to PPI growth.
  5. 5 ^ This diagram draws from Professor Markus Brunnermeier at Princeton University in his discussions of global supply chains and inflation.

Investors should consider this report as only a single factor in making their investment decision. For Reg AC certification and other important disclosures, see the Disclosure Appendix, or go to www.gs.com/research/hedge.html.