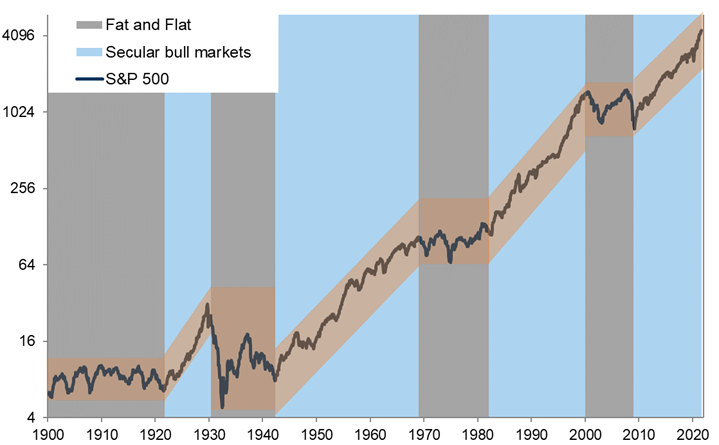
Not all bull markets are the same. There have been three powerful secular super cycles in equities since World War II: 1945-1968, 1982-2000 and 2009-2020. Each was driven by a combination of one or more of the following: very strong growth, falling interest rates, low starting valuations together with rising profit margins.
The post-pandemic cycle starts from a position of record low interest rates, high valuation and high margins, implying lower longer-term returns with a 'fat & flat' profile.
Aggregate returns are likely to be lower than the last cycle but relative returns compared with bonds should be higher with less deflationary risks reducing equity risk premia.
In the absence of falling interest rates, rising margins and higher valuations, we expect equity markets to become less bifurcated by factor (e.g., Growth versus Value), by sector (Technology versus Banks) and by region (US versus non-US) than in the last cycle. Instead, we expect greater opportunities for Alpha generation as the broadening of the digital revolution across industries, coupled with the increased focus and spending on decarbonisation, drives wider differences between relative winners and losers across the market and within sectors.
The opportunity set for Alpha generation should improve across and within industries driven by a combination of 1) new areas of technological innovation, 2) companies disrupting non-tech industries, 3) companies enjoying new demand growth from green capex and 4) companies in disrupted industries that adapt to change, opening up new growth streams that generate re-rating.
This is the first part of a 3-part series looking at the Post-Pandemic Cycle.
Secular & Cyclical market drivers
Exhibit 1: Secular & non-trending bull markets
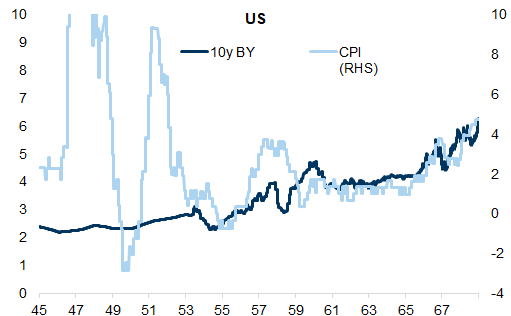
1) 1945-1968 — Post-war boom
Exhibit 2: Post-war boom
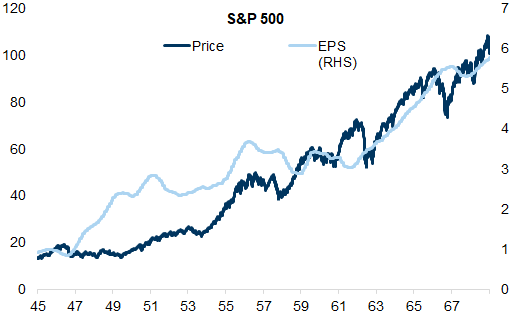
Exhibit 3: Post-war boom
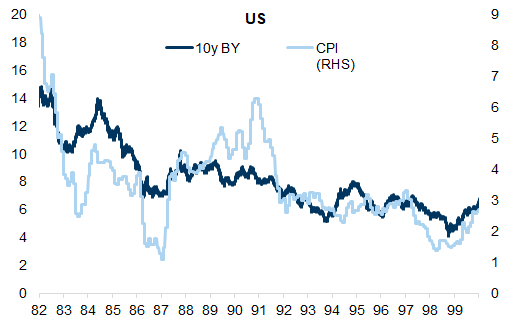
2) 1982-2000 — Disinflation and moderation
Exhibit 4: Disinflation and moderation
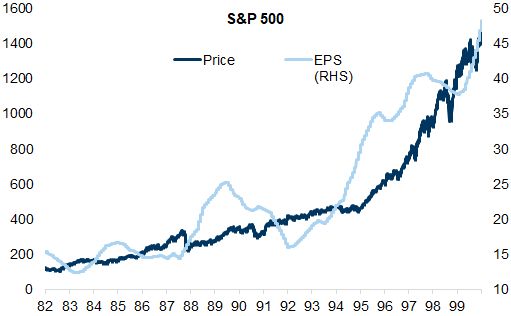
Exhibit 5: Disinflation and moderation
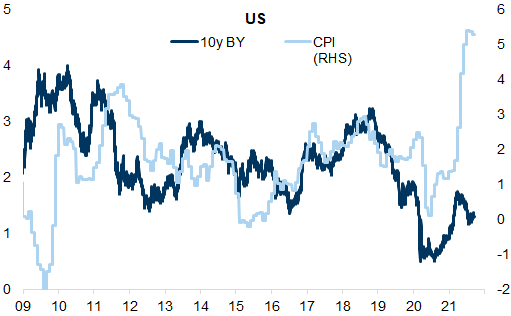
3) 2009 onwards — The start of QE and the post-financial-crisis recovery
Exhibit 6: US financial conditions are remarkably easy
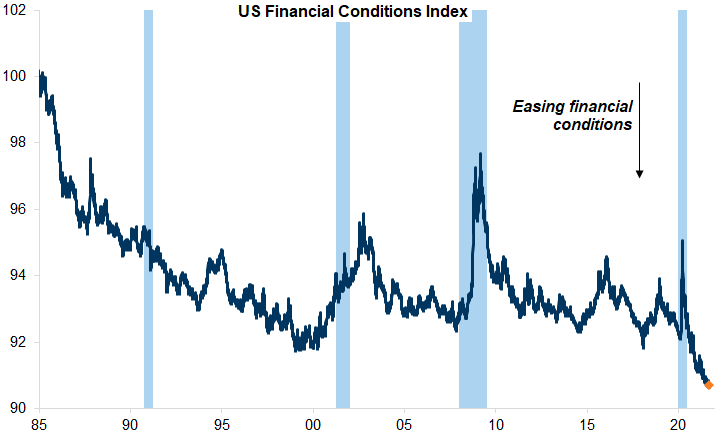
Exhibit 7: The start of QE and the post financial crisis recovery
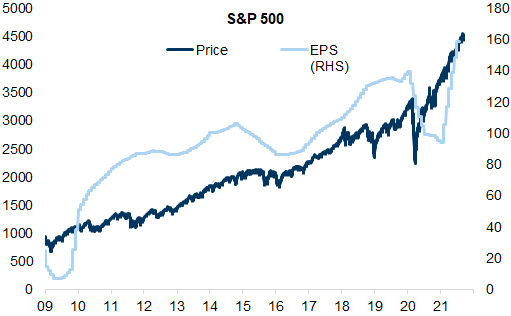
Exhibit 8: The start of QE and the post financial crisis recovery
Flatter bull markets
‘Fat & Flat' markets: low but positive aggregate returns over a period of time but punctuated with large cyclical swings. These are not uncommon and have often characterised the periods between the secular bull markets.
'Skinny & Flat' markets: a period of positive but low returns within a narrow trading range. We find several good examples of relatively flat (low return) and relatively skinny (no bear markets, no bull market with >25% return over less than 2 years) periods. Since 1970, Europe has had a 'Skinny & Flat' market for roughly 30% of the time, compared with c. 20% for the US market since 1945 – see: Global Strategy Paper: Making Cents; The Cycle & the Return of Low Returns, September 4, 2018.
Valuations are high.
Interest rates are very low.
Margins are high.
1. Valuations are high
Exhibit 9: Correlation between cyclically adjusted P/E and forward returns (over 10 years)
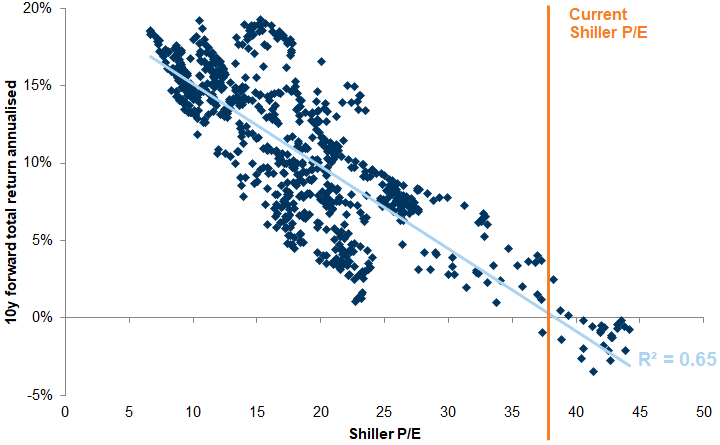
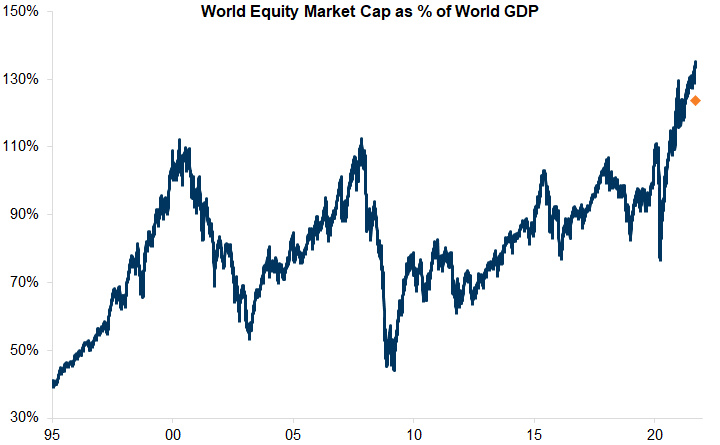
Exhibit 10: Global equities have reached a record high valuation vis-à-vis global GDP
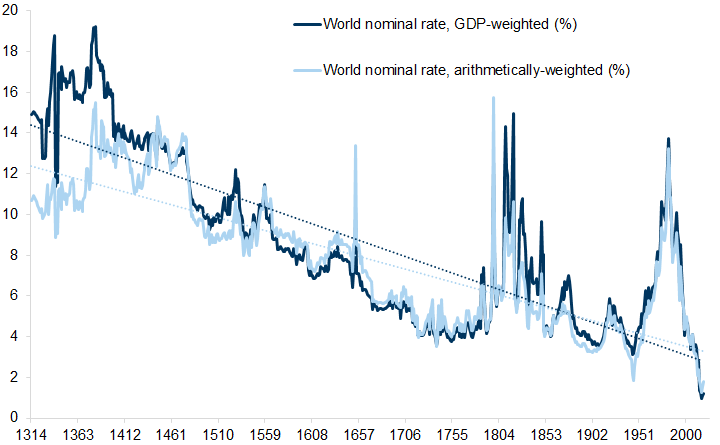
2. Interest rates are very low
Exhibit 11: Nominal interest rates are at record low levels
3. Margins are high
Exhibit 12: Margins are high
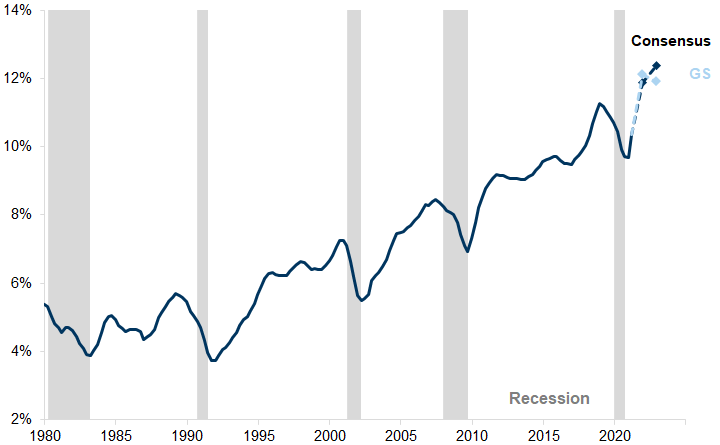
Exhibit 13: US ROE has moved back towards record highs
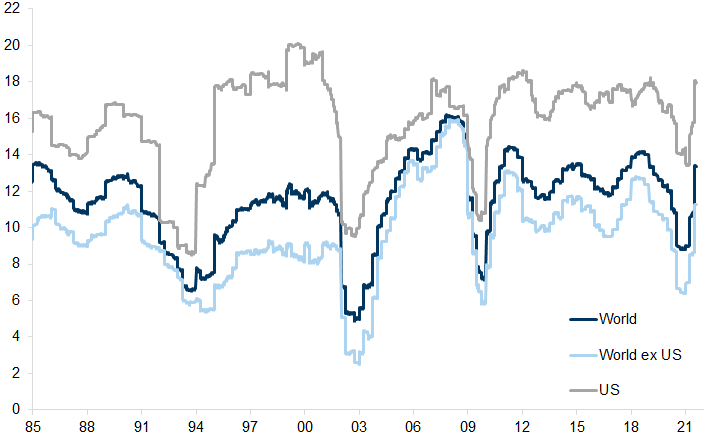
Exhibit 14: The share of output going to employed workers may have bottomed in the past cycle
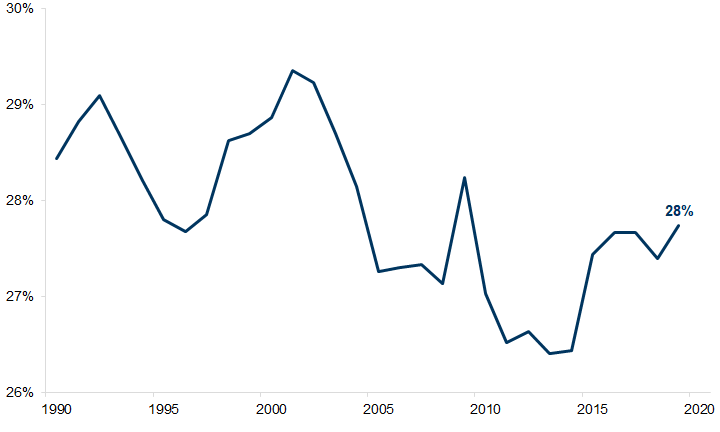
Exhibit 15: The major equity indices have seen a decline in the effective tax rate
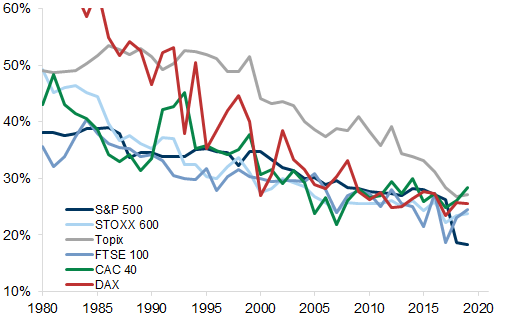
Exhibit 16: China’s share of global exports and manufacturing has risen sharply over the past 20 years
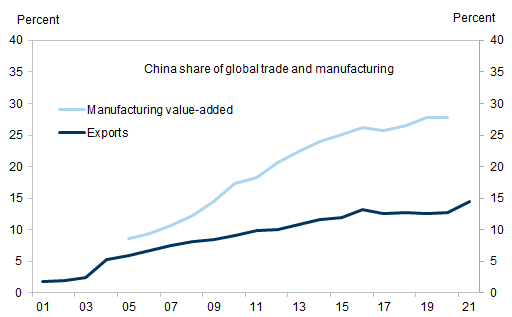
Exhibit 17: The majority of industries faced an increase in concentration
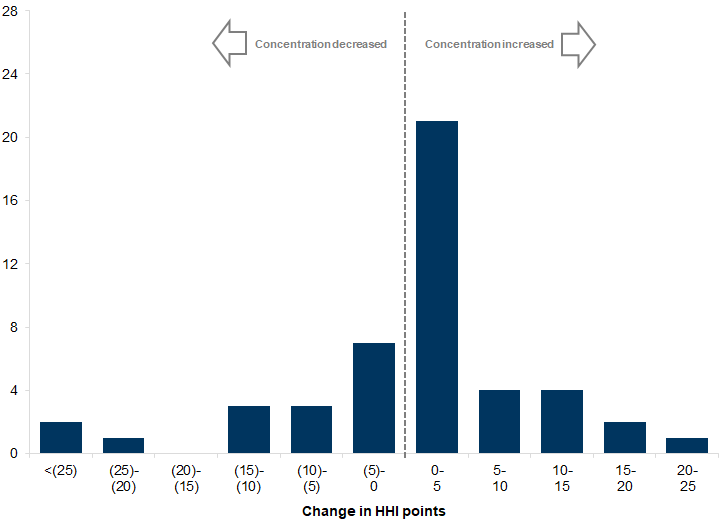
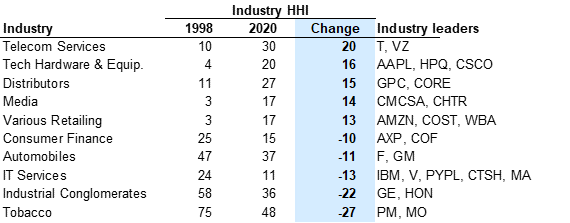
Exhibit 18: Largest/smallest changes in industry concentration
Why the post-Covid cycle will be different
Aggregate index returns should be lower.
Relative returns should be higher (compared with bonds).
Equity markets are likely to be less driven by macro factors. Sector and country returns should be less bifurcated; Alpha should become more important.
1. Lower aggregate returns
2. Higher relative returns
Exhibit 19: European equity valuations have risen, bond valuations remain high
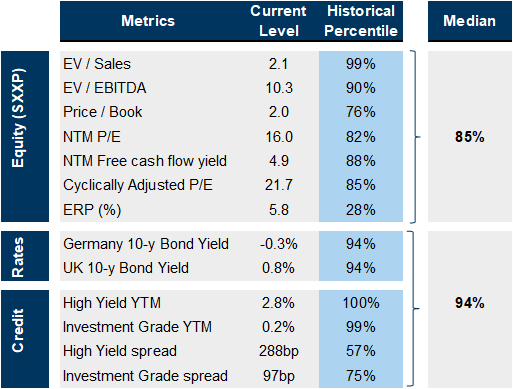
Exhibit 20: Valuations across asset markets are high in the US relative to history

Exhibit 21: ERPs remain elevated across the board by historical standards
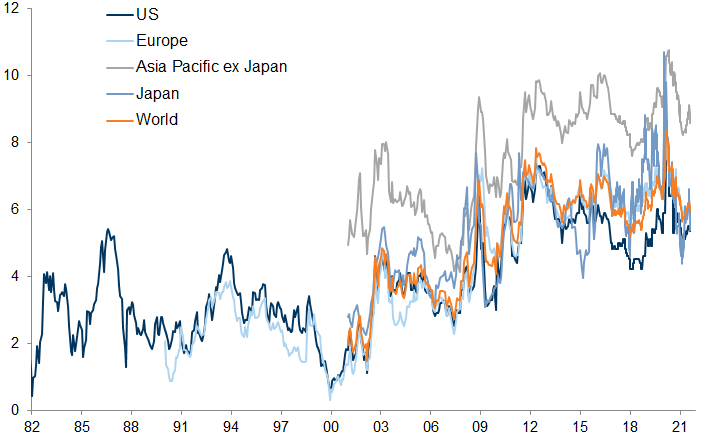
Exhibit 22: The US dividend yield and 10-year bond yield are very similar
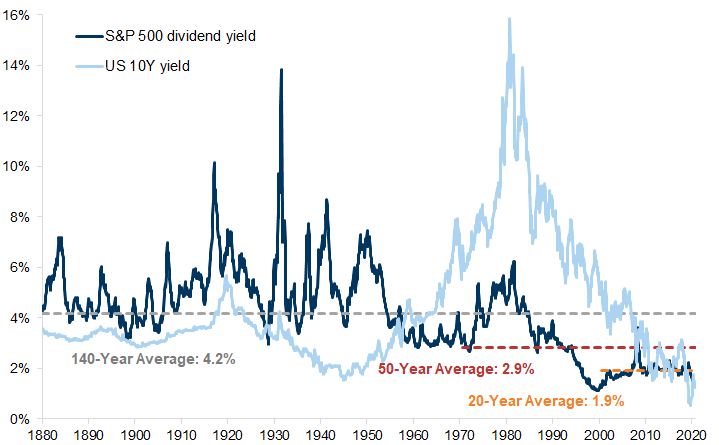
Exhibit 23: Since the late 1990s lower bond yields have not supported equity valuations
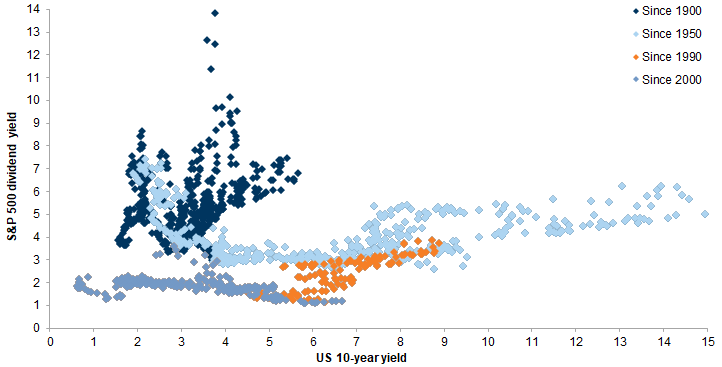
Exhibit 24: Correlation between US 10Y Treasury and S&P 500 monthly returns
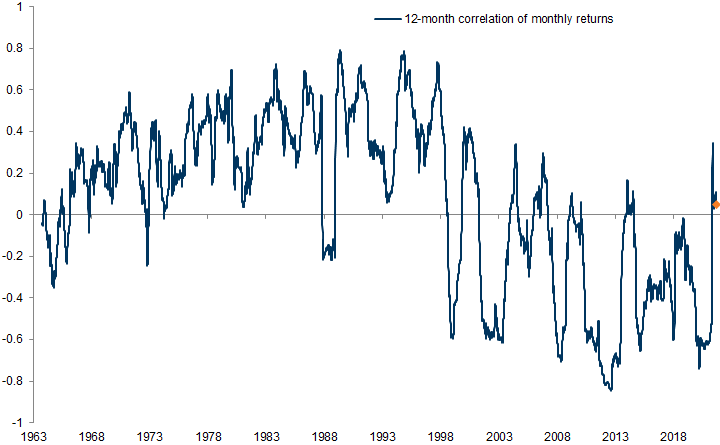
Exhibit 25: After a multi-year de-rating of equities vs. bonds, implied long-term growth remains very low (especially outside the US)
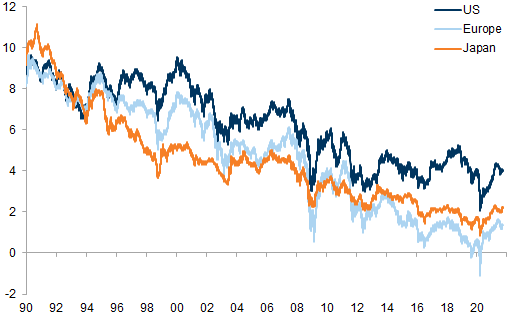
Exhibit 26: Top-line growth has been falling along with declining nominal GDP
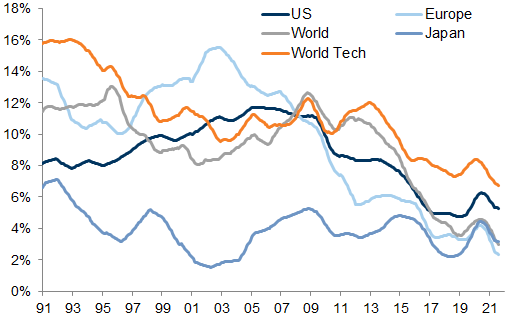
Exhibit 27: Savings rates have spiked across the biggest economies
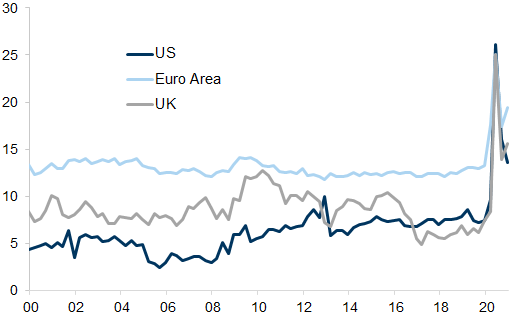
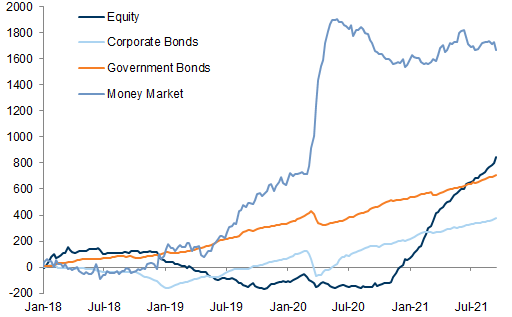
Exhibit 28: Flows into equities have been strong YTD
3. Less factor difference and more Alpha
Exhibit 29: Growth has outperformed since the GFC
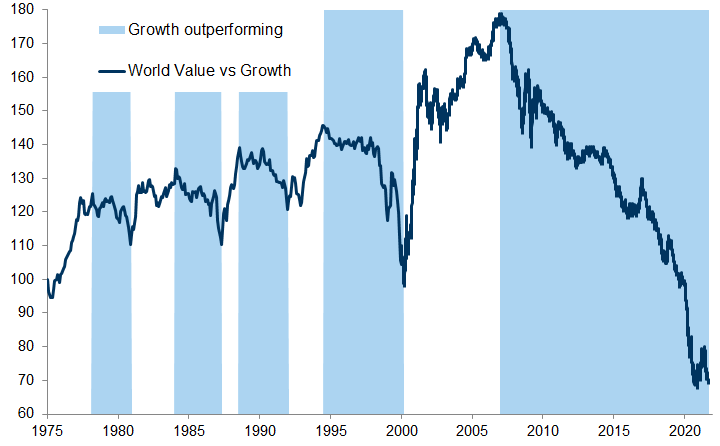
Exhibit 30: Tech earnings have outstripped those of the global market
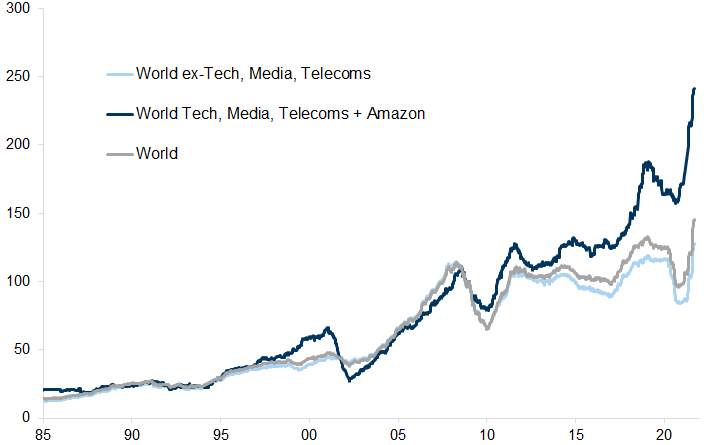
Exhibit 31: While dividend yields for global Value stocks have been unchanged since the GFC, they have declined for Growth stocks
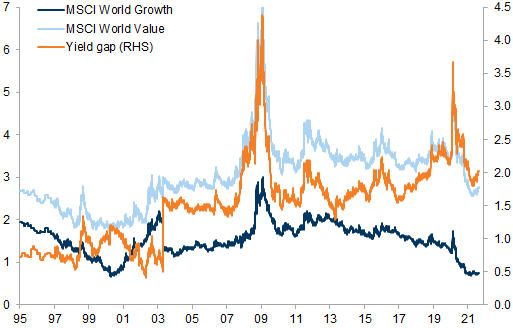
Exhibit 32: Implied LT growth for global Value stocks has fallen sharply
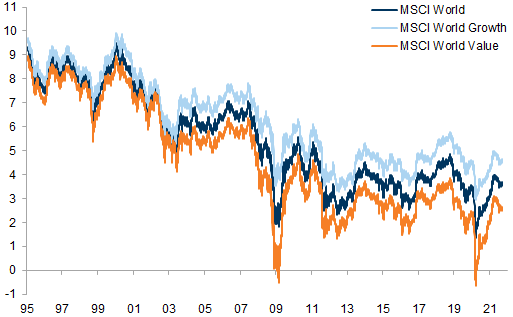
Exhibit 33: US equities have outperformed the rest of the world
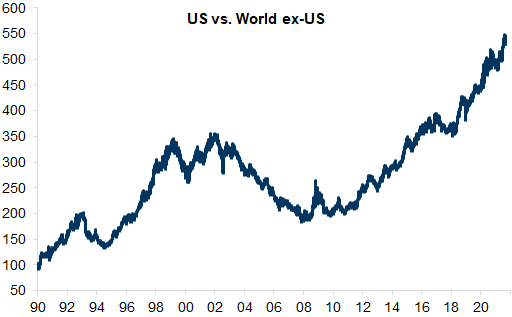
Exhibit 34: Growth has outperformed Value since the GFC
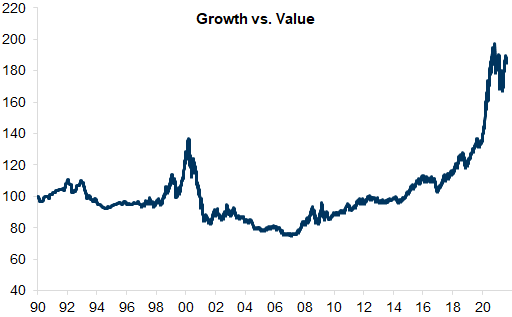
Exhibit 35: Europe vs. US equities performed in line with Bund yield evolution
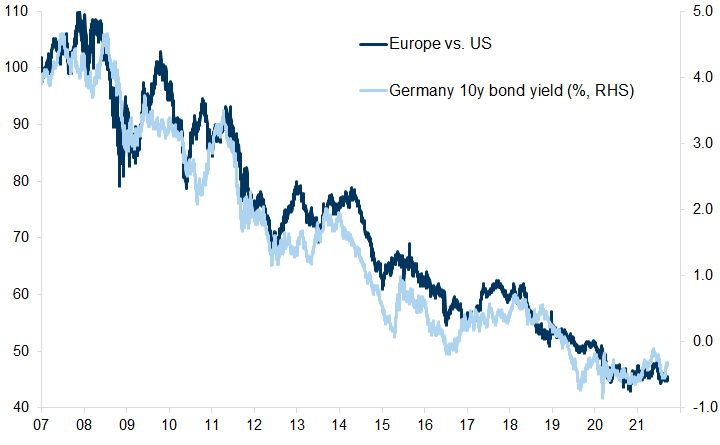
Exhibit 36: The pace of EPS growth in Europe and the US should be more similar this cycle
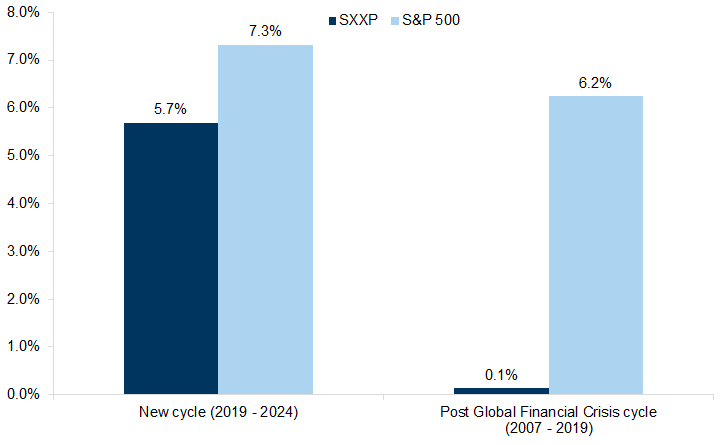
Exhibit 37: Issuance has picked up and is carried out by a different pool of economic actors this time around
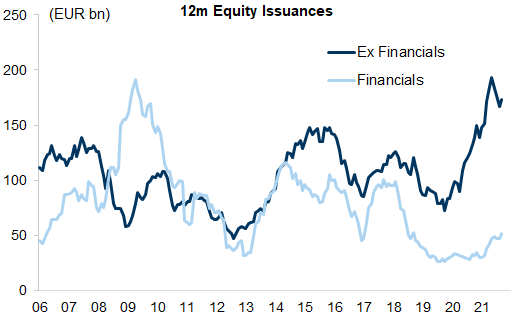
Exhibit 38: The rise in issuance has been concentrated in IPOs and secondary offerings rather than rights issues
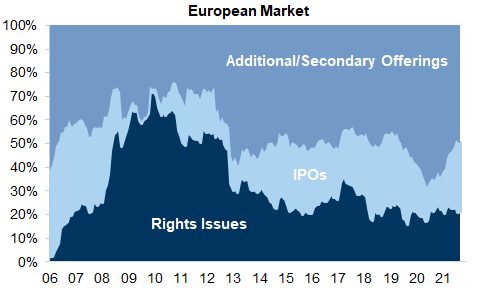
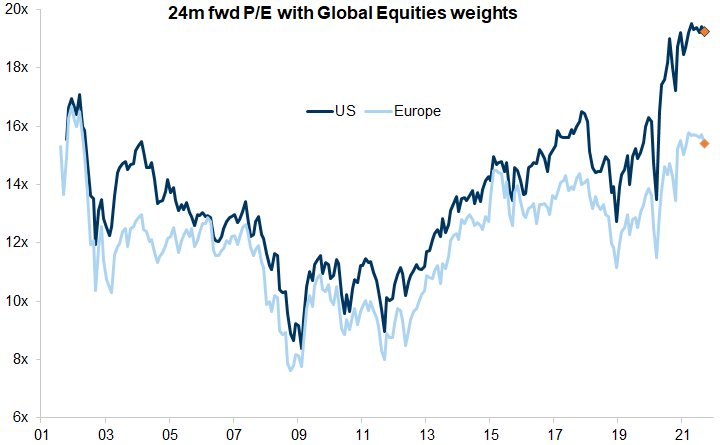
Exhibit 39: European valuations remain well below the US - even on an equivalent sector basis
- 1 ^ Post-war reconstruction and development in the Golden Age of Capitalism. (2017). World Economic and Social Survey 2017.
- 2 ^ Norwood, B. (1969). The Kennedy round: A Try at Linear Trade Negotiations. Journal of Law and Economics, 12(2), pp. 297-319.
- 3 ^ The end of the Bretton Woods System. IMF, [online]. Available at: https://www.imf.org/external/about/histend.htm.
- 4 ^ Modigliani, F. and Cohn, R. A. (1979). Inflation, Rational Valuation and the Market. Financial Analysts Journal, 35(2), pp. 24-44.
- 5 ^ Ritter, J. and Warr, R. S. (2002). The Decline of Inflation and the Bull Market of 1982–1999. Journal of Financial and Quantitative Analysis, 37(01), pp. 29-61.
- 6 ^ Privatisation in Europe, Coming Home to Roost. (2002). The Economist.
- 7 ^ Bernanke, B. (2010). Causes of the Recent Financial and Economic Crisis. Testimony Before the Financial Crisis Inquiry Commission, Washington, D.C.
- 8 ^ Disney, R., Gosling, A. and Machin, S. (1993), "British Trade Unions in Decline: What Has Happened to Trade Union Recognition in British Establishments", Management Research News, Vol. 16 No. 5/6, pp. 27-27. https://doi.org/10.1108/eb028293
- 9 ^ Garbade, K. (2020). Managing the Treasury Yield Curve in the 1940s. Federal Reserve Bank of New York Staff Reports, no. 913.
Investors should consider this report as only a single factor in making their investment decision. For Reg AC certification and other important disclosures, see the Disclosure Appendix, or go to www.gs.com/research/hedge.html.