Goldman Sachs Research
Asia Economics Analyst
Credit supply holds the key to China housing outlook in 2022
11 October 2021 | 1:43PM HKT | Research | Economics| By Hui Shan and others
More
  • The recent news on highly-levered Chinese property developers running into liquidity problems, and the latest data showing sharply falling land transactions and property sales on the back of regulatory tightening, exacerbate investors’ long-held concerns over China housing. In this note, we examine both the fundamental demand and credit supply aspects of the Chinese housing market.

  • On housing demand, we estimate demographic, replacement and investment demand separately. Demographic demand in turn is decomposed into total population, urbanization rate, and average household size. By our estimates, annual demographic demand may decline from 8mn units in the 2010s to only 1.5mn by 2050 on falling population and fading support from urbanization, partly offset by slightly smaller average family size.

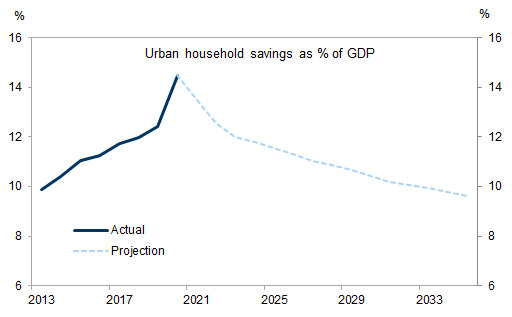
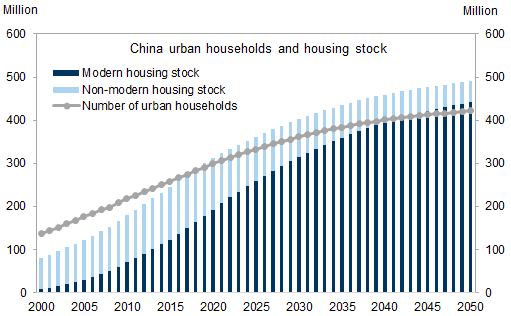
  • Given China’s still large stock of non-modern housing in urban areas, replacement demand is likely to remain significant for years to come. We expect annual demolitions to drop only gradually from 4.5mn units now to about 3.5mn by 2050. Investment demand is poised to shrink in the coming years as household expectations adjust to the new policy regime of “housing is for living in, not for speculation”. However, investment demand is unlikely to disappear entirely because of the high household saving rate and limited investment options. We expect a steady fall in investment demand from 3.5mn units pa now to 2mn in 2030 and less than 1mn by 2050.

  • Adding up the various pieces, we believe total demand for urban housing has peaked in China and may fall from 18mn pa in the 2010s to 6mn by 2050. Because many of the underlying drivers such as demographics tend to move slowly, we expect a gradual fall in annual new demand: around -5% in 2022 and -3% pa thereafter.

  • However, policy-driven credit tightening could have a dramatic effect on property sales in the near term. Using the mortgage cap policy as an example and building on our banks analysts’ estimates, we calculate that property sales may drop as much as 20% next year if banks were to meet the mortgage cap target by end-2022. This is why we believe credit supply holds the key to China's housing outlook in the near term while demand holds the key in the long run.

Credit supply holds the key to China housing outlook in 2022

China’s housing market has been a focal point of debate among investors. For years, reports of excess inventory and empty buildings have suggested oversupply and risk of correction. More recently, faster-than-expected declines in birth rates and financial concerns relating to highly-levered real estate developers have exacerbated market concerns over a significant downturn in China's housing market and its potential repercussions throughout the economy and the financial system.
Seven years ago, we took a deep dive into China's housing market and compared it with the experience of the US and Japan (see Global Economics Paper: China’s housing boom in international context). In this note, we update some of our previous analysis and examine the long-term demand outlook for China housing as well as the near-term credit constraints faced by the property sector. Our estimates suggest that annual demand for new urban housing has peaked in China, falling from 18mn in the 2010s to only 6mn by 2050. Over the next few years, new demand may decline by about 5% in 2022 and 3% per year thereafter. But the policy announced earlier this year to cap the share of banks’ mortgage loans, if implemented strictly and quickly, could drive next year’s property sales down by as much as 20%. Consequently, while underlying demand will be the biggest challenge to the housing construction outlook over the longer term, we believe credit supply holds the key to China’s housing outlook in 2022.

Waning demographic demand for housing

On the surface, China has been building an extraordinary number of new apartments each year over the past 15 years. Compared to the US and Japan where about 5 housing units are added per 1000 population each year, China has been adding three times as much (Exhibit 1). The amount of copper used in China’s property market alone each year is equivalent to the total annual copper consumption in the US in all industries, by our estimates. To put this in context, however, Chinese cities underbuilt residential housing in the decades before the 1998 housing reform. Much of the urban houses built before the 2000s are of low quality. The rapid urbanization process – from 36% in 2000 to 61% in 2020 in a country of 1.4bn population –also led to strong demand for urban housing and seemed to justify the breakneck speed of residential construction that we have seen over the past two decades.
To assess how many new apartments are needed each year in urban China based on demographics, we resort to the following accounting identity:
Demographic demand = (Total population * Urbanization rate) / (Average household size in urban areas)
Changes in the demographic demand calculated above from one year to the next is effectively “urban household formation”. While higher population and urbanization rate boost housing demand, more people per household translate into fewer housing units needed. Exhibits 2, 3 and 4 show the trends in the three demographic factors in China and compare them with the US, Japan and South Korea.
Population growth has slowed considerably in China, from 1.5% per year in the 1980s to less than 0.5% now. Judging from historical international experience, the downward trend is unlikely to reverse despite new government policies such as allowing for third child and reducing the costs of education, healthcare and housing. At 61%, vs. 80% in developed economies, urbanization still has some room to run in China, but the pace is likely to slow given that about three quarters of China’s urbanization process is now behind us. On the other hand, average household size may continue to decline going forward, supporting household formation. Similar to the global trend, young people are getting married at a later age than previous generations. The divorce rate has also been rising as social stigma fades. Both of these trends contribute to smaller urban households and more housing demand given the same urban population.

Exhibit 1: China appears to be building significantly more residential housing units per capita than other countries

1. China appears to be building significantly more residential housing units per capita than other countries. Data available on request.
Source: Haver Analytics, Goldman Sachs Global Investment Research

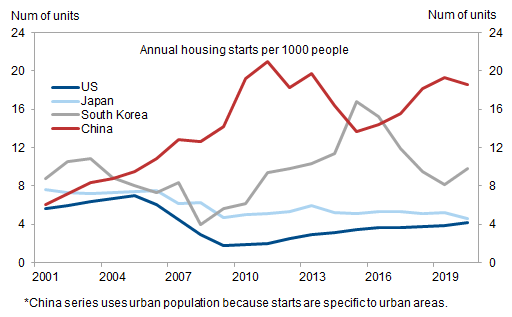
Exhibit 2: Population growth has been declining in China

2. Population growth has been declining in China. Data available on request.
Source: Haver Analytics, Goldman Sachs Global Investment Research

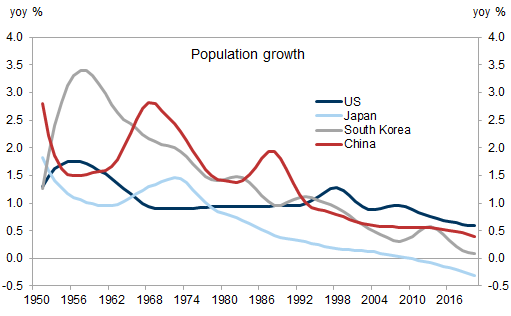
Exhibit 3: Two thirds of the urbanization process in China is now behind us

3. Two thirds of the urbanization process in China is now behind us. Data available on request.
Source: Haver Analytics, Goldman Sachs Global Investment Research

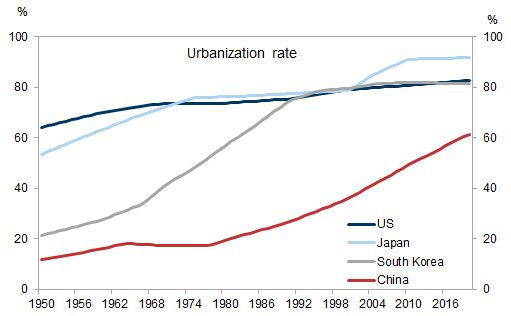
Exhibit 4: Average household size may continue to delcine in China

4. Average household size may continue to delcine in China. Data available on request.
Source: Haver Analytics, Wind, Goldman Sachs Global Investment Research
We combine the United Nations’ (UN) population and urbanization rate projections with our own extrapolation of the recent trend in China’s average household size to calculate demographic demand for urban housing units each year through 2050 (Exhibit 5). Note that the UN population projection has different scenarios. We use the median projection as the baseline but also test the demographic demand under alternative scenarios of population growth.
Exhibit 6 shows our calculated demographic demand for housing each year from 2010 through 2050. At the aggregate level, we expect household formation to drop from 8mn per year in the 2010s to 1.5mn in 2050. At the component level, urbanization was the dominant driver of urban household formation in the 2010s, accounting for 70% of the total, with population growth and household size each contributing 15%. By 2050, negative population growth could subtract 1.5mn from household formation each year, whereas continued urbanization and declining household size each add 1.5mn. Given the recent concerns about faster declines in population growth in China, we also estimate demographic demand under more bearish scenarios of the UN projection. Exhibit 7 shows that, while household formation averages 6.9mn per year during 2020-25 in our base case, it would be 0.5mn lower if population were to follow the lower 95th percentile of the UN’s projection distribution.

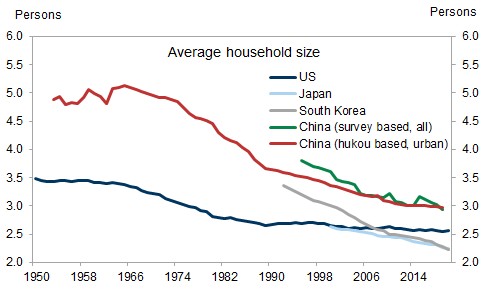
Exhibit 5: We use the UN population and urbanization rate projections and extrapolate the recent trend in average household size

5. We use the UN population and urbanization rate projections and extrapolate the recent trend in average household size. Data available on request.
Source: United Nations, Haver Analytics, Wind, Goldman Sachs Global Investment Research

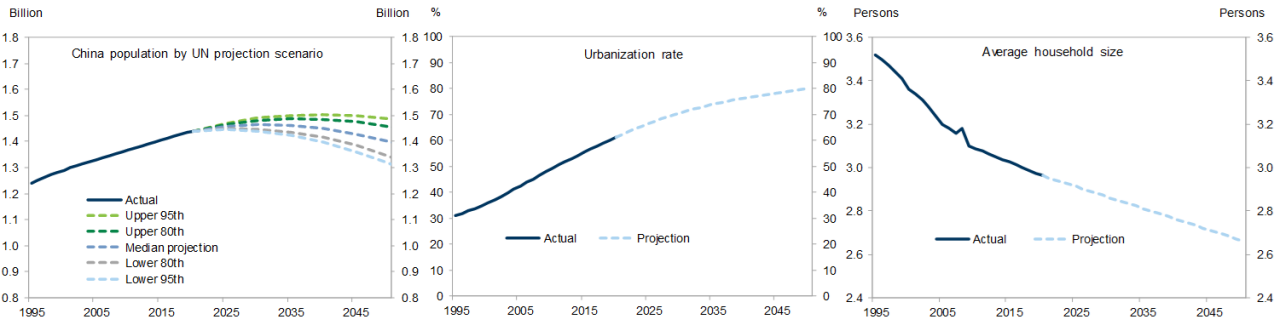
Exhibit 6: Household formation may decline from 8mn per year in 2010s to 1.5mn in 2050

6. Household formation may decline from 8mn per year in 2010s to 1.5mn in 2050. Data available on request.
Source: Haver Analytics, Wind, Goldman Sachs Global Investment Research

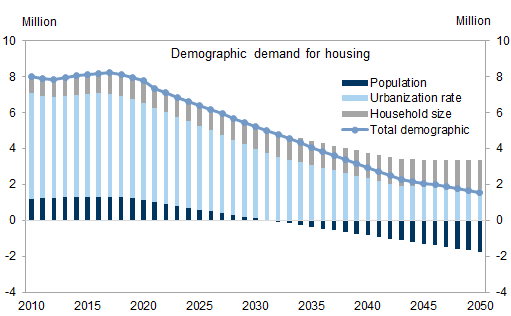
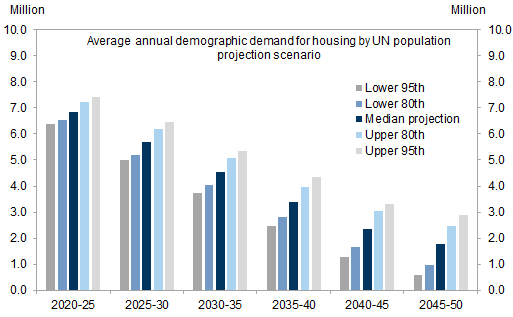
Exhibit 7: Household formation would be 0.5mn lower per year in 2020-25 under the more bearish UN population projection

7. Household formation would be 0.5mn lower per year in 2020-25 under the more bearish UN population projection. Data available on request.
Source: United Nations, Goldman Sachs Global Investment Research

Replacement demand an important driver for years to come

Despite the large number of modern housing units built by real estate developers in Chinese cities, there remains a sizeable stock of non-modern housing in urban areas which tend to be of low quality. According to the 2010 Census (the most recent data available), 10% of urban housing in China did not have a kitchen and 16% did not have its own toilet. In 2020, we estimate that about 40% of the housing stock in Chinese cities was still non-modern housing (defined as housing units not constructed by real estate developers after the 1998 housing reform). This suggests demolition and replacement demand is likely to remain an important driver of residential construction.
Precisely estimating replacement demand is difficult in large countries like the US and is even more challenging for China due to data limitations. Based on industry knowledge, we assume non-modern housing depreciates faster (3% per year) than modern housing (0.5% per year). This translates into a 1.5% overall demolition rate in 2021. The demolition rate declines over time as the share of modern housing (which depreciates more slowly than non-modern housing) in total housing stock increases. By 2030 and 2050, overall demolition rate drops to 1.1% and 0.8%, respectively. Between 2021 and 2025, we estimate an average of 4.5mn units are demolished per year, lower than 2015-2018 when the government’s shantytown redevelopment program took down 6mn units each year. The number of demolitions is expected to fall gradually over time in our estimate, reaching 4mn around 2040 and 3.5mn around 2050.

Investment demand with Chinese characteristics

Household formation and demolitions are mostly “occupied” demand. But there is also fundamental demand for vacant housing, which we call “investment demand”. To clarify, because of the unique nature of housing (e.g., extremely durable, high transaction costs, and often the biggest purchase people make in their lives), housing demand will always have an investment element in it. For example, if one believes that house prices are going to fall next year, he or she would be very unlikely to buy a home this year. Our definition of “investment demand” here is specific to demand for properties that are not intended for year-round occupation. If someone buys an apartment and rents it out, for example, this unit would be included in our demographic and demolition analysis above as a renter will be living in the apartment. However, if a migrant worker who works in a large city buys an apartment in his small hometown city for occasional use, if someone buys a vacation home, or if wealthy households buy properties as an asset allocation decision but do not rent it out, these would fall into our “investment demand” category.
Investment demand for housing should weaken in the future. Over the past decade, investment demand has been strong among Chinese households. Historically, the government used housing as a cyclical instrument to boost growth during economic downturns. As a result, households expected property prices to rise whenever they saw growth was under pressure and invested in the property market accordingly. Exhibit 8 shows that in 2012, 2015 and 2018, household holdings of urban properties increased significantly. Those were also the years when economic growth slowed and the central bank eased monetary policy. Such investment motives are something policymakers are determined to change. Under the “housing is for living in, not for speculation” mantra, policymakers have clearly stated in recent years that housing is no longer a countercyclical instrument (see here for example). Going forward, we expect investment demand for housing to weaken as household expectations adjust to the new housing policy regime.
On the other hand, investment demand is unlikely to completely disappear and might remain higher than in other countries such as the US for three reasons. First, China has about 290mn migrant workers and many of them may want to purchase properties in their hometowns, leading to nontrivial investment demand. Second, as income per capita continues to increase in China, demand for vacation homes should also rise. Third and most importantly, urban households have high savings in China (about 30% saving rate pre-COVID and even higher in 2020 and 2021). Even with a gradually falling saving rate, urban households’ annual savings may still average over 10% of GDP in the coming decade (Exhibit 9). With limited alternative investment options, and significant controls on capital outflows, some of these household savings may be allocated to real estate. This dynamic is similar to Korea where the household saving rate is high and real estate account for 70% of household total assets. Between 2010 and 2020, we estimate an annual average of 5mn units of investment demand. It declines to an annual average of 3mn during 2021-25 and 2.5mn during 2026-30, assuming a gradual shift toward a lower saving rate and more investment options.

Exhibit 8: Households increased property investment during economic downturns historically

8. Households increased property investment during economic downturns historically. Data available on request.
Source: Haver Analytics, Wind, Goldman Sachs Global Investment Research

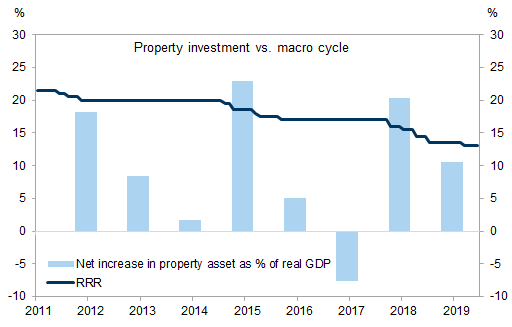
Exhibit 9: Urban household savings likely on downtrend, but still high in the coming decade

9. Urban household savings likely on downtrend, but still high in the coming decade. Data available on request.
Source: Haver Analytics, Goldman Sachs Global Investment Research

Adding up the total demand

Adding up the three components – demographic, demolition and investment demand, Exhibit 10 implies that annual demand for new urban housing has peaked in China. By our estimates, demand may decline from 16.5mn units in 2020 to 11.5mn in 2030, 8mn in 2040, and 6mn in 2050. Turning from this “flow” of property demand to the “stock” of urban housing, Exhibit 11 shows that back in 2000, almost all urban housing in China was non-modern and there was a significant shortage of housing relative to the number of households. By 2050 when China’s urbanization rate is expected to reach 80%, modern housing would account for 90% of total urban housing stock and total vacancy rate rises to 15%, compared to about 10-15% in the US and Japan at present.
To clarify, our demographic demand estimates do not differentiate owner-occupied housing vs. rental housing. If we have more urban households, then we need more urban housing, owner-occupied or rental, because people have to live somewhere. Currently, China's homeownership rate is about 90% vs. 60-65% in the US and Japan. The government's initiative to provide more social rental housing in the 14th Five-Year Plan implies somewhat lower urban homeownership rate in the future. In addition, the concept of "household" here is based on China's hukou registration system. Therefore, in practice two or more households could be living in the same housing units. This is why our estimates show that the "housing stock to household" ratio was only 0.5 in 2000. The co-existence of both a modern housing sector and a non-modern housing sector complicates measurement issues in China's housing market. While media reports often cite China's housing vacancy rate to be over 20%, this tends to focus more on the modern housing sector where investment demand is most concentrated. In the non-modern housing sector, there are still many units housing multiple households. The overall "housing stock to household" ratio, by our estimates, is at 1.05 currently, lower than other countries.

Exhibit 10: Demand for new urban housing units has likely peaked

10. Demand for new urban housing units has likely peaked. Data available on request.
Source: Haver Analytics, Wind, Goldman Sachs Global Investment Research

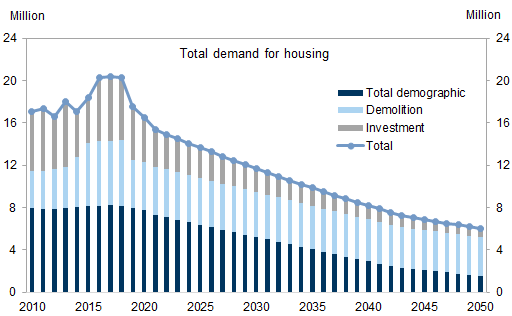
Exhibit 11: Modern housing may account for 90% of total urban housing stock by 2050

11. Modern housing may account for 90% of total urban housing stock by 2050. Data available on request.
Source: Haver Analytics, Wind, Goldman Sachs Global Investment Research

Credit tightening in the property market

Although we estimate that the total demand for housing will decline in the coming years in China, the pace of this decline is likely to be gradual because the underlying forces such as demographics tend to move slowly. However, policy-induced changes can take place more quickly and abruptly. Over the past year, policymakers have introduced a number of new measures tightening credit for both housing supply and housing demand (Exhibit 12). On housing supply, real estate developers are asked to meet the “three red lines (3RL)” by reducing financial leverage. On housing demand, banks are asked to control mortgage lending (via limits on the share of the loan book that can be mortgage- or property-related). While both the 3RL and mortgage cap targets reportedly include multi-year transition periods, policy implementation appeared to gather steam in July and August, driving land transactions and property sales significantly lower (see our property team’s high-frequency tracking here).

Exhibit 12: A number of policy restrictions have been imposed on both housing supply and housing demand

12. A number of policy restrictions have been imposed on both housing supply and housing demand. Data available on request.
Source: Goldman Sachs Global Investment Research
We analyze the mortgage cap policy to illustrate the near-term constraints such as tightening policies may have on next year’s property market. By our banks analysts’ estimates, total mortgage loans outstanding were 31.2% of total bank loans as of 2020. If banks reduce this ratio to 30%, as targeted by regulators, by the end of next year, it would imply RMB 4.3tn/4.2tn/5.7tn new mortgage assets for banks in 2021/22/23 (assuming overall bank loan growth of 11.5%/10.5%/10.5%).
Historically, there is a strong correlation between quarterly new mortgage lending and quarterly property sales (Exhibit 13). We estimate a model where we allow the relationship to vary based on how stringent the down payment requirement is. Intuitively, the same amount of mortgage lending can support more property sales if the down payment requirement is higher and the loan-to-value ratio is lower. For 2022, we assume the mortgage down payment requirement remains unchanged from its current tight levels. Exhibit 14 illustrates unit property sales that different mortgage values would support under different house price assumptions. For example, under our base case where house prices fall 5% next year, RMB5tn new mortgages would be able to finance 14.8mn property sales, whereas RMB4tn could only finance 12.4mn.

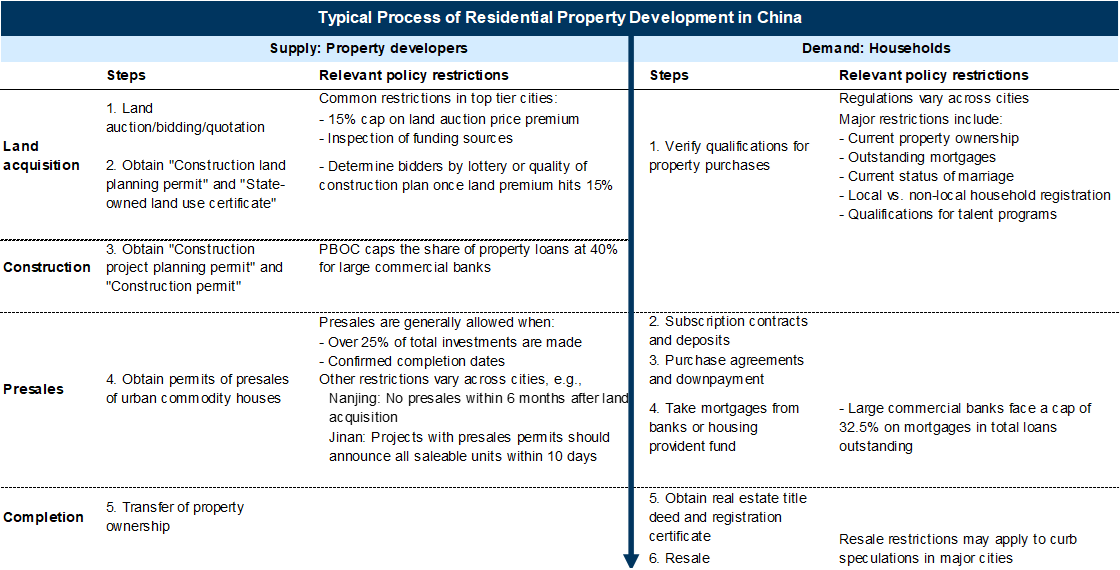
Exhibit 13: A strong correlation between mortgage growth and property sales

13. A strong correlation between mortgage growth and property sales. Data available on request.
Source: Haver Analytics, Wind, Goldman Sachs Global Investment Research

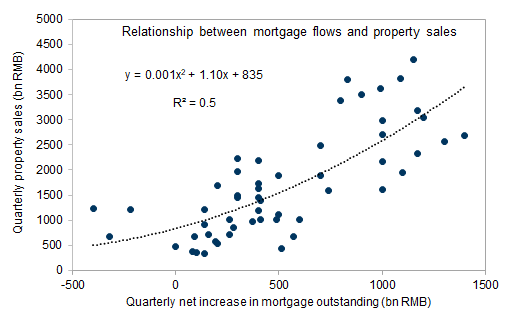
Exhibit 14: Number of property sales that mortgage lending can finance under different house price assumptions

14. Number of property sales that mortgage lending can finance under different house price assumptions. Data available on request.
Source: Goldman Sachs Global Investment Research
Putting housing demand and mortgage credit supply together, Exhibit 15 shows that, under our bank analysts’ estimates of RMB4.2tn new mortgage assets and our property analysts’ assumption of 5% decline in house prices next year, if historical relationships between mortgages and property sales hold, then property sales would drop to 12.8mn units in 2022, a 20% decline from 2021. In contrast, underlying demand only softens 5% in the absence of the mortgage credit constraints. Once the 30% mortgage cap is reached in late 2022 and mortgage growth keeps pace with total loan growth, new mortgage assets are expected to increase RMB5.7tn in 2023. This would support 16.5mn property sales by our estimates, considerably above underlying demand of 14.9mn units in 2023. In other words, mortgage credit supply is the binding constraint for the housing market next year, if banks aim to meet the 30% mortgage cap target by the end of 2022, whereas demand becomes the binding constraint thereafter.
To be clear, there is significant uncertainty in our estimates, whether it is the underlying demand (e.g., demolition rate and investment demand) or the relationship between mortgage growth and property sales. However, our analysis illustrates the risks in reducing property leverage too quickly. Leverage has been built over years or even decades. Cutting the leverage ratio, which is measured using the entire stock of total lending or total liabilities, could cause too much harm to near-term growth if implemented in a compressed timeframe.
This fundamental conflict underlies the challenge of asking all real estate developers to meet the 3RL by mid-2023. By our property analysts’ calculation, doing so in the most stringent sense would require developers to sell RMB18th worth of additional property out of inventory over the next 1.5 years. This is on top of the RMB17tn annual sales to maintain normal cash flows. At the current property price level, the sum of these two numbers almost doubles the average sales volume seen over the past few years. It is difficult to see how this could be feasible without causing house prices to fall sharply. This is particularly problematic in the context of the mortgage cap noted above: full implementation of the 3RL on the reported timeline (which would require developers to sell more properties) appears to conflict with the full implementation of the mortgage cap on the reported timeline (which would limit households’ capacity to purchase those properties).
In the case of the mortgage cap, if our projection of future demand is correct, mortgage lending is likely to decline considerably in the coming decades anyway on falling demand, assuming macro-prudential policies prevent house prices from rising sharply and speculations in the property market from accelerating again. On the other hand, overtightening in mortgage lending in the near-term increases the risk of a severe housing downturn, which in turn would be a significant drag to growth. To the extent the government increases public investment to offset such drags to growth, total leverage in the economy may increase in the end rather than decrease as the government desires.

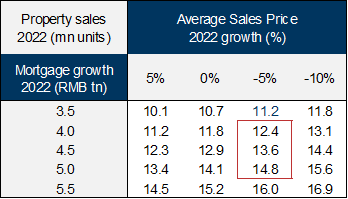
Exhibit 15: Mortgage supply is likely to constrain property sales next year under the mortgage cap regulation

15. Mortgage supply is likely to constrain property sales next year under the mortgage cap regulation. Data available on request.
Source: Goldman Sachs Global Investment Research

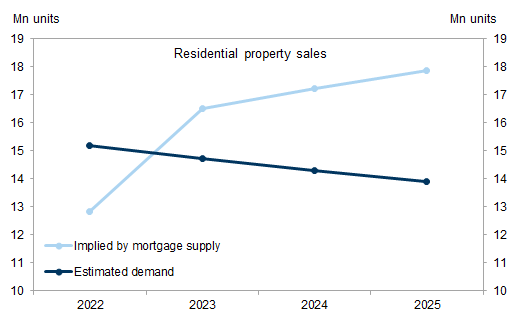
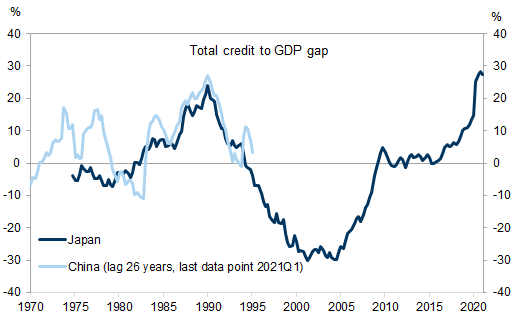
Exhibit 16: Japan’s housing bust was arguably triggered by tightening banks’ real estate lending

16. Japan’s housing bust was arguably triggered by tightening banks’ real estate lending. Data available on request.
Source: Haver Analytics, Goldman Sachs Global Investment Research
Given the demographic similarities between today’s China and Japan 20-30 years ago, some investors worry that China could be at risk of a housing bust and prolonged economic downturn such as Japan experienced in the 1990s. Exhibit 16 overlays China’s credit-to-GDP gap on top of Japan’s in 1975-1995 and the two look strikingly similar. (The Credit-to-GDP gap calculates the deviation of a country’s credit-to-GDP ratio from its long-run trend and is a measure of excess credit.) In Japan’s experience, the hard landing from the real estate bubble was arguably triggered by the regulation to tighten banks’ real estate lending in 1990 (see the “Lessons from Japan” series here, here and here). By the 2000s, land prices in Japan had fallen by more than 60% from their peak and the credit-to-GDP ratio was 30% below its long-run trend. The lesson from Japan for China in addressing excesses in the property market: while deleveraging efforts are warranted after years of rapid credit growth, too fast a deleveraging process could exacerbate rather than reduce the potential risks policymakers set out to address.
We thank Yuting Yang, an intern in the Asia Economics team, for her contribution.

Investors should consider this report as only a single factor in making their investment decision. For Reg AC certification and other important disclosures, see the Disclosure Appendix, or go to www.gs.com/research/hedge.html.