Goldman Sachs Research
US Economics Analyst
Track My Package: A Roadmap for Supply Chain Normalization (Hill)
26 October 2021 | 1:32AM EDT | Research | Economics| By Jan Hatzius and others
More
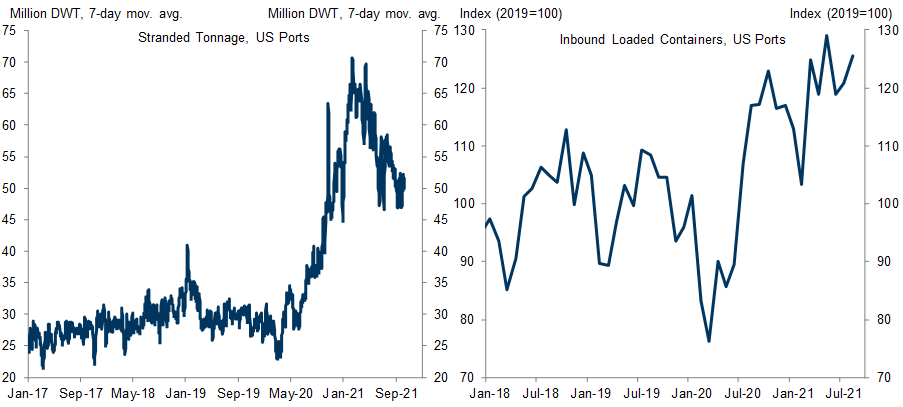
  • With used car prices rising sharply again and 30+ million tons of cargo waiting outside US ports ahead of the holiday season, we assess three key drivers of supply chain normalization and their most likely timing: 1) improved chip supply driven by post-Delta factory restarts (4Q21) and eventually by expanded production capacity (2H22 and 2023); 2) improved US labor supply (4Q21 and 1H22); and 3) the wind-down of US port congestion (2H22).

  • The first channel for easing supply constraints and core goods inflation is a post-Delta rebound in Southeast Asian chip production. Imports of key semiconductor inputs from Malaysia and Vietnam had declined 36% by August due to covid lockdowns, leading to a 15% monthly drop in US auto production in September (to 71% of the 2019 level). But rapid vaccination has already led to reduced infections and partial relaxation of lockdowns, which should improve automotive chip supply and US vehicle production in Q4.

  • While this could return US auto production to late 2020 levels, a buildout of microchip production capacity is probably required to sustain above-normal production, restock heavily depleted vehicle inventories, and keep up with the rising semiconductor requirements of smart cars. This is likely to take longer, and we now expect auto dealer inventories to remain very low through mid-2022.

  • The second channel for easing supply constraints is improving labor supply. We estimate the September expiration of emergency unemployment insurance benefits will boost Q4 job growth by around 1mn, and we expect some of the 2-3mn individuals staying away from the workplace because of health concerns to return to the job market by mid-2022.

  • The third channel for easing supply constraints is reducing port congestion after the busy US holiday and pre-Chinese New Year shipping windows. A quicker flow of imports would help to alleviate shortages and reduce inflationary pressures for items such as furniture and sporting goods.

  • We are boosting our sequential inflation assumptions for Q4 and early 2022. We now expect year-on-year core PCE inflation of 4.3% at year-end, 3.0% in June 2022, and 2.15% in December 2022 (vs. 4.25%, 2.7% and 2.0% previously). This slower resolution of supply constraints means that year-on-year inflation will be higher in the immediate aftermath of tapering than we had previously expected. While we expect inflation to be on a sharp downward trajectory at that point and to continue falling through end-2022, this higher-for-longer path increases the risk of an earlier hike in 2022.

Track My Package: A Roadmap for Supply Chain Normalization

The Manheim used vehicle index increased 8.3% in the first 15 days of October (see Exhibit 1) due to yet another global supply shock: Delta-variant factory shutdowns in Southeast Asia and elsewhere. We previously expected improved microchip availability by 1H22 on the back of normalizing Japanese automotive shipments (post-factory fire) and a US supply response. But with these catalysts now behind us—the Naka factory in Japan resumed normal shipments activity in July and US semiconductor plant hours jumped to 73 hours per week in the first half of the year vs. 46 in 2019 (see same exhibit)—we now expect a more extended timeline.

Exhibit 1: Shortages of Microchips and Autos Are Worsening Again, and the Domestic Output Response Has Already Occurred

1. Shortages of Microchips and Autos Are Worsening Again, and the Domestic Output Response Has Already Occurred. Data available on request.
Source: Goldman Sachs Global Investment Research, Company data, IHS Global Insight, Department of Commerce, Bloomberg LP
In this edition of the Analyst, we assess three key drivers of supply chain normalization, their likely timing, and the key indicators to track progress.
We start by reviewing one unique aspect of the global semiconductor industry that sets it apart from most other manufacturing and services industries of today’s economy: outside of Southeast Asian plant shutdowns, both output and capacity utilization have already returned to quite elevated levels (see Exhibit 2).

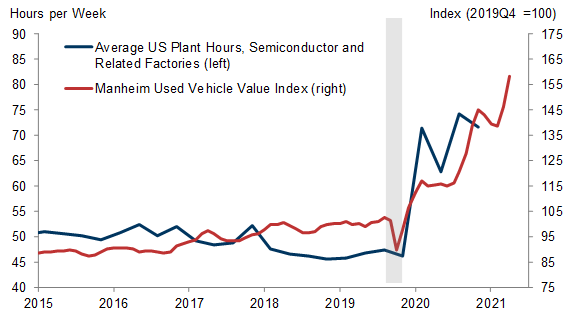
Exhibit 2: Global Chip Production Is 15% Above Trend; Key Upstream Industries for Autos and Consumer Electronics Are Already Operating Near Full Capacity

2. Global Chip Production Is 15% Above Trend; Key Upstream Industries for Autos and Consumer Electronics Are Already Operating Near Full Capacity. Data available on request.
Source: Goldman Sachs Global Investment Research, Company data, IHS Global Insight, Department of Commerce, Bloomberg LP
So while the supply of dress shirts and haircuts is likely to rise sharply if demand returns, higher utilization of existing semiconductor capacity is not a viable path toward resolving the chip shortage, in our view.
Additionally, while this piece focuses on supply specifically, we also continue to believe that moderation in US and global goods demand has alleviated and will continue to alleviate goods-sector imbalances. As shown in the left panel of Exhibit 3, real retail spending has already normalized in major foreign economies. And while it picked back up domestically in August and September, US goods consumption has nonetheless declined by 5% since March (sa, not annualized).

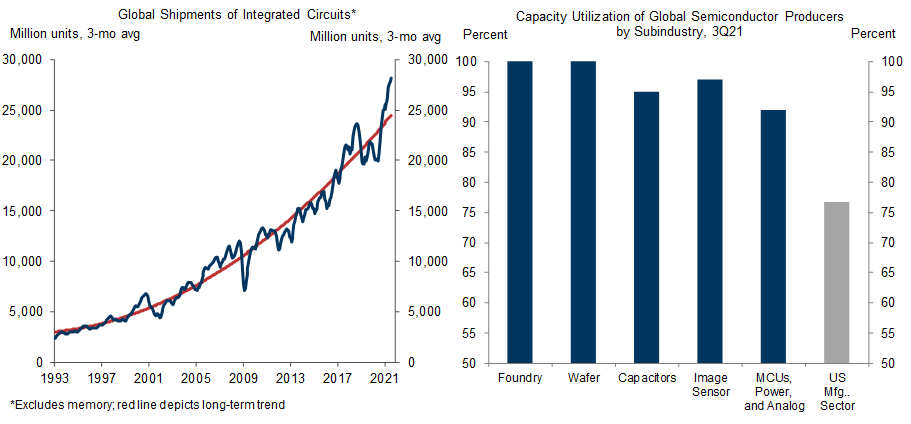
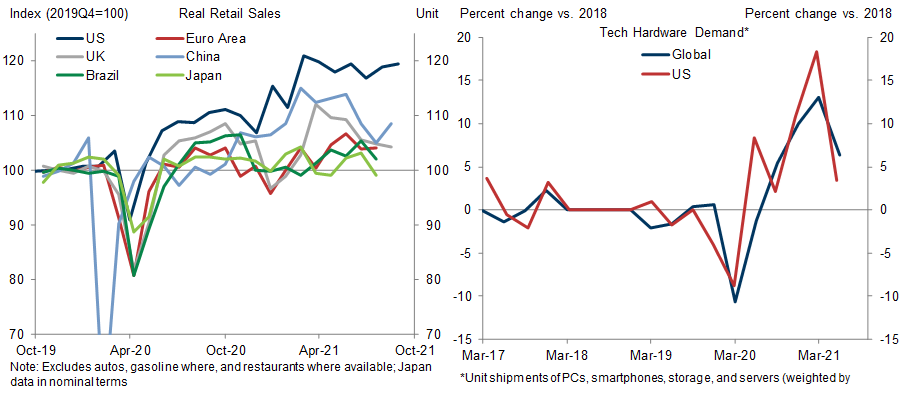
Exhibit 3: Global Retail Spending is Slowing, but Demand for Consumer Electronics Is Likely to Remain Firm

3. Global Retail Spending is Slowing, but Demand for Consumer Electronics Is Likely to Remain Firm. Data available on request.
Source: Goldman Sachs Global Investment Research, Company data, IHS Global Insight, Department of Commerce, Bloomberg LP
We also note that from the perspective of the key bottlenecks contributing to inflation, demand for consumer electronics, business tech, and other semiconductor-intensive products has remained elevated—both globally and in the US (see right panel). Nor do we expect the increased digitization of society and consumer preferences to reverse post-pandemic: our equity analysts forecast demand for semiconductor-intensive consumer goods to remain strong in 2022 (smartphones +4% after +12% in 2021, autos +5% after +6%, PCs -12% after +28% cumulatively in 2020 and 2021).
Returning to supply constraints, we discuss the three key resolution channels in turn (global chip production, US labor supply, reduced port congestion).

Channel 1, Step 1: Improved Chip Supply from East Asia Reboot

Expected timeline: 4Q21
Key indicators to watch:
  • GS Effective Lockdown Indices (ELI)—particularly in Malaysia, Vietnam, Mainland China, and Taiwan

  • East Asian industrial production and exports of semiconductors, electrical components, and consumer electronics

  • Automaker commentary on near-term chip availability

  • China industrial policy, with respect to power cuts and the Delta variant

  • Early- and mid-month trade reports (Japan, Taiwan, and Korea)

As shown in Exhibit 4, three supply shocks weighed heavily on auto production this year, starting in February with severe winter storms and power outages in the southern United States and followed by a March fire at the Renesas automotive chip factory in Naka, Japan. While the plant was fully rebuilt in Q2 and auto production was set to return to near-normal levels in Q3, the arrival of the Delta variant and “zero covid” policies in some East Asian economies combined to produce another sharp drop in US semiconductor supply. The red line in the same exhibit shows the mid-year stepdown in automotive semiconductor units imported from key East Asian suppliers (data derived from granular Census trade records that include unit counts).[1]

Exhibit 4: Mid-Year Auto Production Weakness Mostly Reflected Disruptions to East Asian Chip Supply

4. Mid-Year Auto Production Weakness Mostly Reflected Disruptions to East Asian Chip Supply. Data available on request.
Source: Goldman Sachs Global Investment Research, Company data, IHS Global Insight, Department of Commerce, Bloomberg LP
Looking ahead, we are encouraged by the vaccination-led drop in infection rates (see left and center panel of Exhibit 5). Lockdown severity is also now approaching pre-Delta levels in both Malaysia and Vietnam (right panel).

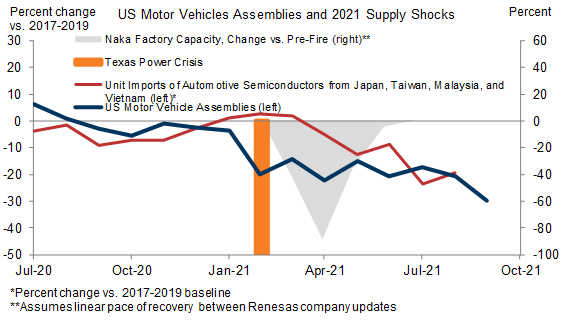
Exhibit 5: Southeast Asia Beginning to Normalize Post Delta Wave

5. Southeast Asia Beginning to Normalize Post Delta Wave. Data available on request.
Source: Our World in Data, Goldman Sachs Global Investment Research
Going forward, we plan to track the semiconductor output and trade statistics of these key suppliers. We will also closely watch Chinese output and export data to monitor possible disruptions to chip or consumer goods supplies, for example related to power cuts or covid restrictions. For example, imports of integrated circuits from Vietnam and semiconductor devices and diodes from Malaysia declined 34% year-on-year in August, but Chinese production has so far remained firm.

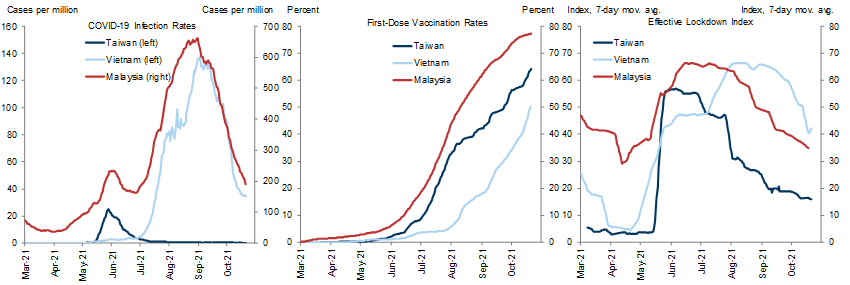
Exhibit 6: Rebounding Malaysian and Vietnamese Production a Key Near-Term Catalyst; Chinese Industrial Policy a Wildcard

6. Rebounding Malaysian and Vietnamese Production a Key Near-Term Catalyst; Chinese Industrial Policy a Wildcard. Data available on request.
Source: Goldman Sachs Global Investment Research, Company data, IHS Global Insight, Department of Commerce, Bloomberg LP
These developments—coupled with better near-term production commentary from General Motors and Toyota—argue for some microchip relief in Q4, and we estimate the removal of this supply bottleneck could return US auto production to or near the 10-11mn SAAR range achieved in late 2020 (vs. 7.8mn in September and 8.6mn in Q3).
Increases beyond that pace would likely require additional supply improvements, in part because today’s smart cars utilize more and more automotive systems with microchips and in part because of the continued mix shift towards SUVs and electric vehicles (EVs), both of which are relatively chip-intensive. Exhibit 7 plots the ratio of global automotive semiconductor shipments to global vehicle production (both on a unit basis.) The secular increase in chip intensity continued in 2021 and suggests demand for automotive semiconductors will continue to rise even with flattish unit vehicle demand.

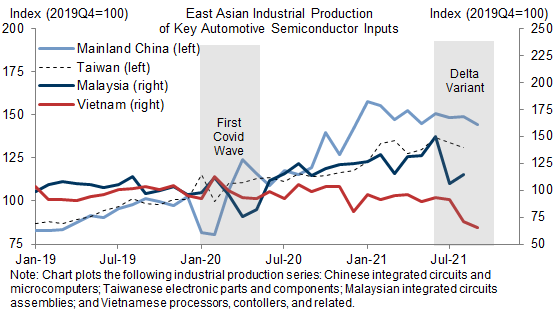
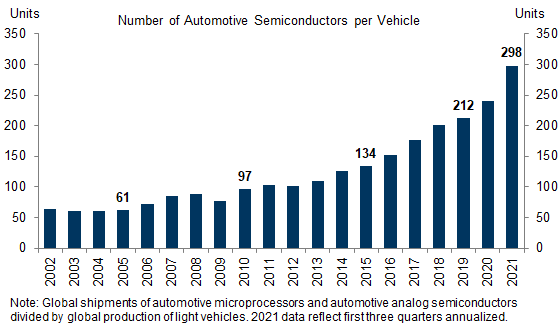
Exhibit 7: Today’s Vehicles Require ~40% More Automotive Semiconductors than Pre-Pandemic Cars

7. Today’s Vehicles Require ~40% More Automotive Semiconductors than Pre-Pandemic Cars. Data available on request.
Source: Goldman Sachs Global Investment Research, Company data, IHS Global Insight, Department of Commerce, Bloomberg LP

Channel 1, Step 2: Improved Chip Supply from New Capacity

Expected timeline: 2H22, with a more normal environment in 2023
Key indicators to watch:
  • Global semiconductor shipments, particularly automotive: Microcontroller Units (MCUs), power semiconductor, analog devices

  • GS equity research forecasts for semiconductor capacity growth

  • 2022 auto production forecasts (GS equity research, IHS)

  • US industrial production of computers, communication equipment, and semiconductors

  • Foreign production and US imports of auto and consumer electronics

In our view, the key step towards easing supply constraints and lowering core goods prices is the buildout of global microchip production capacity. But despite the dramatic impact of the chip shortages on US economic output and consumer prices, automotive semiconductor capex only rose back above the 2019 pace in Q3 (see Exhibit 8). And with 2-3 quarter lags between equipment capex and chip production—and several-year lead times for new foundries—the rise in capex to above-normal levels in Q4 may not meaningfully boost chip supply until the second half of next year.

Exhibit 8: Automotive Semiconductor Capex Now Back to 2019 Levels; Above-Normal Equipment Purchases Will Benefit Chip Supply—but Not Until 2H22

8. Automotive Semiconductor Capex Now Back to 2019 Levels; Above-Normal Equipment Purchases Will Benefit Chip Supply—but Not Until 2H22. Data available on request.
Source: Goldman Sachs Global Investment Research, Company data, IHS Global Insight, Department of Commerce, Bloomberg LP
Key reasons for the relatively slow and restrained capex response include the long lead times and high fixed costs of new foundries[2] and the likelihood that downstream industries will shift production away from the semis currently in short supply—many of which are older generation productsto begin with. High industry concentration (see dark blue bars of Exhibit 9) is another factor contributing to restrained capital deployment in the face of very strong near-term demand.

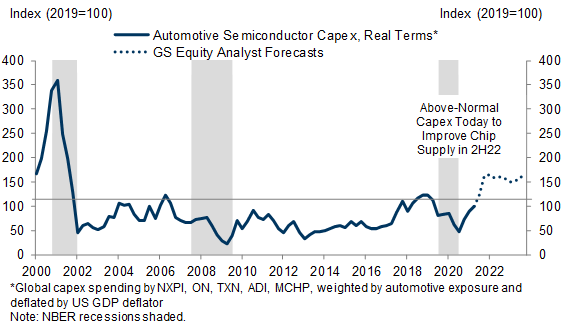
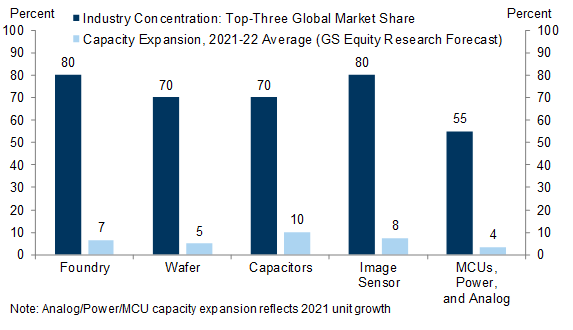
Exhibit 9: High Industry Concentration and Long Lead Times Are Limiting Chip Capacity Expansions

9. High Industry Concentration and Long Lead Times Are Limiting Chip Capacity Expansions. Data available on request.
Source: Goldman Sachs Global Investment Research, Company data, IHS Global Insight, Department of Commerce, Bloomberg LP
Our analysts are tracking capacity growth of just 5-10% per year in 2021-22 among the semiconductor industries that supply the auto and consumer electronics sectors (see light blue bars). With consumer demand for these products also likely growing at that horizon and given the rising semiconductor content of motor vehicles, we now expect chip supply to remain constrained through at least mid-2022. This reduces the scope for automakers to sustain above-normal production, and restock heavily depleted vehicle inventories. Accordingly, we expect auto dealer inventories to remain very low through mid-2022.
Relatedly, our equity analysts now expect the supply-demand balance for microprocessors and power semiconductors to remain very tight throughout 2022, with the analog segment—which is also very important for auto production—remaining tight through Q1 but returning to balance in mid-2022.

Channel 2: Improved US Labor Supply

Expected timeline: Q421 and 1H22
Key indicators to watch:
  • Payrolls, particularly manufacturing and transportation

  • JOLTS, particularly manufacturing and transportation

  • Industrial production of consumer goods, excluding autos and high tech

  • Supplier deliveries components of ISMs and regional Fed surveys

  • Labor force participation rate

Labor shortages are another important bottleneck. We expect labor supply constraints to ease substantially in coming months for several reasons (see left panel of Exhibit 10). First, we estimate that the September expiration of unemployment insurance benefits will boost Q4 job growth by around 1.0mn. Second, we expect workers who have left their jobs because of child care concerns to return to work now that schools have reopened. Third, we expect that virus concerns will continue to fade as vaccinations increase further and infection rates fall—this would encourage some of the 2-3mn individuals staying away from the workplace because of health concerns to return to the job market (see right panel of Exhibit 10).

Exhibit 10: We Expect Labor Supply Constraints to Ease in Coming Months

10. We Expect Labor Supply Constraints to Ease in Coming Months. Data available on request.
Source: Census Bureau, Goldman Sachs Global Investment Research
Taken together, we expect total employment to increase by about 4mn workers by end-2022, a 2.7% boost to nonfarm payroll employment. As shown in Exhibit 11, labor demand in these industries is 5.1% and 0.9% above pre-pandemic levels in transportation and manufacturing, respectively. With job openings and wages at new highs for factory and transportation jobs, we expect these labor shortages to ease gradually as the sectors draw workers from lower-paid services industries.[3]

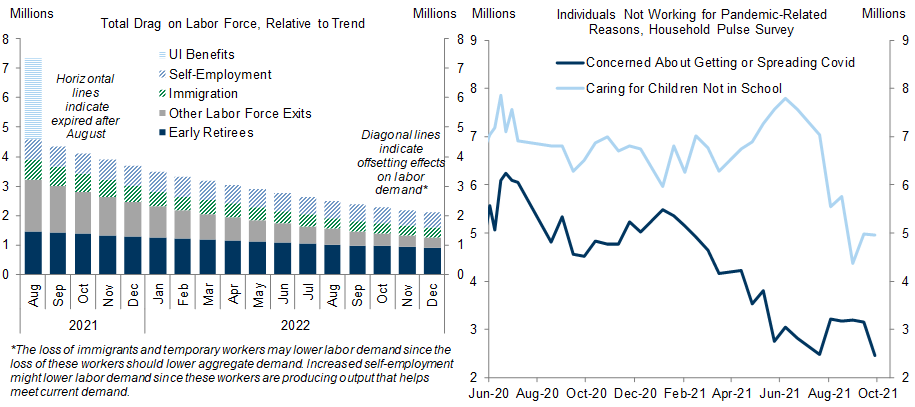
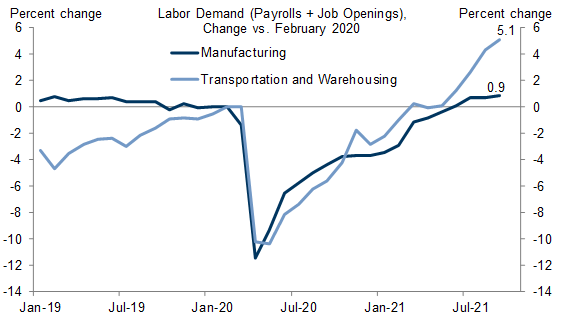
Exhibit 11: Labor Demand Above Pre-Pandemic Level in Manufacturing and Even More So in Transportation

11. Labor Demand Above Pre-Pandemic Level in Manufacturing and Even More So in Transportation. Data available on request.
Source: US Bureau of Labor Statistics, Goldman Sachs Global Investment Research

Channel 3: Unwind of Port Congestion

Expected timeline: 1H22
Key indicators to watch:
  • Transportation payrolls, particularly in the marine cargo handling, support activities for transportation, couriers and messengers, and warehousing and storage sectors

  • Ships at anchor and inbound container traffic at US ports

  • Shipments component of the Cass Freight Index

  • US ex-auto manufacturing production

  • US imports of cars and consumer goods

  • Real retail inventories, excluding autos

Shipping delays and port congestion are also important bottlenecks for seaborne consumer products like furniture and sporting goods—semiconductors and high-value electronics generally arrive via airfreight.
Stranded cargo at the Port of Los Angeles has surged to record highs (left panel of Exhibit 12) due to elevated trade volume—container inflows into US ports are 25% above pre-pandemic levels (see right panel)—and ongoing shortages of transportation-sector labor.

Exhibit 12: Over 30 Million Tons of Cargo Waiting to Be Unloaded, as Port Traffic Remains Well Above Trend

12. Over 30 Million Tons of Cargo Waiting to Be Unloaded, as Port Traffic Remains Well Above Trend. Data available on request.
Source: GS Dataworks, Census Bureau, Goldman Sachs Global Investment Research
We don’t expect significant near-term capacity growth in the goods shipping sector because bottlenecks currently constrain multiple modes of transportation. For example, if ports increased their capacity but the truck-driver shortage is not resolved, total shipping times could remain little changed. Moreover, to the extent transportation companies view shipping demand as temporarily elevated, they are unlikely to boost capacity meaningfully in the near-term.
We instead see two other drivers behind an expected easing in shipping and transportation constraints in the first half of 2022. First, demand is seasonally weaker in the fall and winter, bottoming out in February after the Chinese New Year when it is typically about 15-20% below August levels. If port throughput maintains the August not-seasonally-adjusted pace, the seasonal moderation in demand would help clear the backlog. Second, and as discussed in more detail here and in Exhibit 3, we expect US import volumes to normalize somewhat due to waning fiscal stimulus and a consumer rotation back toward services consumption.

Inflation and Fed Implications

We are boosting our sequential inflation assumptions for Q4 and early 2022 to reflect these continued upward price pressures. We now forecast year-on-year core PCE inflation of 4.3% at year-end, 3.0% in June 2022, and 2.15% in December 2022 (vs. 4.25%, 2.7% and 2.0% previously).
This slower resolution of supply constraints means that year-on-year inflation will be higher in the immediate aftermath of tapering than we had previously expected. While we expect inflation to be on a sharp downward trajectory at that point and to continue falling through the end of the year, this higher-for-longer path increases the risk of an earlier hike in 2022.

Spencer Hill

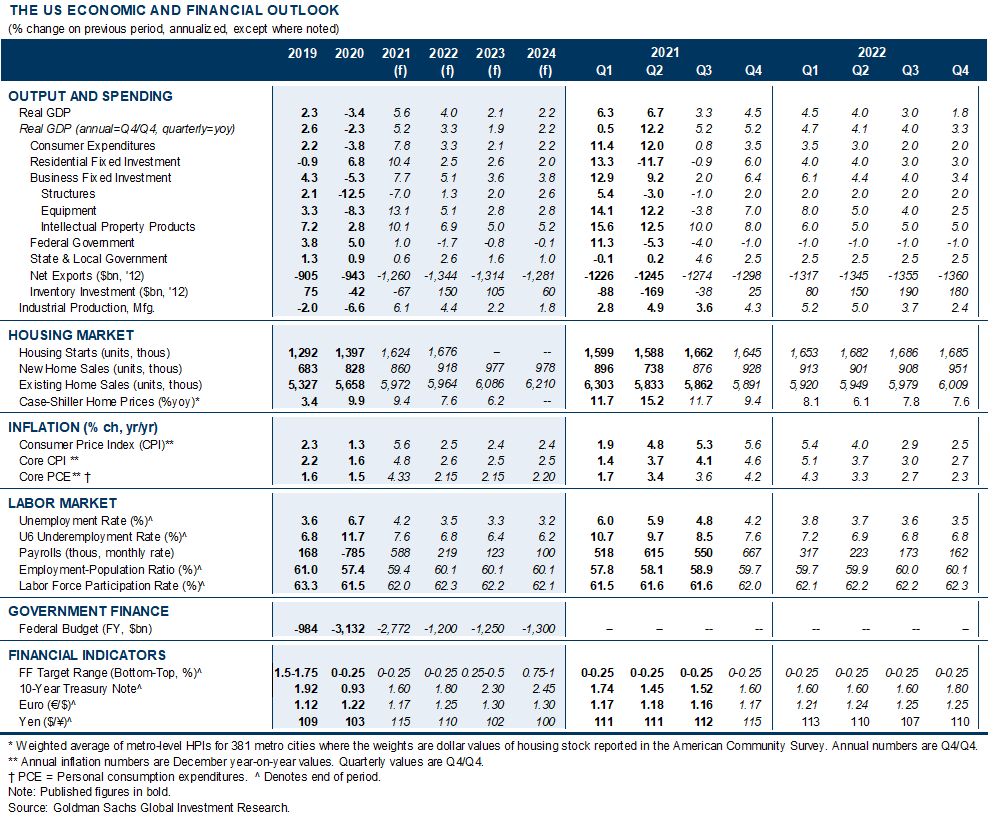
The US Economic and Financial Outlook
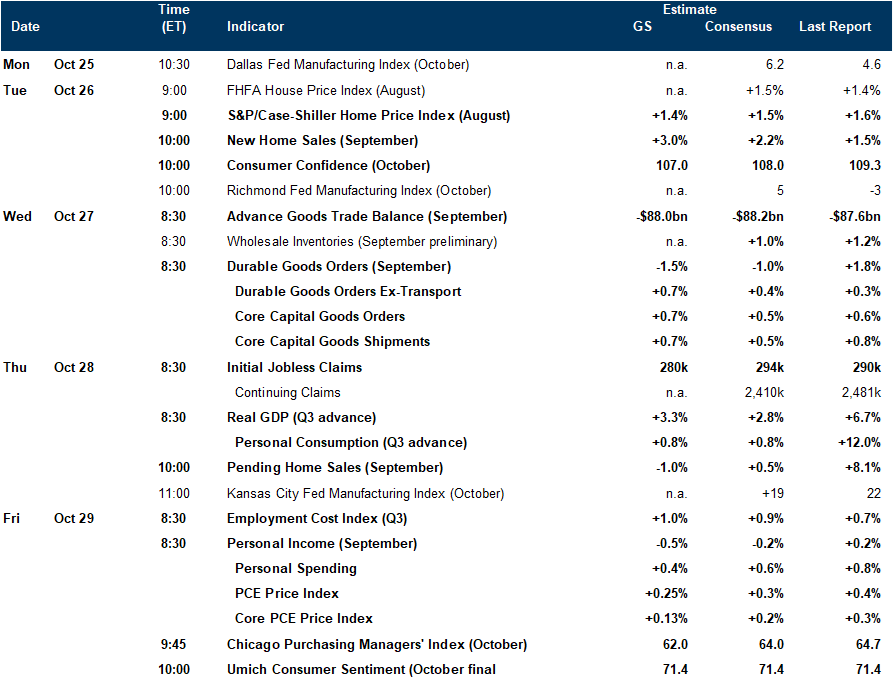
Data available on request.
Source: Goldman Sachs Global Investment Research

Economic Releases

Data available on request.
Source: Goldman Sachs Global Investment Research
  1. 1 ^ Measurement is a challenge in understanding the semiconductor shortage and tracking its resolution, because imports and shipments data are collected in nominal terms, and the deflators used do not convert them into discrete units (which in many cases are a binding constraint on unit auto or smartphone production).
  2. 2 ^ For example, the automotive chip expansion announced by Intel in March is not expected to commence deliveries this year.
  3. 3 ^ Labor supply is currently lagging demand, as hours worked in the transportation sector are up only 1.3% and hours worked in manufacturing are down relative to pre-pandemic levels.

Investors should consider this report as only a single factor in making their investment decision. For Reg AC certification and other important disclosures, see the Disclosure Appendix, or go to www.gs.com/research/hedge.html.