Goldman Sachs Research
Global Economics Analyst
How Fast Does the World Grow? (Daly/Gedminas)
27 October 2021 | 11:24AM EDT | Research | Economics| By Jan Hatzius and others
More
  • How fast does the world grow? The most common method of measuring global GDP growth is to weight each country’s growth rates together using purchasing power parity (PPP) exchange rates. On this basis, global real GDP growth averaged 3.2% in the 1990s, 3.7% in the 2000s, and 3.5% in the 2010s.

  • The logic of using PPP exchange rates rather than market exchange rates is that they adjust for the fact that goods and services are typically cheaper in relatively poor economies than in rich economies. For this reason, PPP-based weights are better at capturing the welfare implications of global growth.

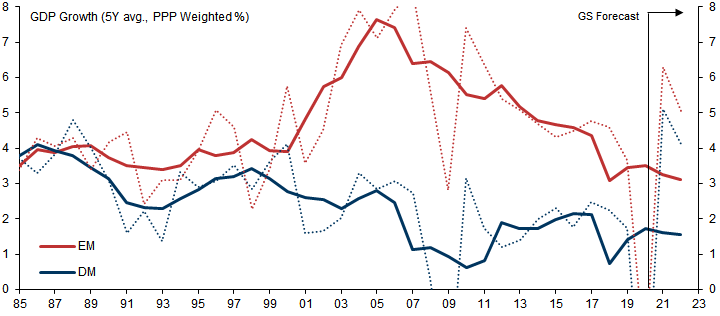
  • However, from the perspective of financial markets, using market-based exchange rates is arguably a more appropriate methodology. On this basis, global GDP growth averaged 3.0% in the 1990s, 2.6% in the 2000s, and 3.0% in the 2010s. This is lower than the growth rates recorded using PPP weights, because the latter give a larger weighting to EM economies and EMs typically grow faster than DMs. The gap between the two measures increased to more than 1pp per year during the BRICs boom period (2000-2010) and has since fallen back to a little under 0.5pp on average. For 2021, the gap between PPP- and market-weighted global GDP growth appears likely to be small (6.0% vs. 5.9% on our estimates), because we expect the EM-DM growth differential to be unusually low this year.

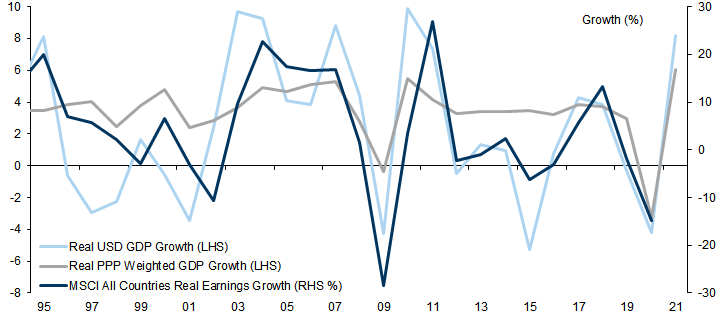
  • Both of these approaches weight the growth rates of individual countries. A separate approach is to calculate the value of global GDP denominated in a common currency (typically the US Dollar), by converting the levels of each country’s GDP at current market exchange rates, before adjusting for inflation. Real USD global GDP captures both economic growth and FX revaluation effects and is therefore more volatile than standard measures. However, for investors trading in global equity indices quoted in USD, aggregating global GDP in this way more closely matches the reality that they face (e.g., earnings growth for the MSCI All Country World Index is more closely correlated with global GDP calculated by aggregating levels rather than growth rates). Reflecting the weakness of the US Dollar this year vs. its 2020 average, we expect the real USD value of global GDP to rise by 8.2% this year, vs. 6.0% using PPP weights.

  • In 2022, we will start publishing global growth forecasts for market-weighted and USD GDP, in parallel with our existing PPP-weighted forecasts.

How Fast Does the World Grow?

Calculating Global GDP Growth

As macroeconomists, we often talk about global GDP growth or regional GDP growth without giving much thought or description to how these aggregates are calculated. But the choice of how one weights countries to calculate aggregate growth rates can produce very different results, and these differences have important implications for financial markets.
Because countries report GDP in local currencies, it is not possible to sum the levels of GDP across a number of countries (unless those countries use a common currency, as is the case in the Euro area). Rather, aggregate growth rates are calculated by weighting each country's growth rate, with weights that reflect the relative size of economies.
To calculate these weights, each country’s GDP needs to be converted into a common currency (in practice, the US Dollar). But what exchange rates should one use to make this conversion? Two different methodologies are typically used:
  1. The most common approach is to use purchasing power parity (PPP) exchange rates, which calculate the rate at which the currency of one country would have to be converted into that of another country to buy the same amount of goods and services in each country. PPP-based weights adjust for the fact that goods and services are typically cheaper in relatively poor economies than in rich economies. For this reason, PPP-based weights are better designed to capture the welfare implications of global growth.

  2. The second approach is to use market exchange rates to convert each country’s GDP into a common currency. This approach makes no adjustment for differences in spending power across economies but the weights accurately reflect the Dollar value of each economy’s GDP. For this reason, market FX weights are arguably the more appropriate methodology from the perspective of financial markets.

Importantly, PPP-based exchange rates, in adjusting for cost of living differences across economies, give a larger weighting to relatively poor (i.e., EM and Frontier) economies than market-based weights.

Market-Weighted Global GDP Growth Typically Weaker than PPP-Weighted Growth

Exhibit 1 compares the 5-year rolling averages of global GDP growth calculated using PPP- and market-based weights. Global GDP growth calculated using market-based weights has been consistently weaker, averaging 3.0% between 2010 and 2019 vs. 3.5% using PPP-based weights. These averages fall to 2.8% and 2.3% respectively, if we include the pandemic-driven decline in global GDP in 2020.

Exhibit 1: PPP-Based Weights Typically Show Higher Global Growth than Market-Based Weights

Global GDP growth using PPP and market-based weights
1. PPP-Based Weights Typically Show Higher Global Growth than Market-Based Weights. Data available on request.
Solid line - rolling and centred 5Y average, dashed line - individual year
Source: IMF, Goldman Sachs Global Investment Research
The reason global GDP growth calculated using PPP-based weights is generally stronger than growth using market-based weights is that PPP-based weights give a larger weighting to EM economies, and EMs typically grow faster than DMs (Exhibit 2). The gap between the two measures increased to more than 1pp per year during the BRICs boom period (2000-2010) and has since fallen back to a little under 0.5pp on average.[1]
For 2021, the gap between PPP- and market-weighted global GDP appears likely to be small (6.0% vs. 5.9% on our estimates). This is because we expect the EM-DM growth differential to be unusually low this year.

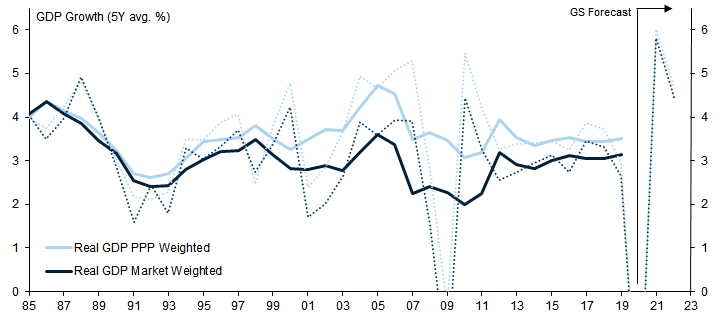
Exhibit 2: EMs Continue to Grow Faster than DMs, Although the Gap Has Narrowed

EM and DM PPP-weighted GDP growth rates
2. EMs Continue to Grow Faster than DMs, Although the Gap Has Narrowed. Data available on request.
Solid line - rolling and centred 5Y average, dashed line - individual year
Source: IMF, Goldman Sachs Global Investment Research

Dollar-Denominated Global GDP — More Volatile, But Closer to the Experience of Equity Market Participants

Both of the approaches discussed so far weight the growth rates of individual countries. An entirely separate approach is to calculate the value of global GDP denominated in a common currency (typically the US Dollar), by converting the levels of each country’s GDP using current market exchange rates, before adjusting for inflation.[2] Real USD GDP captures both economic growth and FX revaluation effects and is therefore much more volatile than standard measures (Exhibit 3). Most of this additional volatility can be accounted for by variations in the US Dollar effective exchange rate over time (Exhibit 4).

Exhibit 3: Growth in Dollar-Denominated Global GDP More Volatile than PPP-Weighted GDP

Global GDP growth, Real USD vs. PPP weighted
3. Growth in Dollar-Denominated Global GDP More Volatile than PPP-Weighted GDP. Data available on request.
Real USD growth is calculated by adding global nominal USD GDP, deflated by US CPI index
Source: IMF, Goldman Sachs Global Investment Research

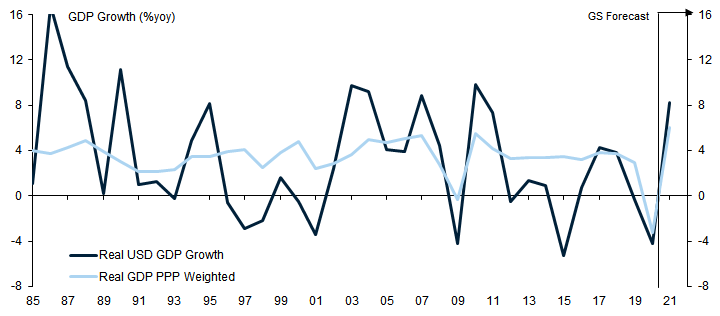
Exhibit 4: Dollar-Denominated GDP Fluctuations Closely Correlated with Broad Dollar Exchange Rate Index

Real USD global growth vs. US broad effective exchange rate (NEER)
4. Dollar-Denominated GDP Fluctuations Closely Correlated with Broad Dollar Exchange Rate Index. Data available on request.
Real USD growth is calculated by adding global nominal USD GDP, deflated by US CPI index
Source: IMF, Haver Analytics, Goldman Sachs Global Investment Research
Calculating the US Dollar value of global GDP in this way replicates the methodology used in aggregating global equity and bond indices across a number of different markets (e.g., such as the MSCI World Indices). Thus, while the resulting series is more volatile than standard measures, aggregating global GDP in this way more closely matches the reality faced by investors trading in global equity indices and other global indices.[3]
In Exhibit 5, we compare earnings growth for the MSCI All Country World Index with global GDP growth calculated by aggregating GDP levels and the standard PPP-weighted global growth rate. Variations in global earnings growth are more closely linked to fluctuations in the real US Dollar value of global GDP than they are to standard measures of global GDP growth.

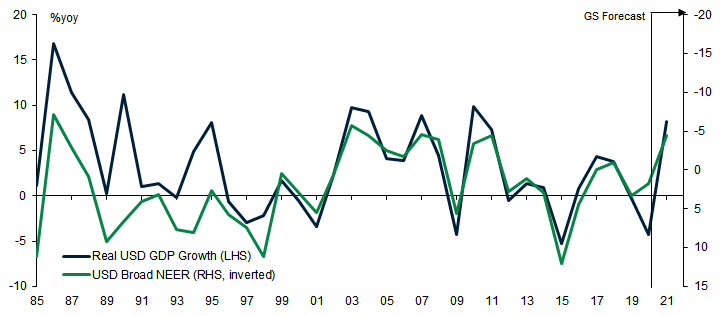
Exhibit 5: Earnings Growth More Closely Linked to Real USD Growth than Real PPP GDP Growth

MSCI All Countries earnings deflated by US CPI versus real PPP weighted GDP growth and real USD growth
5. Earnings Growth More Closely Linked to Real USD Growth than Real PPP GDP Growth. Data available on request.
Real USD growth is calculated by adding global nominal US$ GDP, deflated by US CPI index
Source: IMF, Goldman Sachs Global Investment Research, Datastream

Dollar Decline vs. 2020 Contributing to Exceptional USD Global Growth in 2021

Real exchange rates tend to be mean-reverting over time, so the differences between growth in real USD global GDP and more conventional measures of global GDP should even out over time. That said, currency trends can last for many years, so the periods where US Dollar-denominated global GDP growth is outperforming/underperforming PPP- and market-weighted global GDP can persist for some time. The strength of the US Dollar effective exchange rate between 2011 and 2020 made growth in the rest of the world appear pretty anaemic from a US perspective. Equally, however, the depreciation of the US Dollar this year vs. 2020 – measured on a year-average basis – is raising the USD value of growth in the rest of the world this year.
Reflecting the weakness of the US Dollar this year vs. its 2020 average, we expect global GDP growth calculated in real USD to outstrip traditional measures of GDP growth in 2021, rising by 8.2% vs. 6.0% using PPP weights. In nominal terms, we expect USD global GDP growth to reach 12.9% this year.
In 2022, we will start publishing global growth forecasts for market-weighted and USD GDP, in parallel with our existing PPP-weighted forecasts.
Kevin Daly, Tadas Gedminas, and Madhvee Bangur*
*Madhvee is an intern in the CEEMEA economics team
  1. 1 ^ In addition to convergence due to growth differentials, the differences between PPP-based weights and market-based weights are now somewhat less than they were in the 2000-2010 period.
  2. 2 ^ To calculate real USD global GDP, the series can be deflated with US CPI. To calculate global GDP denominated in other currencies, the CPI deflator of the relevant currency should be used.
  3. 3 ^ One could go further and match the weights of each country to the country weights of the index. But this would necessitate a different set of weights for each index and many different measures of ‘Global GDP’.

Investors should consider this report as only a single factor in making their investment decision. For Reg AC certification and other important disclosures, see the Disclosure Appendix, or go to www.gs.com/research/hedge.html.