Labor productivity growth disappointed in the decade preceding the pandemic, averaging only ½ -1% in the US, the Euro Area and the UK. We have argued previously that some of this weakness may reflect mismeasurement of the positive impact of new technology. But even leaving aside this issue, we see three signs why the underlying pace of measured productivity growth may now be accelerating.
The first is mean reversion. Growth in both labor productivity and total factor productivity (TFP) appears to have picked up from rock-bottom levels in the later part of the past decade in the US, the UK, and the Euro Area. This is consistent with our finding that TFP growth historically tends to mean-revert slowly over time and suggests that further productivity gains are ahead.
The second is evidence of recent technological acceleration, and potentially the second wave of the IT revolution. Investments in intellectual property products (IPP) had already started to rise before 2020 in the major advanced economies. Looking across US sectors, rapid productivity growth in tech-related service sectors that invest heavily in IPP has driven much of the pickup in US productivity growth since 2016.
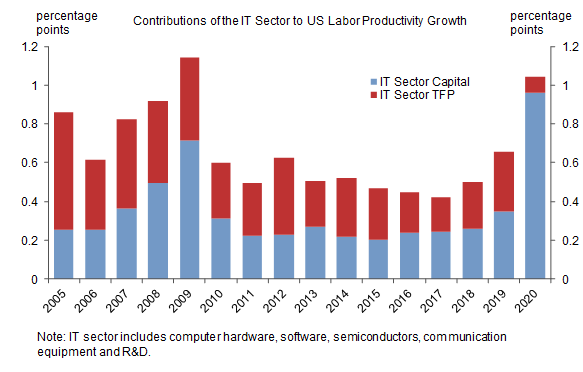
The third is evidence of increased economic dynamism. New business formation and US patent applications have surged since the start of the pandemic, and the measured contribution of the IT sector to US productivity growth has picked up significantly in the recent years.
Technology and the Productivity Rebound
Exhibit 1: Soft Productivity Growth in the Past Decade
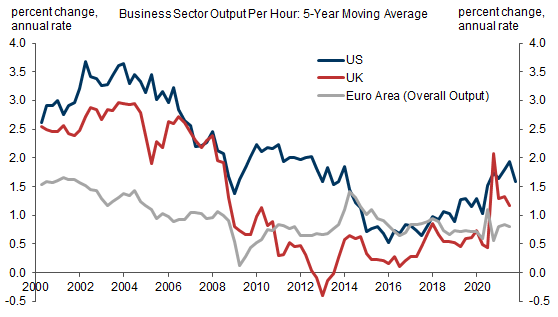
Exhibit 2: Mean Reversion After the Early 2000s Boom, Technology Implementation Lags, And Declining Dynamism Help Explain the Post-GFC Productivity Slowdown
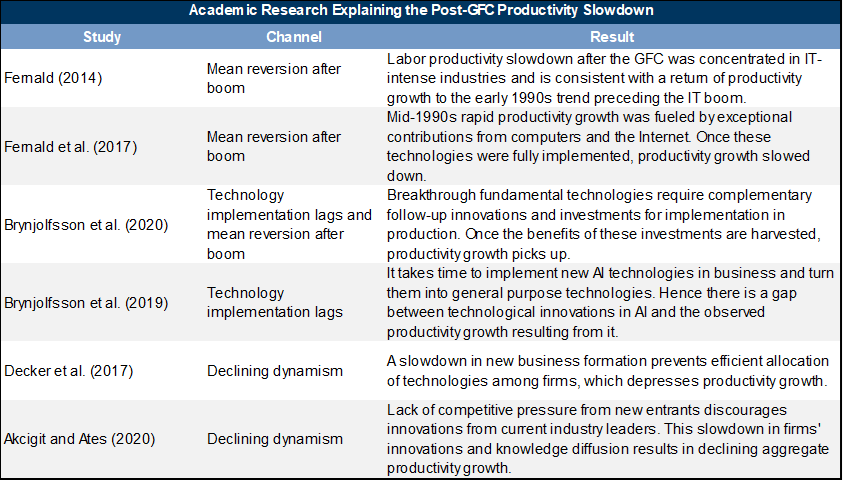
Exhibit 3: TFP Growth Tends to Slowly Mean Revert
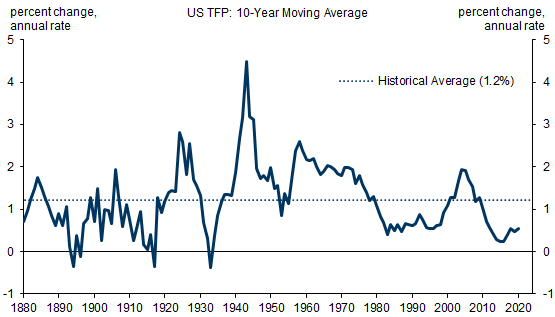
Exhibit 4: A Pickup in Intellectual Property Products Investments
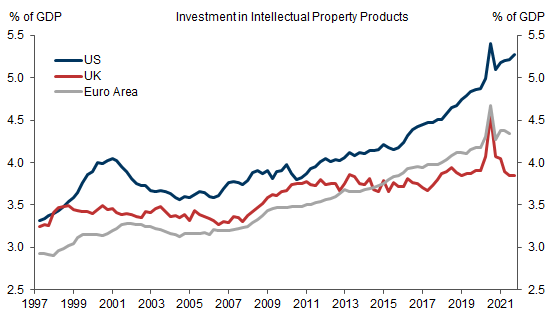
Exhibit 5: A Positive Relationship Between IPP Investment and Productivity Growth Across US Industries
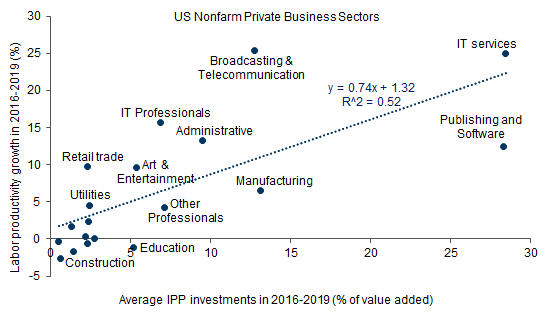
Exhibit 6: The Contribution from Tech-Related Services to US Productivity Growth Has Been Rising

Exhibit 7: A Rise in New Business Formation
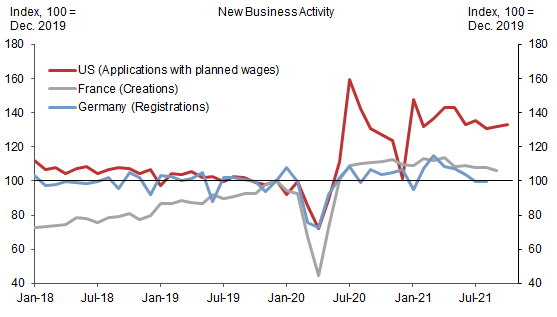
Exhibit 8: A Pandemic Jump in US Patent Applications
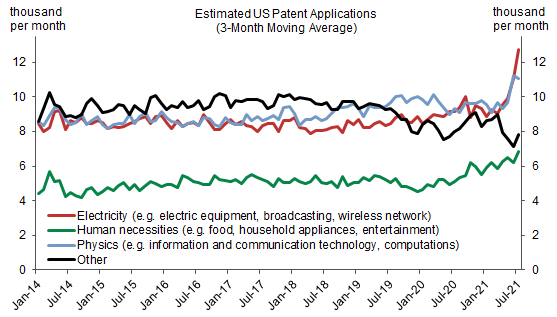
Exhibit 9: A Pandemic Jump in the Contribution of the IT Sector to US Productivity Growth
Appendix
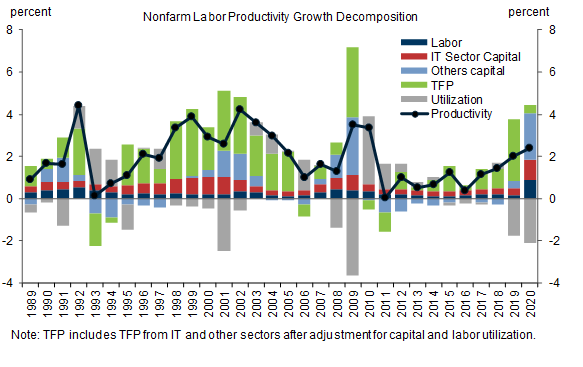
Exhibit A: Decomposition of Labor Productivity Growth in the US
- 1 ^ We estimated that the pace of annual real GDP growth is understated by around 1.0pp. This captures unmeasured nominal output (e.g. tax-haven profit shifting), the value of free digital goods (e.g. social media, search engines), business investment in new types of intangible ICT capital, and the overstatement of consumer inflation (e.g. quality change, outlet bias). See Spencer Hill, “Productivity Paradox v2.0: The Price of Free Goods”, US Economics Analyst, 14 July 2019.
- 2 ^ See Zach Pandl and Daan Struyven, “Historical Context on the Productivity Slump”, US Economics Analyst, 22 April 2016.
- 3 ^ Note that computers and peripheral hardware equipment fall into manufacturing sector.
- 4 ^ The increase in new business applications in the US is fairly broad-based across sectors. For more details on US business dynamism during the pandemic, see Joseph Briggs, "Business Sector Scarring Effects: Damage to the Supply Side Still Looks Modest", US Daily, 24 June 2021.
- 5 ^ See Daron Acemoglu, Ufuk Akcigit, Harun Alp, Nicholas Bloom, and William Kerr. 2018. “Innovation, Reallocation, and Growth”, American Economic Review, 108(101): 3450-3491
- 6 ^ To estimate the net contribution of IT sectors, we follow Byrne, Oliner, and Sichel (2013) and use a variety of GDP-accounting methods to decompose output per hour growth into the contributions of labor quality, capital deepening and TFP (net of utilization and quality adjustments as estimated by the San Francisco Fed). We then distill the contribution of capital deepening and TFP coming from IT sectors using micro data on sector-specific inputs in production. Exhibit A in the Appendix shows the result of this decomposition including the contribution of non-IT related components.
Investors should consider this report as only a single factor in making their investment decision. For Reg AC certification and other important disclosures, see the Disclosure Appendix, or go to www.gs.com/research/hedge.html.