Goldman Sachs Research
US Economics Analyst
Who Pays for Input Cost Increases? Evaluating the Impact on Prices and Profit Margins (Briggs)
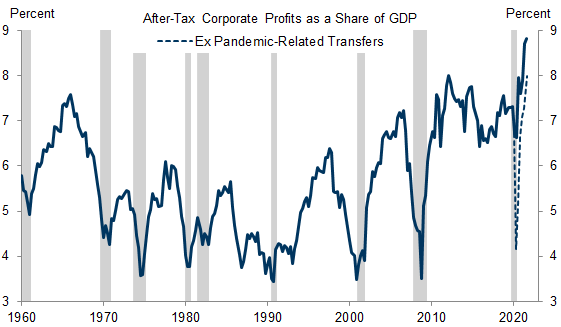
  • Labor and intermediate input costs have risen sharply in 2021, but so far businesses have been able to push through rising labor and input costs and preserve profit margins. In fact, national accounts profit margins reached an all-time high in 2021Q3, and remain at their second-highest level on record even after removing pandemic-related fiscal transfers. Whether profit margins will remain elevated will depend on whether companies can continue to pass higher costs through to prices, so in this US Economics Analyst we review the evidence regarding price pass-through from three sources of cost pressure.

  • First, although rapid wage growth in 2021Q2-Q3 will likely slow as labor shortages ease, we expect that wage growth will remain firmer than at the end of last cycle and average a bit over 4% in 2022-2024. Using a set of industry- and state-level panel regressions, we estimate that a 1pp acceleration in wage growth boosts price inflation by about 35bps and lowers profit margins by about 20bps, although the pass-through rate likely varies over time.

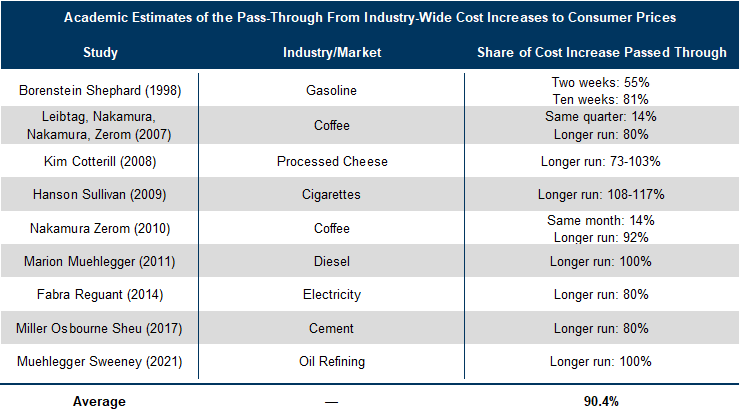
  • Second, upstream costs of intermediate goods and materials have also increased. We find that broad-based input cost increases have historically been mostly passed on to final prices. Rising costs of intermediate goods and materials will therefore likely continue to put upward pressure on consumer prices, but pose less of a threat to profit margins.

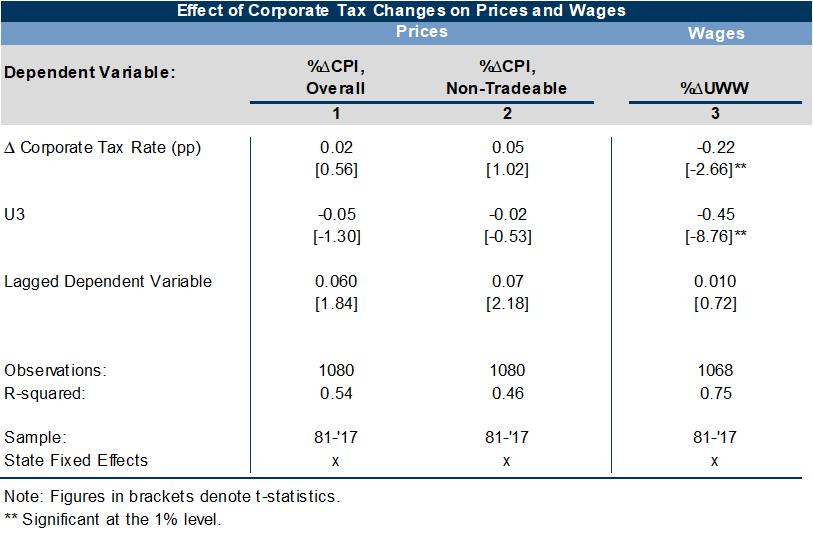
  • Third, the coming reconciliation bill will likely increase corporate taxes, and academic studies suggest that the incidence of corporate tax increases falls roughly evenly on consumers, workers, and businesses. We therefore expect modest inflation and margin pressures from corporate tax increases, although the ultimate effect will depend on the details of the upcoming legislation.

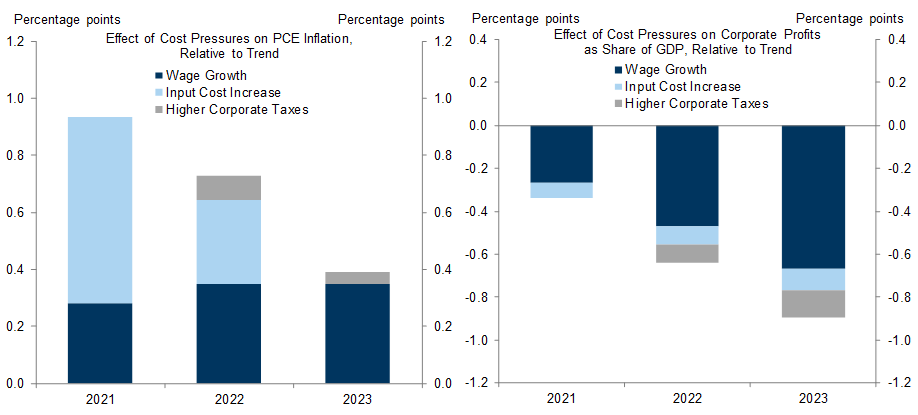
  • Based on our pass-through estimates, we expect that rising costs will boost price inflation in 2021 by around 0.9pp relative to trend, and that the inflationary pressure will ease sequentially to 0.7pp in 2022 and 0.4pp in 2023. Additionally, we estimate that cost pressures will lower national accounts profit margins by around 0.3pp in 2021, 0.6pp in 2022, and 0.9pp in 2023, with the hit to margins mostly reflecting higher labor costs, since most other cost increases will ultimately be passed through to consumers.

Who Pays for Input Cost Increases? Evaluating the Impact on Prices and Profit Margins

Widespread labor shortages and supply chain disruptions have generated significant cost pressures for businesses in 2021. In particular, wage growth accelerated sharply in 2021Q2 and 2021Q3 to a 5-6% annualized pace and our composition-adjusted wage tracker currently stands at 4% (left chart, Exhibit 1)—well above last cycle’s 3% peak—while costs for non-labor intermediate inputs have similarly surged to very high levels for both manufacturing and service-providing firms (right chart).

Exhibit 1: Labor and Input Costs Rose Sharply in 2021...

1. Labor and Input Costs Rose Sharply in 2021.... Data available on request.
Source: Goldman Sachs Global Investment Research
While labor and intermediate-goods supply shortages will likely improve going forward, forward-looking cost measures suggest that business cost pressures are likely to remain firm. For example, our wage survey leading indicator—which summarizes responses to ten survey questions on wage and income growth expectations from consumer and business surveys—currently stands at 4% (left chart, Exhibit 2), again well above last cycle’s peak. Similarly, business survey expectations of non-labor input costs are well above historical norms (right chart), suggesting that most businesses expect that supply shortages and input price pressures will take some time to normalize.

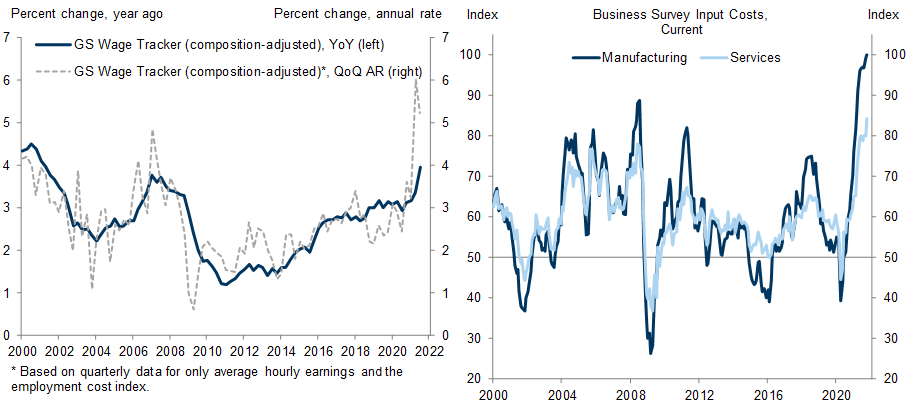
Exhibit 2: … And Are Expected to Rise Further

2. … And Are Expected to Rise Further. Data available on request.
Source: NFIB, Goldman Sachs Global Investment Research
So far, businesses appear to have been able to push through rising labor and input costs and preserve their bottom line. S&P 500 profit margins outperformed expectations in 2021Q3 and currently stand at 12.3% (vs. 11% prior to the pandemic), with company commentary from Q3 earnings calls suggesting that companies were able to leverage pricing power to pass price increases on to consumers. Additionally, our GS Company Price Announcement Index—which measures the share of comments mentioning higher prices vs. the share of comments mentioning lower prices in Russell 3000 earnings calls—reached an all-time high following Q3 earnings data.
It is not just large companies that are reporting strong profit margins. Profit margins in the national accounts soared to an all-time high in 2021Q2 and 2021Q3 (Exhibit 3), and although these margins are somewhat inflated due to residual paycheck protection loans and other business support programs from the Phase 4 and 5 pandemic-relief fiscal packages, profit margins in Q3 were the second highest on record even after excluding pandemic-related fiscal transfers.

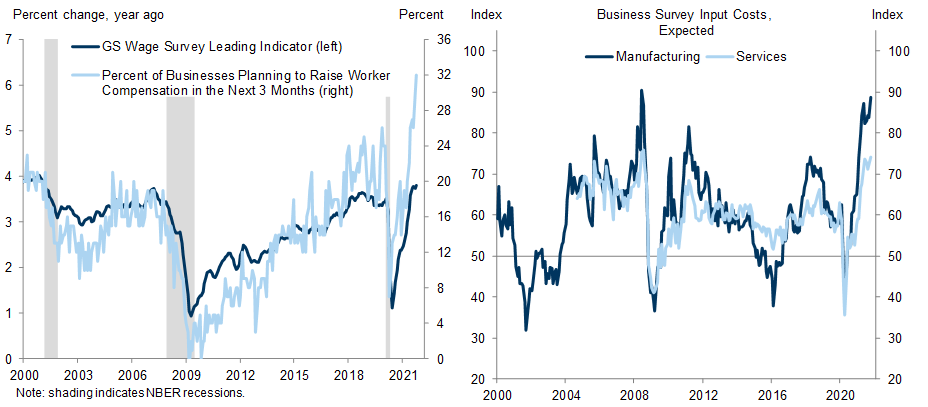
Exhibit 3: Profit Margins Have Risen to a Record High, and Remain Firm Even After Accounting for Pandemic-Related Fiscal Transfers

3. Profit Margins Have Risen to a Record High, and Remain Firm Even After Accounting for Pandemic-Related Fiscal Transfers. Data available on request.
Source: US Bureau of Economic Analysis (BEA), Goldman Sachs Global Investment Research
Whether profit margins remain elevated—and whether price inflation cools—will depend partly on whether companies can continue to pass higher costs through to prices. Q3 earning calls suggest that many companies maintain a strong margins outlook and anticipate they will remain able to do so. However, it’s less clear whether companies will be able to actually maintain current margin levels as normal economic dynamics assert themselves in the coming years, or if businesses will be forced to absorb a larger share of cost increases.
In this US Economics Analyst we therefore examine evidence regarding price pass-through from three sources of cost pressures—higher labor costs, higher intermediate input prices, and higher corporate tax rates—and their implications for profit margins and price inflation going forward.

The Effect of Rising Labor Costs on Prices

The first cost pressure we consider is rising labor costs. Although the acute wage pressures seen in 2021Q2-Q3 will likely ease as labor shortages improve, we forecast that wage growth will remain firmer than at the end of last cycle and average a bit over 4% in 2022-2024, which is a main reason we expect that inflation will settle moderately above 2% this cycle, above the pace seen last cycle and in line with the Fed’s goal under its new framework.
This view assumes that companies pass along some share of their costs along to consumers at a rate roughly consistent with our rule of thumb that a 1pp boost to wage inflation provides a roughly 40bp boost to price inflation over two years. Since compensation of employees totals roughly 55% of GDP, this pass-through rate implies that producers typically absorb some of the cost increase, which lowers margins as a share of GDP by about 0.2pp.
Although it’s intuitive that rising labor costs would lead to higher final prices, a sizable literature examining whether wage growth causes price inflation has reached mixed conclusions, largely because wages and prices are typically simultaneously determined, and because there is a limited amount of relevant aggregate data since inflation became anchored at around 2% in the late 1990s.
For a more convincing estimate of the wage-to-price pass-through, we update our prior analysis of a much larger industry-level dataset. We regress the growth rate of an industry’s output deflator on the growth rate of either its average weekly wage, unit labor costs, or a smoothed proxy for unit labor costs that divides weekly wages by trend productivity. As shown in the left panel of Exhibit 4, we find strong evidence that wage growth does partly pass through to price inflation.
To provide further evidence on the wage-to-price pass-through, we also conduct a similar set of state-level panel regressions using new state-level price indices constructed from the BLS’s underlying price microdata by Emi Nakamura, Jón Steinsson, and coauthors (right panel).[1] These analyses also suggest a very significant, albeit slightly smaller, effect of wage growth on price inflation.

Exhibit 4: Industry- and State-Level Panel Data Show Strong Evidence that Wage Growth Affects Price Inflation

4. Industry- and State-Level Panel Data Show Strong Evidence that Wage Growth Affects Price Inflation. Data available on request.
Source: Goldman Sachs Global Investment Research
In Exhibit 5 we summarize the key takeaway from these analyses, including the estimated effect on one-year-ahead price growth, as well as the results from our prior simulations of the FRB/US model. All estimates suggest that a 1pp acceleration in wage growth implies a roughly 0.2-0.4pp acceleration in price inflation after two years, and averaging across estimates suggests around a 35bp cumulative boost, a similar estimate to our standard rule of thumb.

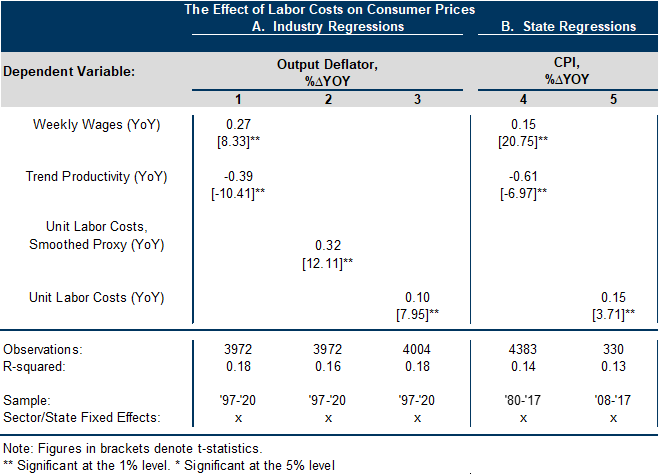
Exhibit 5: Averaging Across Estimates Suggests That a 1pp Increase in Wage Inflation Boosts Price Inflation by About 35bps Over Two Years

5. Averaging Across Estimates Suggests That a 1pp Increase in Wage Inflation Boosts Price Inflation by About 35bps Over Two Years. Data available on request.
Source: Goldman Sachs Global Investment Research
One caveat in applying our analysis is that the pass-through from wages to prices has likely not been constant over time. Exhibit 6 compares the coefficient from a set of rolling regressions of unit labor costs on PCE inflation, which suggest that wage-price-pass-through was much higher in the 70s and 80s, but has moderated since inflation expectations stabilized in the late-1990s. This pattern suggests that the pass-through from wages to prices may be higher in inflationary periods, although the direction of causality is of course hard to determine.

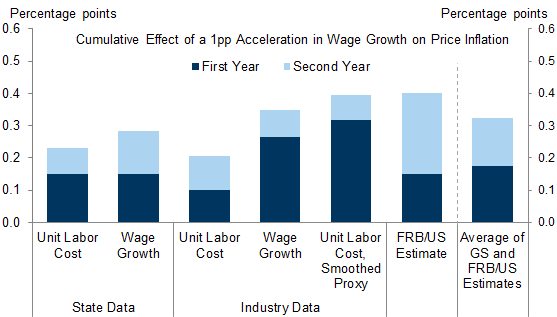
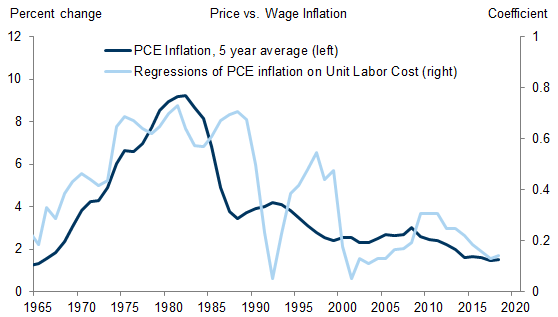
Exhibit 6: Wage-To-Price Pass-Through Has Varied Over Time

6. Wage-To-Price Pass-Through Has Varied Over Time. Data available on request.
Source: Bureau of Economic Analysis, Goldman Sachs Global Investment Research

The Effect of Intermediate Input Costs on Prices

A second cost pressure is rising upstream goods and materials prices. Official price data confirms the rising input costs reported in business surveys (Exhibit 1). For example, the national accounts intermediate inputs price index has risen by over 7% since the start of the pandemic, and the most recent PPI report shows an ever sharper rise, with prices of input goods excluding food and energy for final demand producers increasing by 15% since the start of the pandemic.
Identifying the price effects from intermediate-goods cost increases poses an arguably greater empirical challenge than identifying the price effects from wage growth, since in addition to being simultaneously determined, the pass-through from input costs depends critically on the market structure and the type of shock considered.
The current input cost increases are fairly broad-based and likely affect most firms within a given industry. We therefore turn to an academic literature that evaluates the effect of industry-wide cost shocks on prices to evaluate the likely pass-through rates. As shown in Exhibit 7, these studies suggest that on average over 90% of upstream goods and material cost increases are passed through to final prices after 1-2 years.

Exhibit 7: Academic Research Suggests That Industry-Wide Input Price Increases for Intermediate Goods and Inputs Are Mostly Passed Through to Prices

7. Academic Research Suggests That Industry-Wide Input Price Increases for Intermediate Goods and Inputs Are Mostly Passed Through to Prices. Data available on request.
Source: Goldman Sachs Global Investment Research
Applying a 90% pass-through rate to the yoy increase in prices of input goods excluding food and energy for final demand producers (+7pp annual average in 2021 vs. trend) and multiplying by a 10% input share suggests around 65bps in upward pressure on price inflation in 2021, and repeating this exercise for 2022 (assuming input prices remain at current level going forward) suggests a cumulative boost to the price level of just under 1pp. In contrast, the cost-burden for corporations implied by this pass-through rate implies roughly a 0.1pp reduction in profit margins as a share of GDP. Rising costs of intermediate goods and materials will therefore likely put upward pressure on prices, but pose less of a threat to corporate profits.

The Incidence of Corporate Tax Increases

A final potential source of pressure on profit margins is that the coming reconciliation bill will likely increase corporate taxes. Although the amount and structure of corporate tax increases included in the final bill will likely change before passing the Senate, corporate taxes seem set to increase, and the average US company would pay around one-fifth more in federal corporate taxes than they otherwise would under current legislative proposals, although the overall tax burden would increase by slightly less.
A number of academic studies on the incidence of corporate tax increases use changes in state-level corporate rates to evaluate the pass-through to labor costs, and generally find that about a third of corporate tax increases are passed through to workers. The most compelling empirical evidence comes from a recent academic study that links point-of-sale price-scanner data, the location of each items’ producer, and state-specific tax rate changes to estimate that the incidence of corporate tax increases on consumers, workers and shareholders is 31%, 38% and 31%, respectively (Exhibit 8).[2]

Exhibit 8: Academic Research Suggests that Consumers, Workers, and Business Profits All Bear the Cost of Corporate Tax Increases

8. Academic Research Suggests that Consumers, Workers, and Business Profits All Bear the Cost of Corporate Tax Increases. Data available on request.
Source: Goldman Sachs Global Investment Research
In Exhibit 9 we check these findings using a set of state-level panel regressions using the same price and wage data from Exhibit 4, but also using state-level corporate tax rate changes. In the left panel, we find that corporate tax increases are associated with an acceleration in price inflation and that the effect is larger for non-tradeable output with locally set prices, although the effect is not statistically significant in either regression. In the right panel, we find that increases in state-level corporate tax rates are associated with statistically-significant negative effects on wage growth.

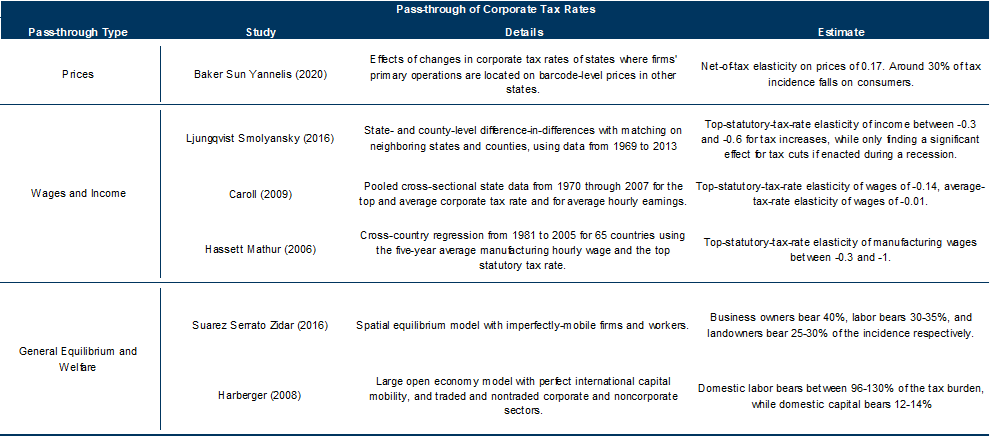
Exhibit 9: State-Level Panel Regressions Imply a Statistically Significant Decline in Wages and a Statistically Insignificant Increase in Consumer Prices Following an Increase in State Corporate Tax Rates

9. State-Level Panel Regressions Imply a Statistically Significant Decline in Wages and a Statistically Insignificant Increase in Consumer Prices Following an Increase in State Corporate Tax Rates. Data available on request.
Source: Goldman Sachs Global Investment Research
Our estimates are broadly consistent with the aforementioned academic studies, and therefore support the view that the incidence of corporate tax increases falls roughly evenly on consumers, workers, and corporate shareholders. Under this assumption, the proposed tax increases would result in about a 2% reduction in profits or around 15bps of margin compression in the national accounts, although—as recently noted by our portfolio strategy team—the hit to profits among S&P 500 and other large firms would likely be a bit larger due to their larger exposure to the proposed tax hikes.

Adding Up the Effects on Prices and Margins

Exhibit 10 combines the pass-through rates for wage growth, input costs, and corporate tax changes with our wage growth forecast, observed changes to goods and material excluding food and energy prices in 2020 and 2021, and our expected tax increases to estimate the impact on price inflation and profit margins.
In the left chart, we estimate that cost pressures have boosted inflation by around 0.9pp in 2021 relative to trend,[3] although the boost will ease sequentially to 0.7pp in 2022 and 0.4pp in 2023. Furthermore, our analysis suggests that pass-through from input cost increases and firmer wage growth are both contributing to near-term inflation pressures, but firmer wage growth will account for most of the remaining pressure in 2023.
In the right chart, we estimate that cost pressures will lower national accounts profit margins by around 0.3pp in 2021, 0.6pp in 2022, and 0.9pp in 2023, with the hit to margins mostly reflecting labor cost increases, since most other cost increases will ultimately be passed through to prices. Our finding that rising labor costs present the biggest threat to profit margins suggests that profits for larger public companies will outperform the broader corporate sector due to lower exposure to labor costs, and is consistent with the view from our portfolio strategy team that companies with greater exposure to rising wage bills will underperform in 2022.

Exhibit 10: We Estimate Cost Pressures Will Boost Inflation Relative to Trend by 0.9pp/0.7pp/0.4pp and Lower Profit Margins by 0.3pp/0.6pp/0.9pp in 2021-2023

10. We Estimate Cost Pressures Will Boost Inflation Relative to Trend by 0.9pp/0.7pp/0.4pp and Lower Profit Margins by 0.3pp/0.6pp/0.9pp in 2021-2023. Data available on request.
Source: Goldman Sachs Global Investment Research

Joseph Briggs

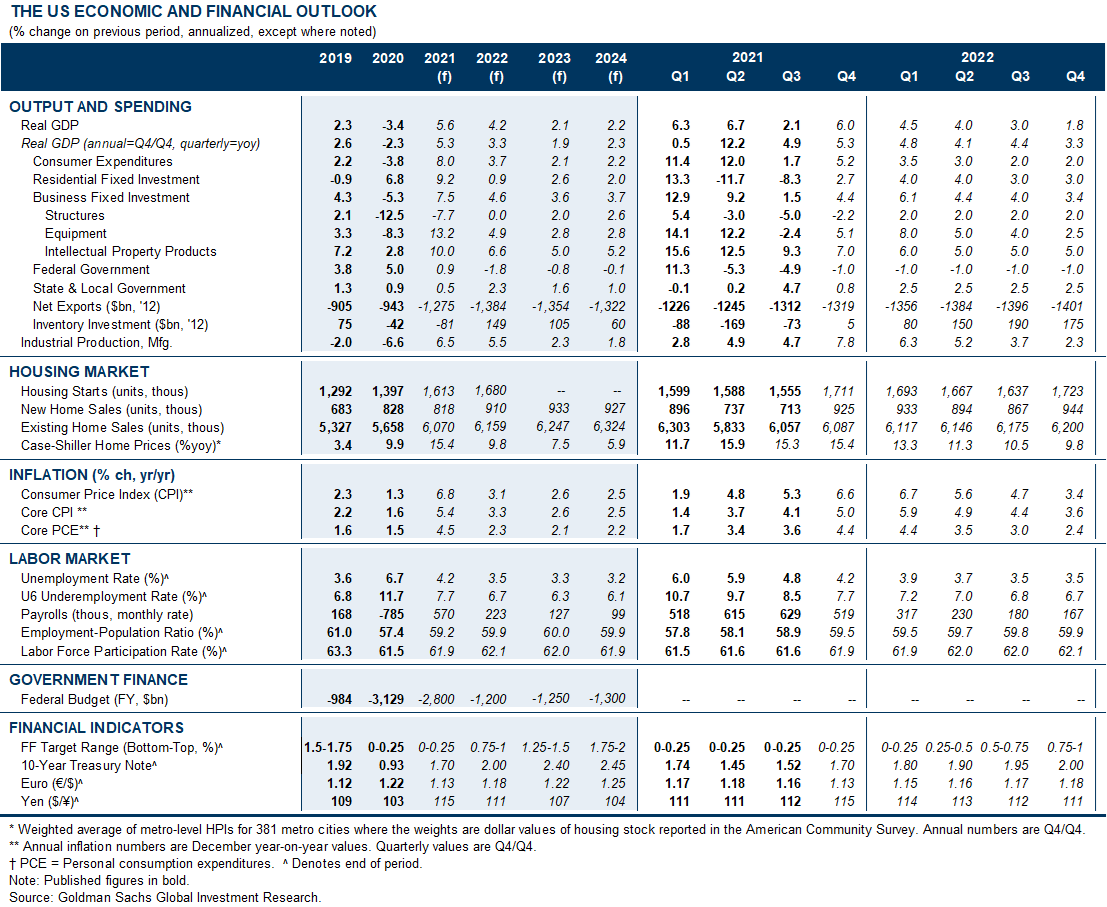
The US Economic and Financial Outlook
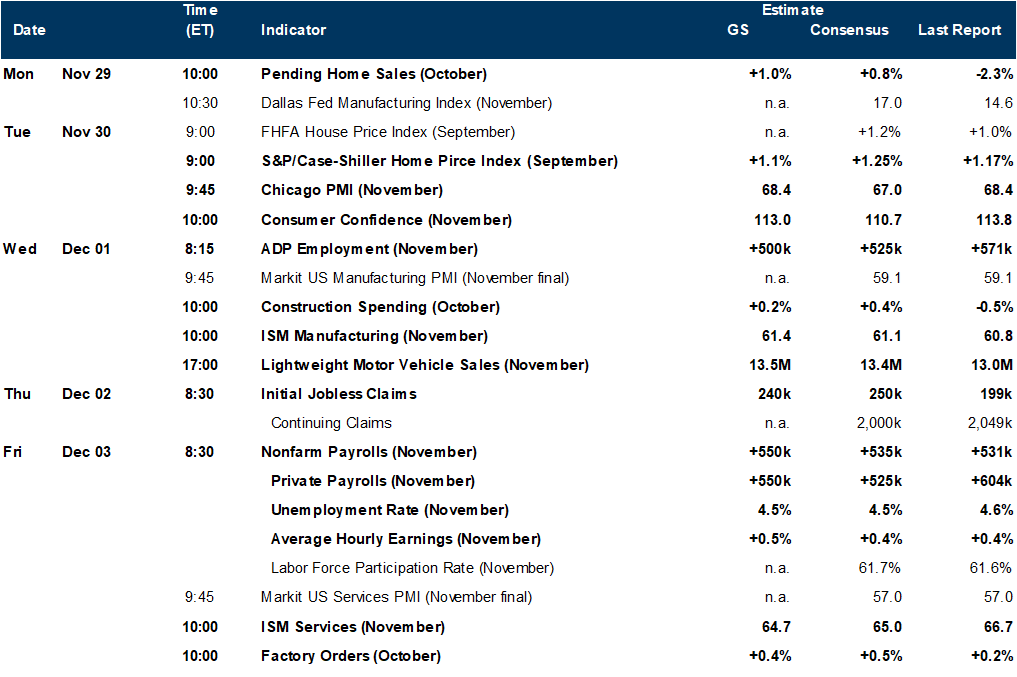
Data available on request.
Source: Goldman Sachs Global Investment Research

Economic Releases

Data available on request.
Source: Goldman Sachs Global Investment Research
  1. 1 ^ Hazell, J., Herreno, J., Nakamura, E. and Steinsson, J., 2020. The slope of the Phillips Curve: evidence from US states (No. w28005). National Bureau of Economic Research.
  2. 2 ^ Baker, Scott R., Stephen Teng Sun, and Constantine Yannelis. “Corporate taxes and retail prices”. No. w27058. National Bureau of Economic Research, 2020.
  3. 3 ^ Our price growth trend assumes 3% wage growth, 2% growth in intermediate input prices, and no change in corporate tax rates.

Investors should consider this report as only a single factor in making their investment decision. For Reg AC certification and other important disclosures, see the Disclosure Appendix, or go to www.gs.com/research/hedge.html.