Goldman Sachs Research
Global Economics Analyst
Why Is US Labor Supply So Low? (Milo/Struyven)
  • After making no progress for more than a year, the US participation rate finally edged up in November. Using a cross-country sample, we estimate the relative contributions of fiscal support, labor market policies, and virus fears to the 1½pp US participation rate decline from its 2019Q4 level.

  • First, we attribute about one-half of the US labor force participation rate shortfall to generous fiscal support, which likely discouraged labor supply. More broadly, the participation rate has generally underperformed in economies with large increases in household liquidity. The most notable case in point is Chile, where the participation rate declined by 5pp as fiscal support and pension withdrawals flooded households with liquidity.

  • Second, we attribute about a third of the US participation shortfall to the form in which fiscal support was delivered, through generous unemployment benefits instead of job retention schemes. Such schemes kept workers attached to their employers in most of the OECD despite similarly large declines in hours worked. Finally, we estimate that the remaining one-sixth of the US participation rate shortfall reflects the labor market response to virus fears, which have likely discouraged people from returning to work. This is a smaller share than suggested by simple survey measures. The reason for the difference is that our cross-country model finds that fiscal policy factors are an even better explanation of the pattern of participation underperformance than virus fears.

  • A few major caveats are worth noting. First, our results are based on a relatively small sample of 38 countries. Second, data availability constrains how precisely we can measure the drivers of participation. Third, our simple model does not capture variables that we cannot measure consistently and have likely also weighed on US participation, such as large wealth increases.

  • With these caveats in mind, we expect the US participation rate to rise by ½ pp to 62.2% by end-2022. We expect a diminishing fiscal drag on participation as savings are run down, and find that the statistical importance of job retention schemes and virus fears for participation is declining. However, we expect the participation rate to remain structurally below its pre-pandemic trend, as job losses have triggered permanent labor force exits, especially for older workers.

Why Is US Labor Supply So Low? (Milo/Struyven)[1]

After making no progress for more than a year, the US participation rate finally edged up in November to 61.8%. However, the participation rate has recovered significantly less in the US than in the Euro Area and Canada (Exhibit 1, left panel). The weakness of US labor supply, alongside the strength in demand, is also an important driver of higher US wage pressures (right panel).

Exhibit 1: Weak US Labor Force Participation Has Fueled Wage Pressures

1. Weak US Labor Force Participation Has Fueled Wage Pressures. Data available on request.
Our US wage tracker is composition adjusted.
Source: OECD, Goldman Sachs Global Investment Research
Exhibit 2 shows that the participation rate has declined more since 2019Q4 in the US than in most other peer economies, except for Germany, and several Latin American economies. Why has the US participation rate underperformed? To answer this question, we estimate a simple model that explains cross-country differences in the change in the participation rate since the start of the pandemic through 2021Q2, providing an international perspective on our analysis of the US participation rate.

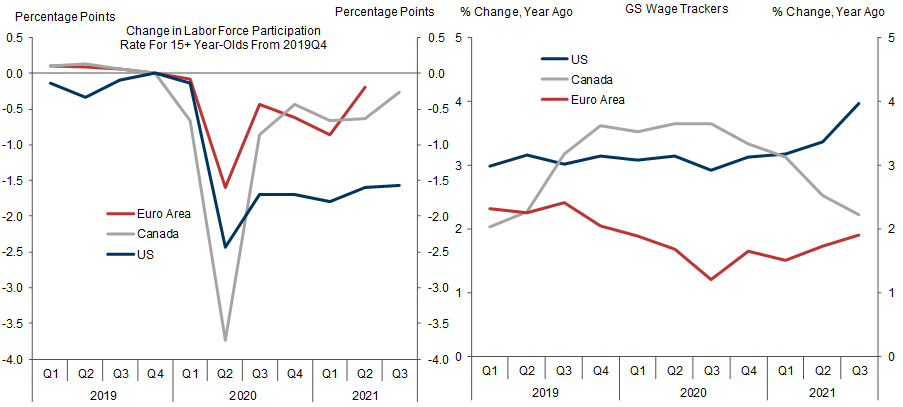
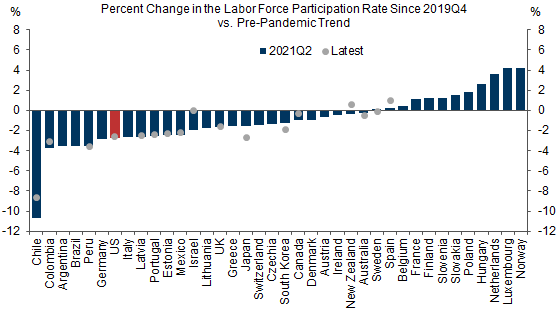
Exhibit 2: The Labor Force Participation Rate Has Declined More in the US Than in Most Other Peers

2. The Labor Force Participation Rate Has Declined More in the US Than in Most Other Peers. Data available on request.
Pre-pandemic trend is a linear trend estimated from 2015-2019.
Source: OECD, Haver Analytics, Goldman Sachs Global Investment Research
We test three hypotheses for the weakness in US labor supply: the discouragement effect from generous fiscal support, the form in which fiscal support was delivered through generous unemployment benefits instead of job retention schemes, and the impact of virus fears. We first explain how we measure these factors, then present the model and its implications for the US, and conclude by putting our estimates in the context of our earlier findings and the economics literature.

Measuring and Modeling Drivers

We start by creating consistent measures of fiscal support, retention scheme usage, and virus fears.
We first define fiscal support as cumulative on-budget fiscal measures in response to the pandemic from the IMF Fiscal Monitor, capturing both additional spending and foregone revenue[2] (see Appendix 1). This measure captures fiscal transfers to households such as US stimulus checks and expanded unemployment benefits, and spending on businesses. It excludes spending through automatic stabilizers, which is largely captured by our retention scheme measure.
We next proxy for the usage of retention schemes—which effectively keep workers employed under reduced or sometimes zero weekly working hours—by comparing the change in hours worked to the change in employment.[3] Specifically, we define the retention scheme proxy as the percent difference between the actual employment change in 2020 and the employment change predicted using the 2020 change in hours and the OECD employment-hours relationship (Appendix 2). Intuitively, our proxy has a positive relationship with the peak share of the workforce on retention schemes in Europe, where actual usage data are available (Appendix 3).
Finally, we construct a measure of the sensitivity of labor markets to virus outbreaks. Specifically, we regress Google workplace mobility data on excess fatalities to capture workers’ fear of in person work.[4]
We next estimate the impact of fiscal support, retention schemes, and the labor market sensitivity to the virus on the participation rate. Specifically, we regress the percent change in the labor force participation rate since 2019Q4 (net of the pre-pandemic trend) on our three measures, as well as 2020 GDP growth (to control for aggregate demand). Exhibit 3 shows that the three factors are statistically significant at the 90% level with a positive impact on the participation rate from retention schemes, and negative effects of fiscal support and labor market sensitivity to the virus. The model explains about one-third of the cross-country variation, and better explains variation across regions than within regions (Exhibit 4).

Exhibit 3: Retention Schemes Boost Participation While Fiscal Support and Virus Fears Weigh on Participation

3. Retention Schemes Boost Participation While Fiscal Support and Virus Fears Weigh on Participation. Data available on request.
Source: Goldman Sachs Global Investment Research

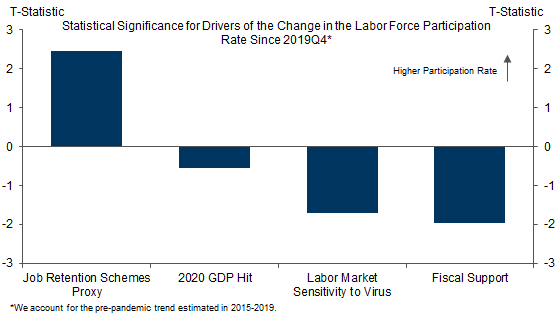
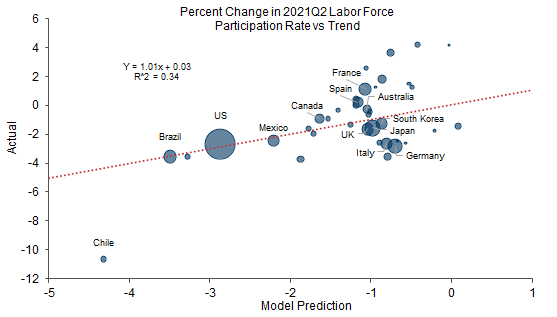
Exhibit 4: The Model Helps Explain Higher Participation Rates in Europe Than in the US and Latin America

4. The Model Helps Explain Higher Participation Rates in Europe Than in the US and Latin America. Data available on request.
Source: Goldman Sachs Global Investment Research

Explaining US Underperformance

Using this model, Exhibit 5 decomposes the decline in the US participation rate since the start of the pandemic. We attribute about one-half of the US weakness to generous fiscal support, about a third to the decision to replace labor income with unemployment benefits instead of job retention schemes, and roughly one-sixth to virus fears.

Exhibit 5: Strong Fiscal Support, A Lack of Job Retention Schemes, and the Sensitivity of the Labor Market to Virus Fears Help Explain the Weakness in the US Participation Rate

5. Strong Fiscal Support, A Lack of Job Retention Schemes, and the Sensitivity of the Labor Market to Virus Fears Help Explain the Weakness in the US Participation Rate. Data available on request.
Source: Goldman Sachs Global Investment Research
We next put these estimates in the context of earlier findings from our US economics team and the economics literature, and discuss policy implications. Our simple model generally attributes a larger share of the US participation shortfall to fiscal factors than other studies, and a smaller share to virus fears.
Fiscal support. Cash transfers can weigh on labor supply by allowing individuals with limited savings to maintain consumption while working less. Studies using pre-pandemic data[5] estimate sizeable effects of cash transfers on labor supply, especially for lower income workers,[6] who were mostly targeted by US fiscal support. Using the pre-pandemic relationship between transfers and participation, researchers at the Federal Reserve Bank of Richmond estimate that fiscal support explains at least one-fifth of the shortfall in the US employment-population ratio in August 2021.
Our model attributes a greater share of the US participation shortfall to fiscal support, suggesting that the impact of transfers on participation may have grown during the pandemic. This larger estimate reflects that the participation rate has generally underperformed in economies with strong fiscal support and large increases in household liquidity. This pattern is most notable in Chile. Fiscal transfers to households and especially early pension fund withdrawals flooded Chilean households with liquidity, sharply outweighing reduced earnings (Exhibit 6, left panel). Chile’s participation rate remains 5pp below its 2019 level, despite very elevated labor demand (right panel).

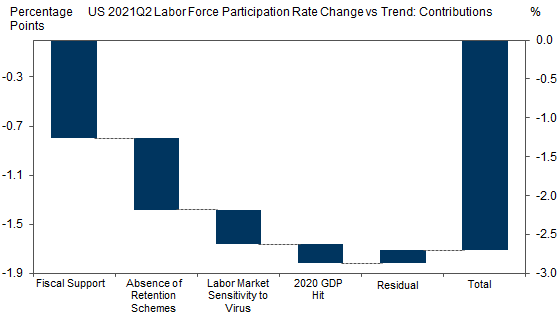
Exhibit 6: Large Transfers to Households Likely Contributed to Persistent Weakness in Chile’s Participation Rate

6. Large Transfers to Households Likely Contributed to Persistent Weakness in Chile’s Participation Rate. Data available on request.
Source: Banco Central de Chile, Haver Analytics, Goldman Sachs Global Investment Research
To be clear, the likely negative effect of fiscal transfers on the mid-2021 US participation rate does not necessarily mean that those transfer policies had a negative impact on the economy. In general, income replacement likely prevented negative second-round effects, and the time not spent working has likely been especially valuable during the pandemic in light of medical risks and increased caretaking needs.
Retention schemes. Job retention schemes kept workers attached to their employers in most of the OECD despite similarly large declines in hours worked. Meanwhile, the US extended its unemployment benefit system, which we estimate lowered the job-finding probability of unemployed workers. Exhibit 7 illustrates the effect of retention schemes for the US and the Euro Area. The pandemic fall in total hours worked was entirely driven by the employment drop in the US (left panel), while it was mostly driven by a reduction in the average workweek in the Euro Area (right panel). Our cross-country analysis attributes one-third of the US participation shortfall to having replaced labor income with unemployment benefits rather with retention schemes.

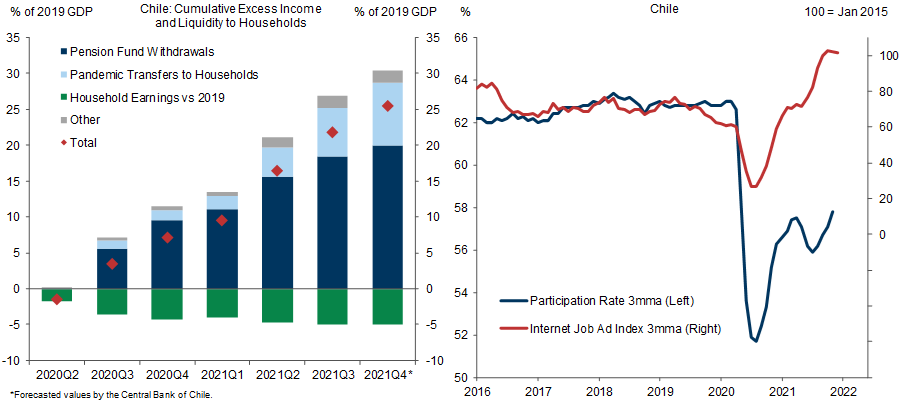
Exhibit 7: Last Year the US Cut Employment Significantly, While the Euro Area Mostly Reduced Hours

7. Last Year the US Cut Employment Significantly, While the Euro Area Mostly Reduced Hours. Data available on request.
Source: Haver Analytics, Goldman Sachs Global Investment Research
The net impact on the economy’s productive capacity from these different labor market policy choices is ambiguous. On the one hand, the European-style system that is more focused on job preservation likely preserved many valuable worker-employer relationships, and may have limited the hit to the participation rate, especially for older workers for whom job changes are difficult. On the other hand, US labor market policies may have boosted labor productivity. Less productive jobs were likely disproportionally eliminated in the US, and many US workers likely switched to new and potentially more productive jobs.[7]
Virus fears. Our simple model attributes the remaining one-sixth of the US participation rate shortfall to the labor market response to virus fears, which have likely discouraged people to return to work. This is a significantly smaller share than suggested by simple survey measures, which suggest that virus fears account for most of the participation shortfall, illustrated in Exhibit 8. The reason for the difference is that, in a cross-country context, our model finds that fiscal policy factors are an even better explanation of the pattern of participation underperformance and fiscal outperformance than virus fears.

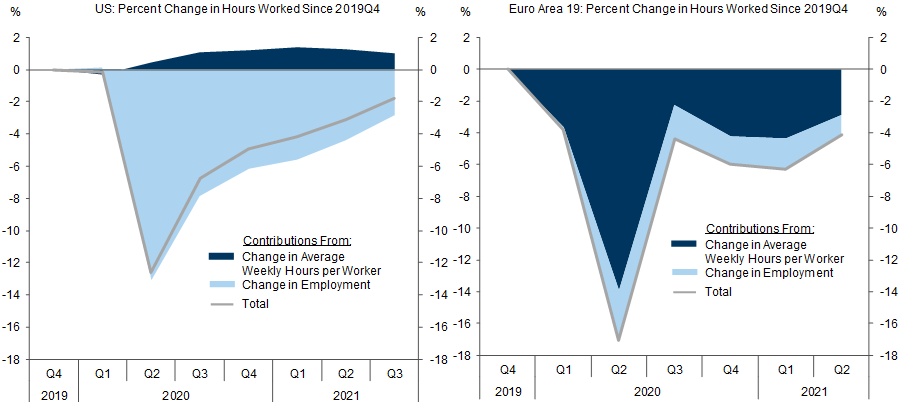
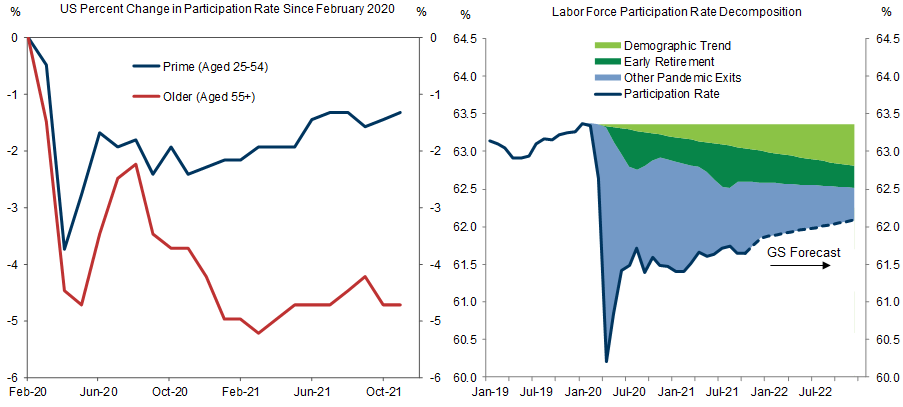
Exhibit 8: The US Participation Rate Has Partly Rebounded While Virus Fears Have Diminished

8. The US Participation Rate Has Partly Rebounded While Virus Fears Have Diminished . Data available on request.
Source: Haver Analytics, Goldman Sachs Global Investment Research

A Partial Participation Rebound Ahead

A few major caveats are worth noting.
First, our results are based on a relatively small sample of 38 countries, mostly in Western Europe. Second, data availability constrains how precisely we can measure the drivers of participation. Third, our simple model does not capture global and country-specific variables that we cannot measure consistently. For instance, disproportionally large US wealth increases—separate from fiscal transfers—have likely also weighed on US participation, reflecting for instance, larger US home price gains, greater participation of US households in the equity market, or a stronger link between US retirement accounts and equity prices.[8] Country-specific factors, such as Quota 100—which encouraged early retirements in Italy—, various programs in France to encourage youth participation, and the elimination of low-paid marginal jobs in Germany likely also account for some of the cross-country variation. That being said, our findings are robust to various robustness checks (see Appendix 4).
With these caveats in mind, we expect the US participation rate to rise by ½ pp to 62.2% by end-2022. We expect a diminishing fiscal drag on participation as excess savings are gradually and partially depleted. Consistent with additional US improvements, we also find that the statistical importance of job retention schemes and the labor market sensitivity to the virus for participation is gradually declining over time (Exhibit 9). Differences in labor market policies have also shrunk, with the expiration of extended unemployment benefits in the US, and of furlough schemes in the UK, for example.[9]

Exhibit 9: The Statistical Significance of Job Retention Schemes and Virus Effects to Explain Labor Force Participation Has Declined Over Time

9. The Statistical Significance of Job Retention Schemes and Virus Effects to Explain Labor Force Participation Has Declined Over Time. Data available on request.
We use the absolute value of the T-statistic.
Source: Goldman Sachs Global Investment Research
However, we do expect the US participation rate to remain structurally below its pre-pandemic trend, as job losses have likely triggered permanent exits from the labor force, especially among workers near retirement age (Exhibit 10).
Our finding of a semi-structural decline in the participation rate and this forecast of only a partial rebound in US labor supply support our view that sequential US wage growth will moderate to just over 4%, stronger than last cycle but consistent with the Fed’s inflation goal.
Dan Milo
Daan Struyven

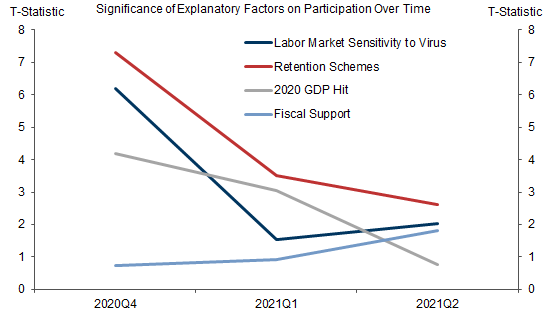
Exhibit 10: A Partial Rebound in the US Participation Rate

10. A Partial Rebound in the US Participation Rate. Data available on request.
Source: Haver Analytics, Goldman Sachs Global Investment Research

Appendix

Exhibit 11: Our Fiscal Measure

11. Our Fiscal Measure. Data available on request.
We designate half of pension fund withdrawals through 2021Q2 in Chile as fiscal support as the government changes the rules allowing households to tap into to their pension funds.
Source: IMF, Goldman Sachs Global Investment Research

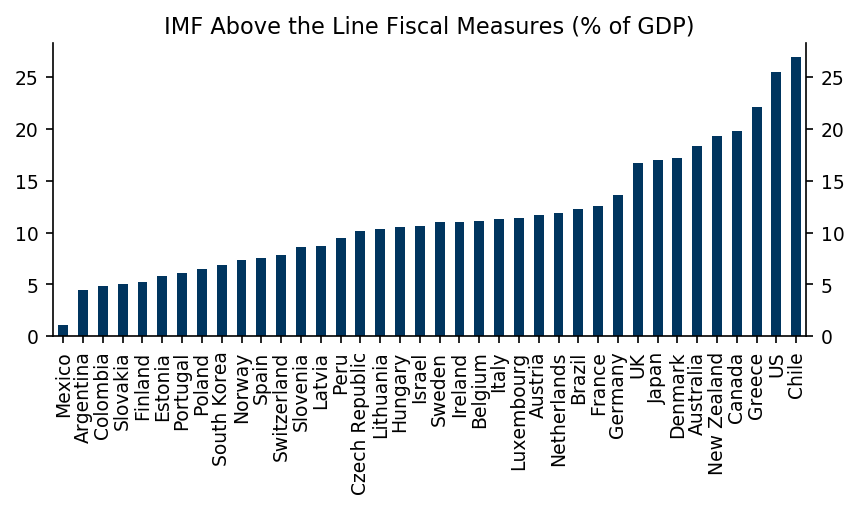
Exhibit 12: We Proxy for Retention Schemes Using the Change in Employment Not Predicted by the Change in Hours

12. We Proxy for Retention Schemes Using the Change in Employment Not Predicted by the Change in Hours. Data available on request.

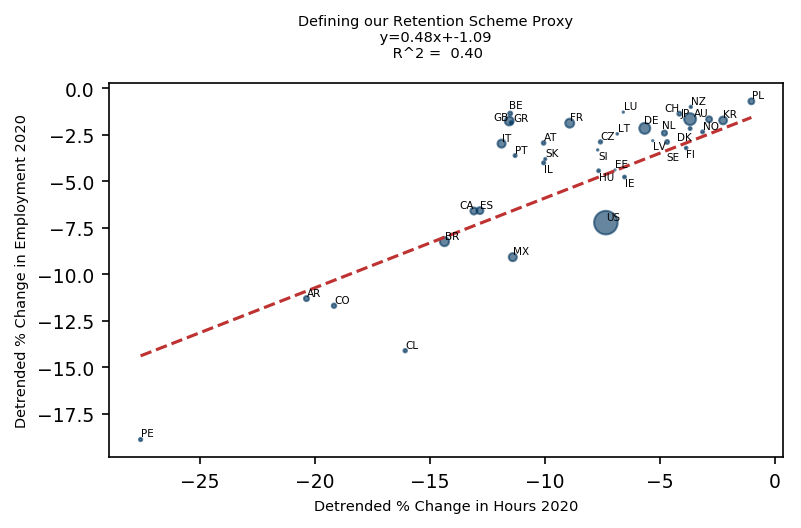
Exhibit 13: Our Proxy for Retention Schemes Is Positively Correlated With Actual Usage

13. Our Proxy for Retention Schemes Is Positively Correlated With Actual Usage. Data available on request.
Source: Goldman Sachs Global Investment Research

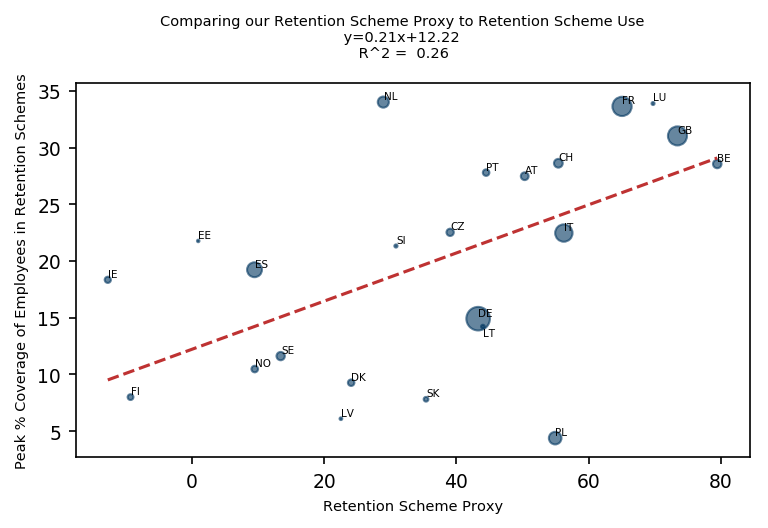
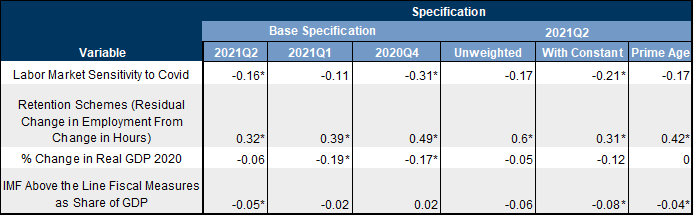
Exhibit 14: Our Findings Are Quite Robust Across Specifications

14. Our Findings Are Quite Robust Across Specifications. Data available on request.
Source: Goldman Sachs Global Investment Research
  1. 1 ^ We thank the US, Europe, Latin America, Asia-Pacific, and CEEMEA economics teams for their contributions to this piece.
  2. 2 ^ We exclude spending/foregone revenue in the health sector.
  3. 3 ^ We also detrend hours worked and employment using the 2015-2019 average.
  4. 4 ^ The proxy does not capture workers who stayed out of the labor force the entire pandemic due to virus fears, and does not distinguish between labor force exit and work from home.
  5. 5 ^ Golosov, Mikhail, et al. “How Americans Respond to Idiosyncratic and Exogenous Changes in Household Wealth and Unearned Income,” No. w29000. National Bureau of Economic Research, 2021.
  6. 6 ^ See Table 2 of Athreya, Kartik, Andrew Owens, and Felipe Schwartzman. "Does redistribution increase output? The centrality of labor supply." Quantitative Economics 8.3 (2017): 761-808.
  7. 7 ^ See Jan Hatzius and Daan Struyven, “A Global Perspective on the US Unemployment Crisis”, Global Economics Analyst, 26 May 2020,
  8. 8 ^ Home price growth was not a statistically significant driver of cross-country changes in the participation rate in our model.
  9. 9 ^ Retention schemes have ended in some economies but not others. The positive effect of retention schemes on participation could diminish further over time if previously furloughed workers exit the labor force. In practice, the share of workers on furlough schemes is now relatively small (e.g. 2% in France), and the UK furlough scheme seems to have ended without significant disruptions.

Investors should consider this report as only a single factor in making their investment decision. For Reg AC certification and other important disclosures, see the Disclosure Appendix, or go to www.gs.com/research/hedge.html.