Inflation trends:
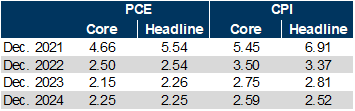
The core PCE price index rose 0.46% month-over-month in November to a new three-decade high of 4.68% year-on-year, and core CPI inflation rose to 4.96%.
Core inflation was again boosted by rapid shelter inflation—which has run at the highest level since 1990 over the last three months—and another jump in the prices of durable goods impacted by temporary shortages.
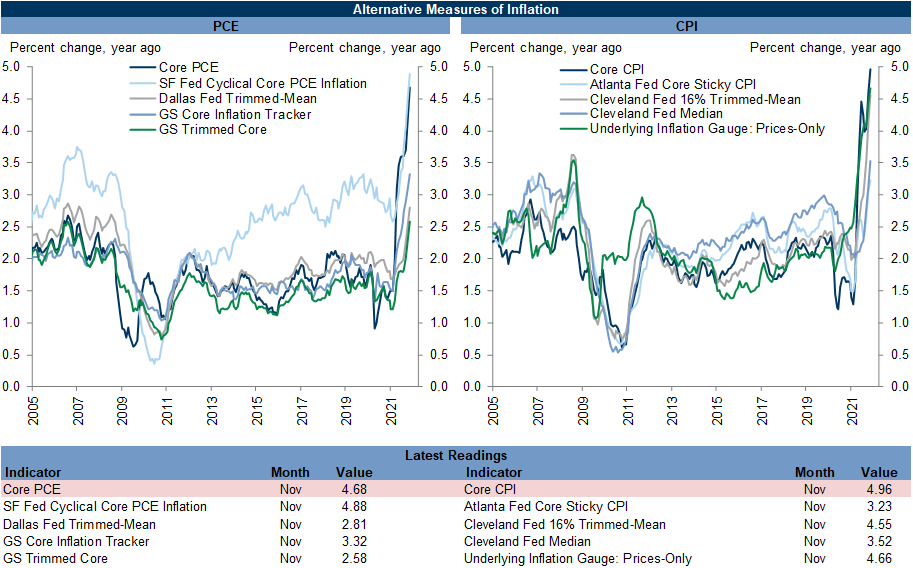
The role of outliers over the last year is illustrated by the gap between core PCE inflation at 4.68% year-on-year and our GS trimmed core PCE at just 2.58% year-on-year. However, the breadth of inflation has continued to increase and our GS trimmed core PCE has run at an annualized pace of 3.84% over the last three months (vs. 4.82% for core PCE).
Component-level trends:
Used cars, hotels, nonprofit services, new cars, furniture, and transportation services are much stronger than usual on a year-on-year basis, boosted by supply constraints and base effects.
Used car auction prices increased 3% to 57% above the pre-pandemic level in the first half of December, which could push consumer prices — which are 56% above the pre-pandemic level — even higher.
Our GS shelter inflation tracker increased to +5.5%, pointing to a pickup in the official shelter series from its current +3.4% year-over-year rate.
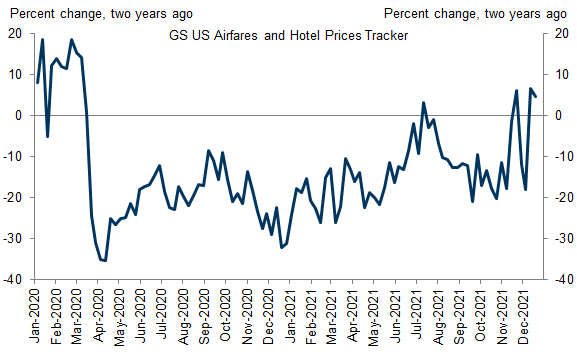
Our high-frequency tracker of hotel prices and airfares has increased to 5% above the 2019 level despite increased virus spread.
Key inflation drivers:
Our GS composition-corrected wage tracker increased to +4.0% year-on-year and our GS wage survey leading indicator stands at +3.7%—each series' highest level since 2007. Our GS low-wage wage tracker increased to +6.8% year-on-year, its highest level in at least three decades.
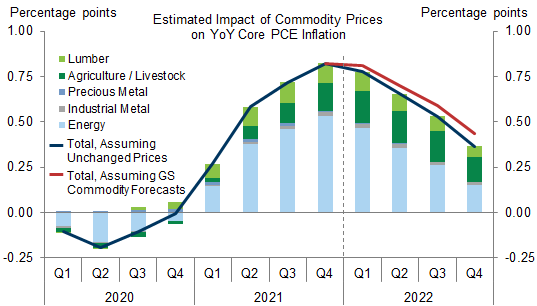
Industrial metals prices ticked up to 151% of the pre-pandemic level and energy prices declined to 124% of the pre-pandemic level. We expect the boost from commodity prices to year-on-year core PCE inflation to decline from a peak of 80bp in 2021Q4 to 35bp by 2022Q4.
Supply chain disruptions:
Supply chain disruptions measured by supplier delivery times and indicators of port congestion remained near record-high levels in December.
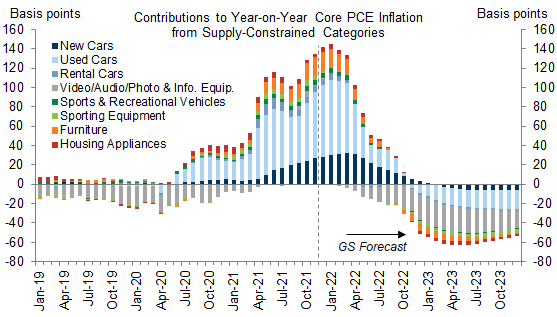
Supply-constrained categories are boosting core PCE inflation by 135bp, and we expect that contribution to grow to 145bp by Jan. 2022 before shrinking to -50bp by end-2022.
Inflation expectations:
Our monthly version of the Fed’s Index of Common Inflation Expectations remained unchanged at 2.09% in December, just below the roughly 2.10% pre-2014 level.
Household inflation expectations declined but remain near multi-year highs. The University of Michigan’s 5-10y measure edged down to 2.9% in December and the NY Fed's 3y measure declined to 4.0% in November. One-year expectations in both surveys remain above 4.5%.
Financial market-implied CPI inflation expectations increased by 35bp on average between 2022 and 2025.
Our composite of seven business inflation expectations series remained near the highest level in its two-decade history.
Our index of company price announcements is at the highest level since our series began in 2010, and mentions of the word "inflation" in last quarter's Russell 3000 earnings calls were the most frequent since at least 2010.
GS inflation forecast:
We expect that ongoing supply chain disruptions will raise the prices of some goods further above the pre-pandemic trend and boost core inflation through early 2022. However, declines in durable goods prices are likely to drive inflation lower by end-2022, more than offsetting a sharp acceleration in shelter inflation.
We forecast core PCE inflation of 2.50% at end-2022, 2.15% at end-2023, and 2.25% at end-2024 based on our bottom-up inflation model.
A top-down model projects that inflation will rise modestly above 2% in 2023-2024.
US Economics Analyst: Could the Inflation Surge Unanchor Inflation Expectations?, December 21
US Daily: What’s Next for Auto Prices?, December 17
US Daily: A Higher Peak for Shelter Inflation, December 13
US Economics Analyst: Who Pays for Input Cost Increases? Evaluating the Impact on Prices and Profit Margins, November 29
US Monthly Inflation Monitor: December 2021
Latest Inflation Trends
Exhibit 1: Core PCE (+4.68% YoY) and Core CPI (+4.96% YoY) Inflation Jumped to New Multi-Decade Highs in November
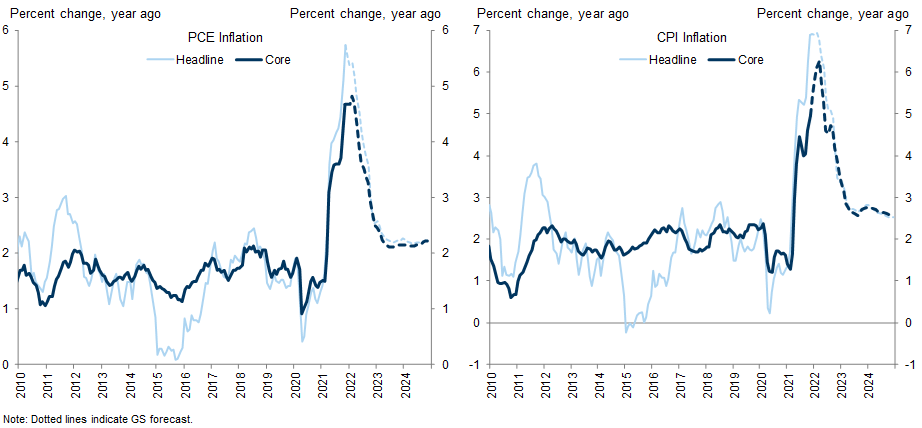
Exhibit 2: Measures of the Underlying Inflation Trend Have Increased Substantially, but Remain Below Core Inflation on Average
Component-Level Trends
Exhibit 3: Motor Vehicles, Nonprofit Services, and Furniture Are Running Stronger Than Usual, Boosted by Pandemic Special Factors; Several Other Categories Are Running Stronger Than Usual Due to Pandemic Base Effects
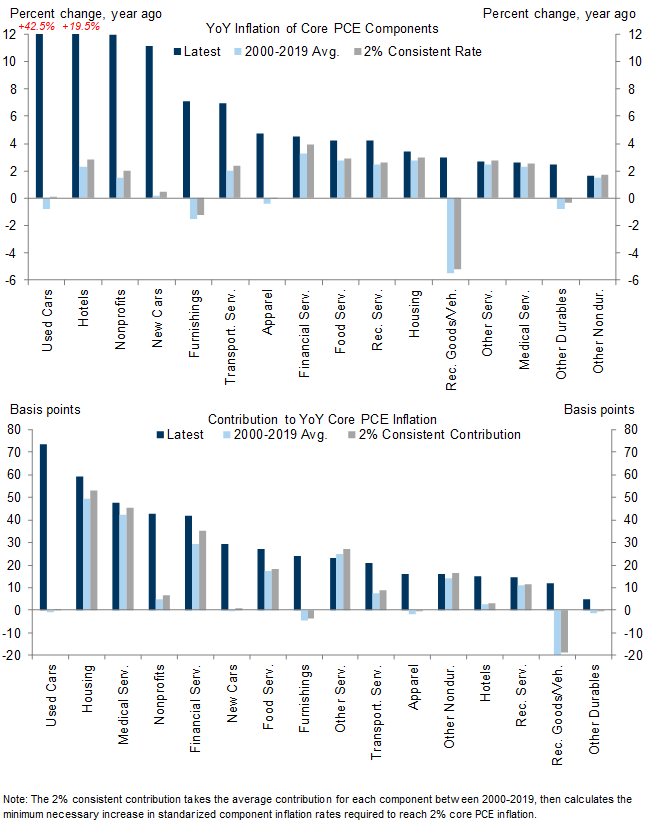
Exhibit 4: Used and New Car Inventories Remained at 50% of the Average 2019 Level in November; Used Car Auction Prices, Which Lead Consumer Prices, Increased 3% in Early December
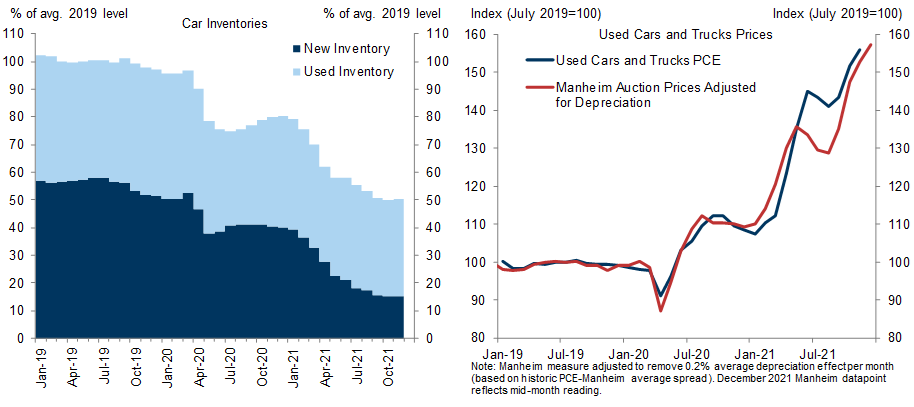
Exhibit 5: Our Shelter Inflation Tracker Increased to +5.5% YoY in a Preliminary November Reading
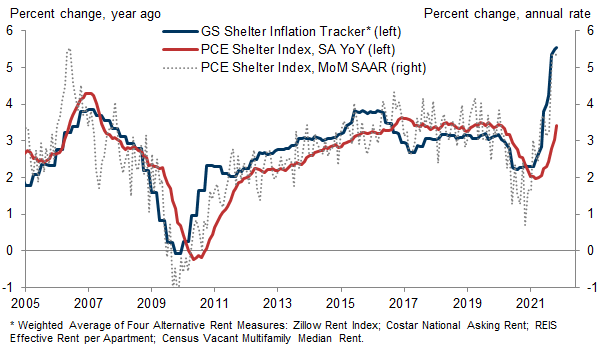
Exhibit 6: Airfares and Hotel Prices Remained 5% Above Their 2019 Levels in Late December
Key Inflation Drivers
Exhibit 7: Our Composition-Adjusted Wage Tracker Increased to +4.0% YoY in Q3, Above Its Pre-Pandemic Pace; Our Wage Survey Leading Indicator Increased to +3.7% in December
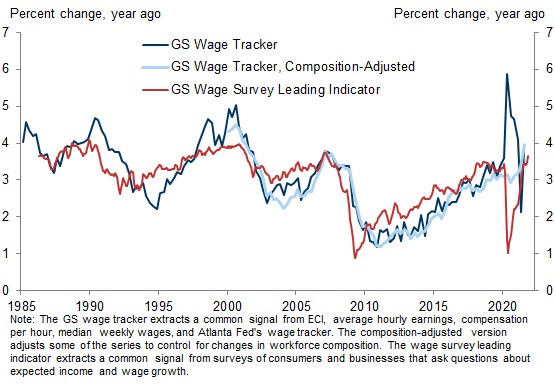
Exhibit 8: Our Low-Wage Wage Growth Tracker Jumped to 6.8% YoY in Q3
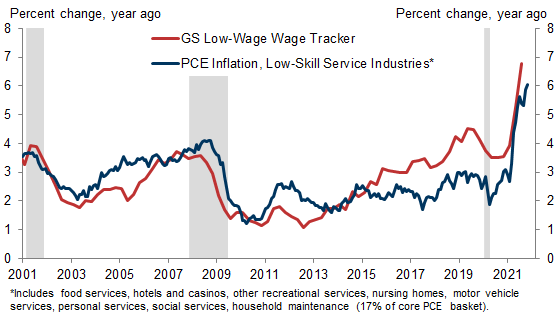
Exhibit 9: Lagged Dollar Weakness Points to a Bit of Further Upward Pressure on Import Prices
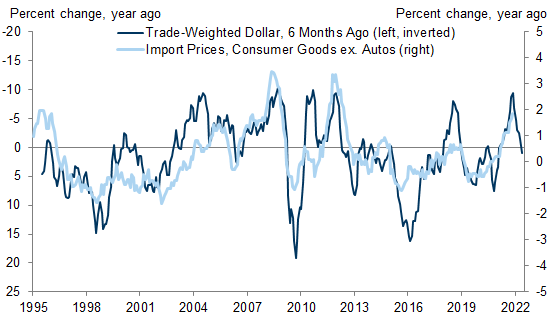
Exhibit 10: Energy Prices Declined to 124% of the Pre-Pandemic Level; Metal Prices Ticked Up to 151% of the Pre-Pandemic Level
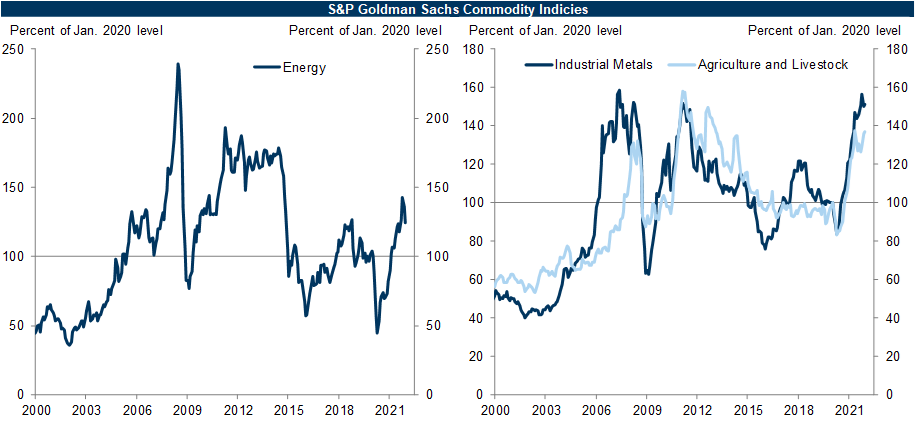
Exhibit 11: We Estimate That the Boost From Commodity Price Increases to Year-on-Year Core PCE Inflation Will Decline From 80bp in 2021Q4 to 35bp in 2022Q4
Supply Chain Disruptions
Exhibit 12: Production Bottlenecks and Supply Chain Disruptions Remain at Extreme Levels
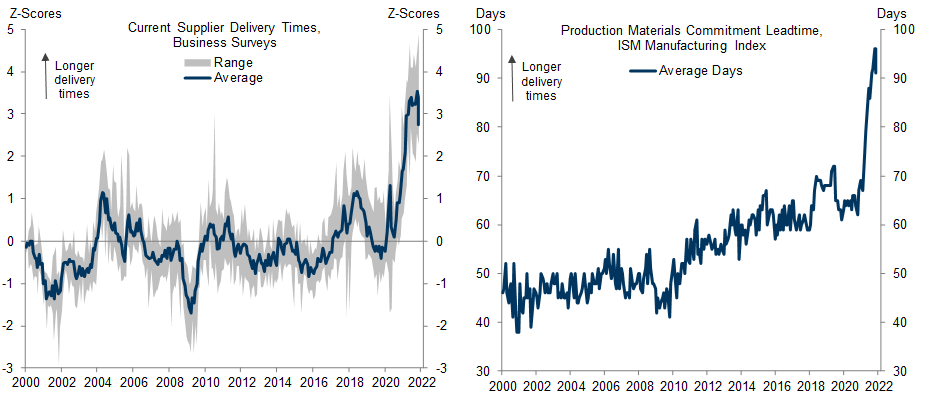
Exhibit 13: The Backlog of Ships at the Ports of Los Angeles and Long Beach Has Grown Over the Last Couple Months
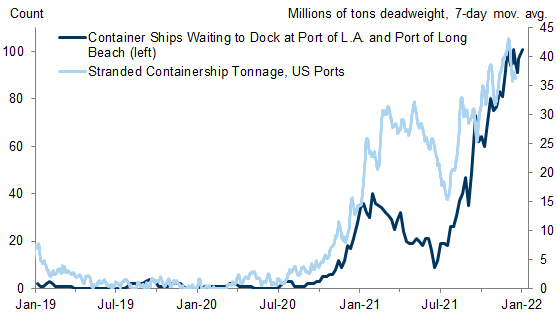
Exhibit 14: US Imports of Semiconductors Are 125% of the Pre-Pandemic Level; Inventories of International Semiconductor Producers Have Increased Recently
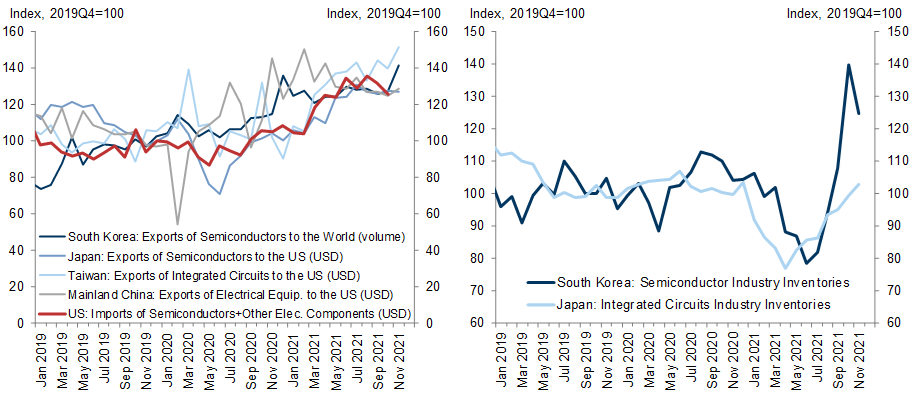
Exhibit 15: However, Imports of Auto-Specific Semiconductors Were 18% Below Pre-Pandemic Levels in October, Limiting Domestic Automotive Production
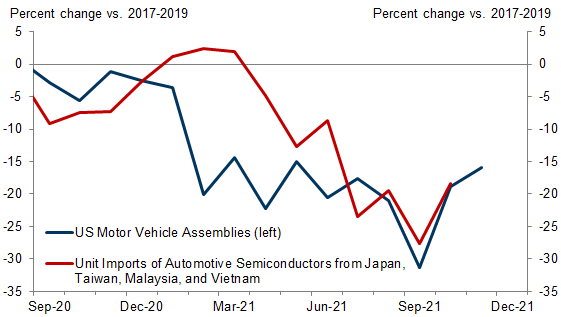
Exhibit 16: We Estimate That the Contribution to Year-on-Year Inflation from Supply-Constrained Categories Will Swing from +135bp Now to +145bp in Jan. 2022 and -50bp at End-2022
Inflation Expectations
Exhibit 17: Our Monthly Version of the Fed’s Index of Common Inflation Expectations Remained Unchanged at 2.09% in December
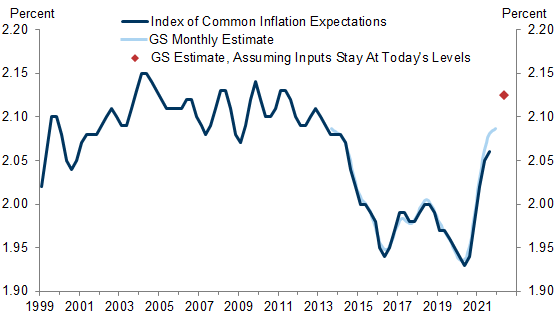
Exhibit 18: Long-Term Household Inflation Expectations Are Near Multi-Year Highs in Both the UMich (+2.9%, Next 5-10yr) and NY Fed Surveys (+4.0%, 3yr Ahead)
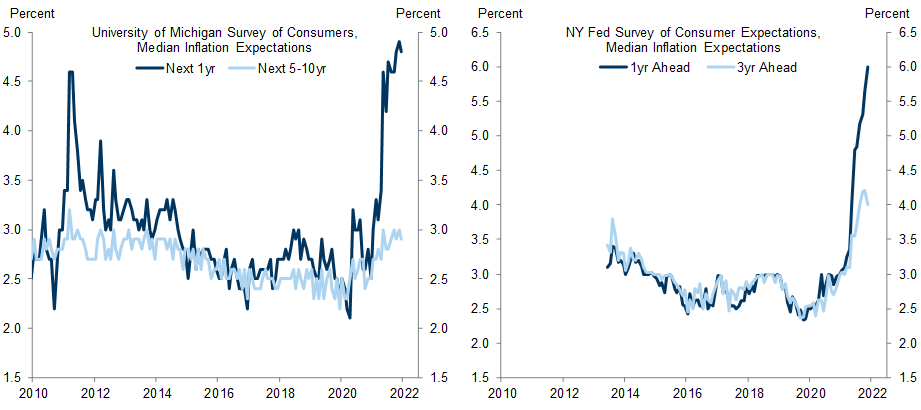
Exhibit 19: Business Inflation Expectations Have Increased to the Highest Level in at Least Two Decades
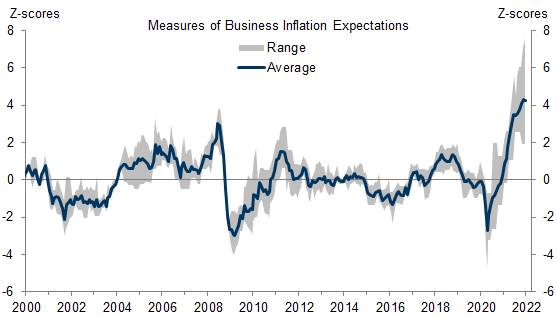
Exhibit 20: Our Company Price Announcement Index Based on Russell 3000 Earnings Calls Is at the Highest Level Since at Least 2010
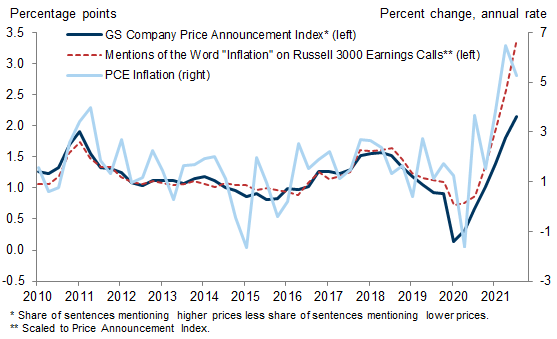
Exhibit 21: Market-Implied Inflation Expectations Have Increased by 35bp on Average Between 2022 and 2025
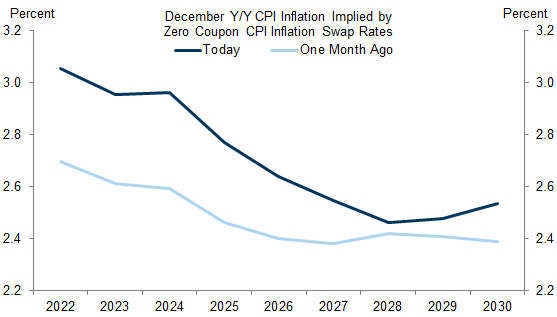
Exhibit 22: Market Pricing Implies a 46% Chance of Headline CPI Inflation Exceeding 3% Over the Next 5 Years

GS Inflation Forecast
Exhibit 23: Our Top-Down Model Predicts Inflation Will Rise Modestly Above 2% In 2023 and 2024 and to Just Below Our Official Forecast
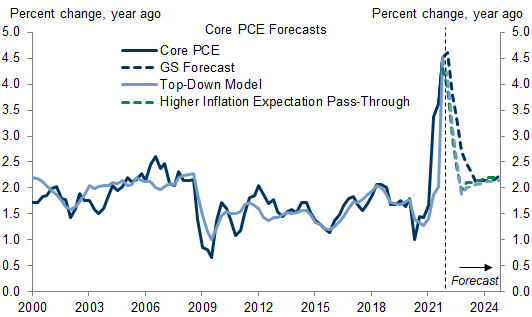
Exhibit 24: We Expect Softer Goods Inflation to Drive Core PCE Down to 2.5% at End-2022
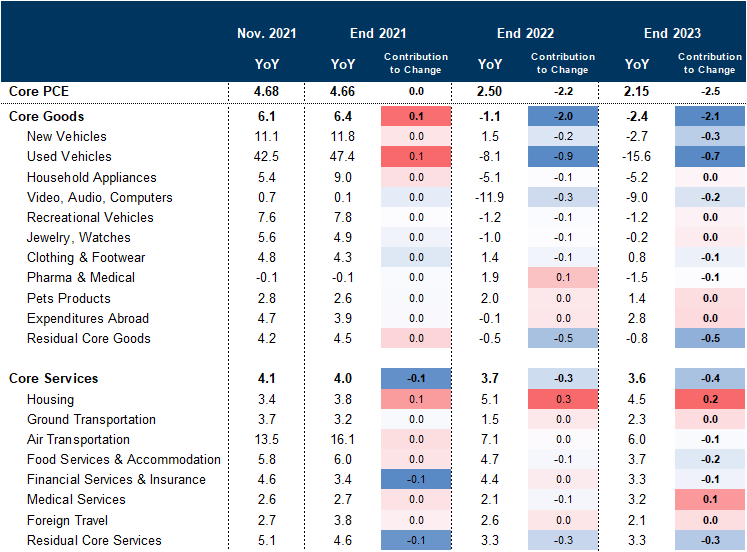
Exhibit 25: GS Inflation Forecasts, 2021-2024
Ronnie Walker
Investors should consider this report as only a single factor in making their investment decision. For Reg AC certification and other important disclosures, see the Disclosure Appendix, or go to www.gs.com/research/hedge.html.