Goldman Sachs Research
US Economics Analyst
Productivity Gains Will Outlast the Pandemic (Hill)
16 January 2022 | 6:36PM EST | Research | Economics| By Jan Hatzius and others
More
  • We continue to expect persistent pandemic-driven efficiency gains, for three reasons: 1) Strong cumulative productivity gains in 2020-21 in both official and alternative metrics, 2) The incidence of these gains within digitizing industries, particularly those where Work-from-Home is effective, and 3) The sheer scale of the changes to the workforce and to company business models since 2019.

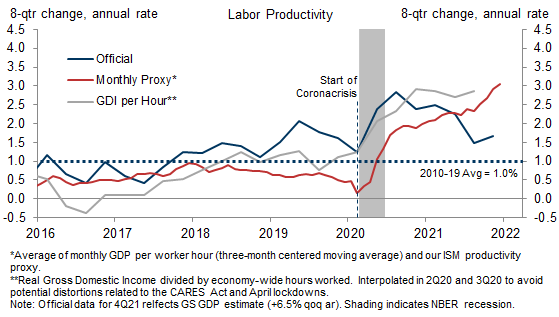
  • Productivity in the nonfarm business sector has increased at a 1.7% annualized pace over the last two years—compared to the +1.0% trend pre-pandemic. GDP data are often revised around recessions, and both our ISM productivity proxy and Gross Domestic Income per hour suggest an annualized pace closer to +3% over this period.

  • We also find that the incidence of productivity gains is skewed towards industries ripe for digitization, such as IT services (+11.9% annualized productivity growth since 4Q19) and professional services (+5.5%). Additionally, we find that Work-from-Home adoption and the scope for labor automation correlate positively with productivity acceleration across 54 subindustries—even after controlling for negative pandemic demand shocks.

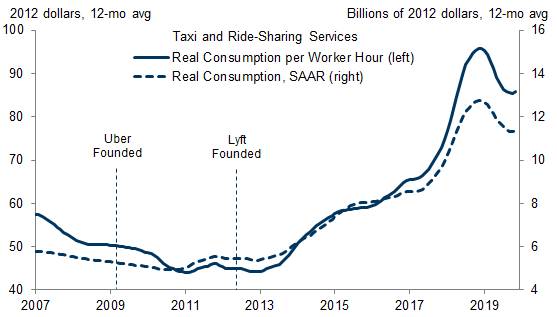
  • The sheer scale of pandemic-driven changes to the workforce and to company business models also argues for a large and long-lasting productivity inflection. These changes include 600 million fewer hours spent commuting every month, as well as possibly 1.4 million fewer cashiers, in-person salespeople, and office maintenance staff. Many of these workers and hours will be reallocated to more productive uses—especially at a time of labor shortages and near-record job vacancies. We also estimate around $900bn worth of home offices and $300bn of consumer IT equipment is now available for business-sector use. This echoes the output and productivity boom in the ride-sharing industry during the 2010s, when Uber and Lyft successfully monetized the household capital stock of cars.

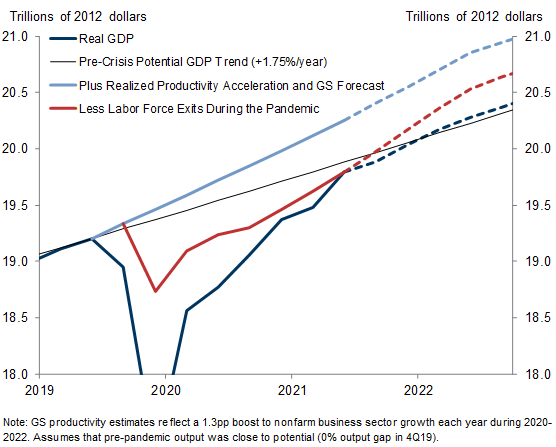
  • Incorporating these four baseline estimates into a top-down production function of the economy, we estimate a persistent boost to the level of private-sector productivity of 3-4% (or 1.0-1.3pp per year during 2020-22). We expect these efficiency gains to offset the decline in labor supply caused by the pandemic, in turn implying a longer runway for expansion. They also support our forecast of a more normal inflation environment in the medium-term once pandemic dislocations begin to recede.

Productivity Gains Will Outlast the Pandemic

Year-on-year productivity growth slowed sharply in Q3 (from +1.9% to -0.6%), but we continue to expect pandemic-driven efficiency gains to persist into the next business cycle, for three reasons: 1) Strong cumulative productivity gains since 4Q19 across both official and alternative metrics, 2) The incidence of these gains within Work-from-Home-friendly and digitizing industries, and 3) The sheer scale of the changes to the workforce and to company business models. In this edition of the Analyst, we discuss each argument in turn, then conclude with the implications for the medium-term growth and inflation outlook.

Crisis-to-Date Productivity Trends

Realized productivity growth remains quite strong cumulatively, with +1.7% annualized growth since 4Q19 in the official measure—real output per hour in the nonfarm business sector (blue line in Exhibit 1). This compares to just under 1% annualized during the last business cycle (2010-2019).

Exhibit 1: The Productivity Trend Has Accelerated by Around 1pp vs. Pre-Pandemic

1. The Productivity Trend Has Accelerated by Around 1pp vs. Pre-Pandemic. Data available on request.
Source: Bureau of Economic Analysis, US Bureau of Labor Statistics, Goldman Sachs Global Investment Research
GDP data is often subject to large revisions—particularly around recessions—and encouragingly, alternate and more timely productivity proxies tell an even more upbeat story. The red line of the same exhibit combines two monthly productivity proxies—monthly GDP per worker hour (+1.9% annualized since 4Q19) and our ISM-implied productivity proxy (+4.2%), which lagged early in the pandemic but now points to larger cumulative gains and stronger momentum entering 2022.
The 2021 outperformance of gross domestic income (GDI) relative to GDP also suggests underlying productivity gains may be larger than officially reported (grey line). Relatedly, we note the possibility that GDP and productivity were temporarily depressed last year by the microchip shortage and other supply chain constraints.

Industry Composition of the Productivity Pickup

This higher level of labor productivity is not the result of pandemic demand shifts away from lower-wage consumer services industries. As shown in Exhibit 2, the industry mix shift within the labor force has mostly unwound, and it accounts for only 0.3pp of the 0.7pp-2pp acceleration in the aggregate productivity trend indicated in Exhibit 1.

Exhibit 2: The Composition Boost from Fewer Hospitality and Retail Workers Has Mostly Unwound

2. The Composition Boost from Fewer Hospitality and Retail Workers Has Mostly Unwound. Data available on request.
Source: Bureau of Economic Analysis, US Bureau of Labor Statistics, Goldman Sachs Global Investment Research
Instead, the GDP by industry data shows strong productivity gains in the office-oriented occupations where workforce changes have been the most pronounced. Exhibit 3 plots real GDP per worker hour for three such industries: information technology services, finance and real estate, and professional services.

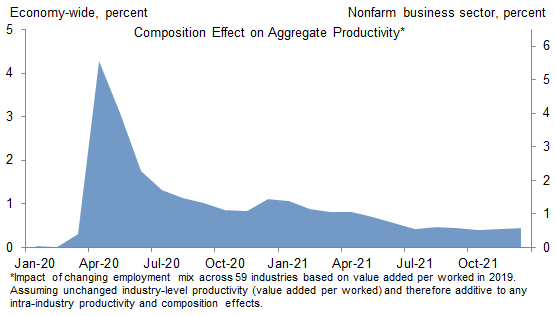
Exhibit 3: The 2020 Productivity Surge in Non-Virus-Sensitive Services Continued During 2021

3. The 2020 Productivity Surge in Non-Virus-Sensitive Services Continued During 2021. Data available on request.
Source: Bureau of Economic Analysis, US Bureau of Labor Statistics, Goldman Sachs Global Investment Research
With work-from-home now more common among office employees and clients alike, some of these gains may reflect the decline in business-sector consumption of intermediate services inputs (see Exhibit 4). As discussed in more detail here, some industries may no longer need to devote the same share of resources to business travel, client entertainment, or office maintenance.

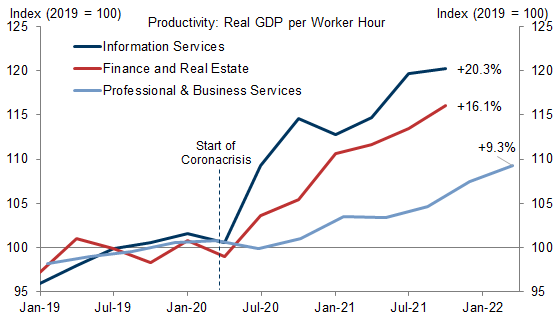
Exhibit 4: If Sustained, Reduced Business-to-Business Spending Productivity-Enhancing in the Medium Term

4. If Sustained, Reduced Business-to-Business Spending Productivity-Enhancing in the Medium Term. Data available on request.
Source: Bureau of Economic Analysis, Goldman Sachs Global Investment Research
While 2021 data is not yet available, the annual decline in 2020 across six such business services categories totals 1pp worth of GDP. Intermediate inputs are not counted as GDP, and if these services are instead consumed by consumers—or if the resources used to produce them are themselves reallocated—GDP and productivity levels would rise by a similar magnitude (+1%). [1]
The productivity cross-section discussed above reveals losers as well as winners, with several notable laggards across virus-sensitive services: retail -3.2% annualized since 4Q19, leisure and hospitality -3.2%, other services/personal care -4.4%; see Exhibit 5[2]. While not reflected in our baseline estimates, we note scope for a post-pandemic reversal in some of these productivity declines as demand returns to normal and business models continue to evolve.

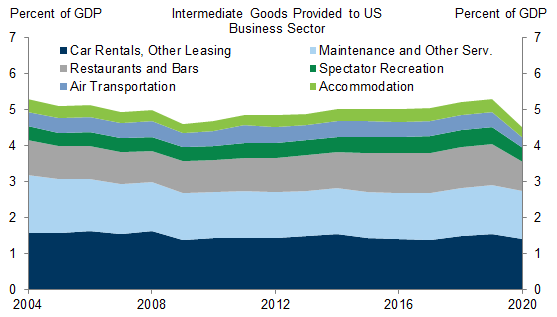
Exhibit 5: Productivity Gains Skewed Towards Industries Ripe for Digitization; Scope for Post-Pandemic Rebound in Virus-Sensitive Categories

5. Productivity Gains Skewed Towards Industries Ripe for Digitization; Scope for Post-Pandemic Rebound in Virus-Sensitive Categories. Data available on request.
Source: Bureau of Economic Analysis, US Bureau of Labor Statistics, Goldman Sachs Global Investment Research

The Post-Pandemic Workforce

The scale of post-pandemic workforce changes—specifically those related to Work-from-Home, the digitization of the workplace, and the monetization of the household capital stock—is large enough to significantly and permanently boost productivity, in our view.
The prevalence of remote positions – including flexible workforce arrangements that involve in 2-3 days per week in the office—steadily increased in the years leading up to the pandemic (see right panel of Exhibit 6). The remote share peaked at 42% during the April 2020 lockdowns and has oscillated in the 29%-33% range during the subsequent ebbs and flows of the virus.

Exhibit 6: Employees Increasingly Worked from Home Prior to the Pandemic; Since Then, the Share of Remote Workers Surged During the Pandemic and Remains Elevated

6. Employees Increasingly Worked from Home Prior to the Pandemic; Since Then, the Share of Remote Workers Surged During the Pandemic and Remains Elevated. Data available on request.
Source: Census Bureau, US Bureau of Labor Statistics, Goldman Sachs Global Investment Research
This 25pp increase above pre-pandemic levels has sustained despite the near-universal reopening of schools, gyms, and dining establishments. This lingering divergence argues for a sizeable share of remote computing in the post-pandemic economy—particularly when coupled with business and worker surveys indicating the same. A more recent study by career site Ladders Inc. found that 20 million office jobs could become fully remote (over 25% of the total) post-pandemic.
Combining this estimate with a likely rise of flexible workforce arrangements on the order of 25-30mn, we assume 23% of private-sector hours worked will ultimately migrate from the workplace to the household (relative to 2019). This would be roughly half the peak pace in April 2020 (46%), and it compares to the most recent Census Pulse reading of 30.5% in December (shown in the right panel). Put another way, we assume roughly a quarter of December’s Work-from-Home share will return to the office after the pandemic ends.
This five-fold increase in remote computing does not simply reflect changing worker preferences. It has likely benefited the business sector as well, on net. Comparing productivity data across 54 subindustries with the Census Survey of Income and Program Participation, we find a positive relationship between the 2020 share of remote workers in a given industry and the 3Q21 deviation of productivity from trend in that industry (GDP per worker-hour relative to the 2014-2019 trend; see blue scatter in Exhibit 7). The relationship is robust to controlling for the large output declines associated with the pandemic shock (see red scatter). This relationship is most pronounced in industries where tasks can be executed remotely, such as credit intermediation and data processing.

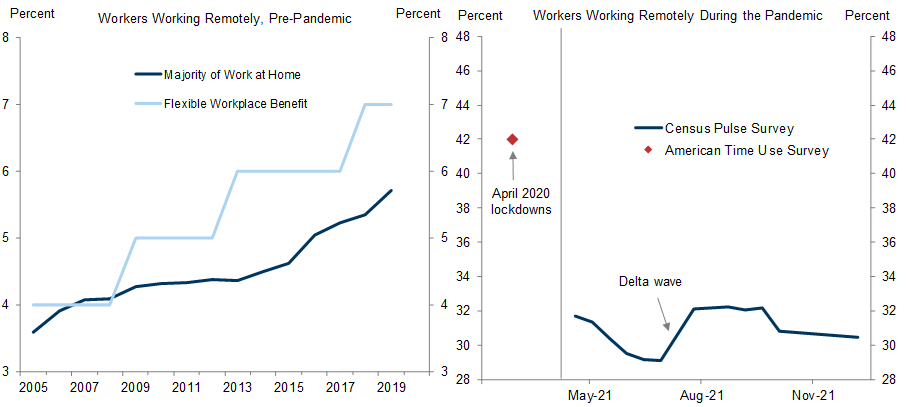
Exhibit 7: Work-from-Home Associated with Accelerating Productivity Across Subindustries—Even After Controlling for Pandemic Demand Declines

7. Work-from-Home Associated with Accelerating Productivity Across Subindustries—Even After Controlling for Pandemic Demand Declines. Data available on request.
Source: Bureau of Economic Analysis, US Bureau of Labor Statistics, Census Bureau, Goldman Sachs Global Investment Research
We also find that industries that are more exposed to automation have seen larger productivity increases, consistent with the hypothesis that the pandemic disruption incentivized firms to take advantage of efficiency gains from automation as in-person activities shut down (Exhibit 8). We use Frey and Osborne (2017)’s framework for classifying occupations’ exposure to automation, coupled with each occupation’s share of industry-level employment, to show that industries with a larger share of automatable occupations saw larger productivity gains relative to trend since the pandemic started. This relationship is also robust to controlling for pandemic output declines.

Exhibit 8: Industries More Conducive to Automation Also Exhibit a Pickup in Productivity Growth, On Average

8. Industries More Conducive to Automation Also Exhibit a Pickup in Productivity Growth, On Average. Data available on request.
Source: Census Bureau, Bureau of Economic Analysis, US Bureau of Labor Statistics, Goldman Sachs Global Investment Research
A closely related element of the digitizing workforce is the substitution of in-person sales and support staff with remote or automated services. For example, the composition of retail employment has evolved along these lines, with five fewer cashiers and salespeople per hundred workers in the industry (June 2021 vs. 2019 average, see Exhibit 9). The leisure sector has moved in a similar direction, in part reflecting the rise of mobile ordering, online check-in/check-out, and housekeeping service on request (red line in same exhibit).

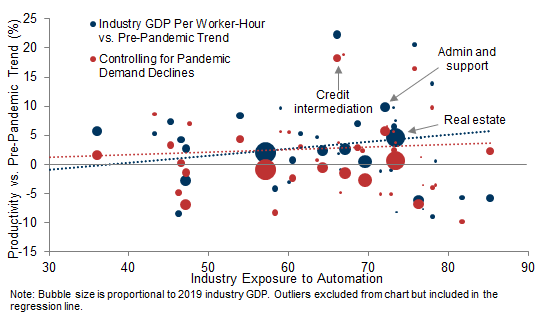
Exhibit 9: Digitization of the Consumer Experience Means Fewer In-Person Sales Staff After the Pandemic

9. Digitization of the Consumer Experience Means Fewer In-Person Sales Staff After the Pandemic. Data available on request.
Source: US Bureau of Labor Statistics, Bureau of Economic Analysis, Goldman Sachs Global Investment Research
These business model changes have outlasted—or in the case of the leisure sector, occurred after—the spring 2020 lockdowns, and they have not reversed in 2021 despite a sharp rebound in retail traffic and dining, hotel, and recreation services consumption. This suggests latent productivity improvements in these not-fully-recovered sectors that could boost aggregate productivity in coming quarters as the reopening continues.
Another consequence of Work-from-Home is the business-sector monetization of some of the $25tn of the residential capital stock—home offices—as well as some of the $600bn of consumer-owned IT equipment—laptops, desktops, smart phones, and tablets. We view the ride-sharing industry in the 2010s as a useful analog. Exhibit 10 plots the output and productivity boom in that industry as Uber and Lyft successfully monetized the household capital stock of cars.

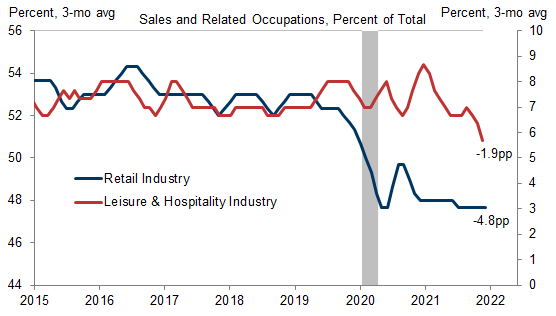
Exhibit 10: Business-Sector Monetization of Household Automotive Capital Stock Boosted Output and Productivity in the 2010s—Presaging Similar Gains Today from Home Offices and Consumer IT Equipment

10. Business-Sector Monetization of Household Automotive Capital Stock Boosted Output and Productivity in the 2010s—Presaging Similar Gains Today from Home Offices and Consumer IT Equipment. Data available on request.
Source: Bureau of Economic Analysis, Goldman Sachs Global Investment Research
The low marginal cost of this capital meant that it could be deployed opportunistically based on market conditions. Similarly, employees today often utilize home offices and household IT equipment on days without in-person meetings or when company production is seasonally low.
In part reflecting this, this household capital will not be utilized as frequently as its business-sector-owned equivalent, on average. We scale down our estimates accordingly based on work-from-home share data. Taken together, we estimate around $900bn of home offices and $300bn of consumer IT equipment has become available for business-sector use.

Room to Run

The sheer size of these changes to the workforce and to company business models argue for visible economy-wide productivity effects over the medium term. In Exhibit 11, we attempt to incorporate the above baseline estimates into a Cobb-Douglas production function of the private-sector economy, in order to illustrate the scale of the opportunity. These top-down estimates complement our previous bottom-up estimates.
Specifically, we assume 1.4 million fewer in-person sales staff in the private sector economy, 600 million fewer hours spent commuting each month due to full- and part-time Work-from-Home[3], and $900bn worth of home offices and $300bn of consumer IT equipment available for business-sector use (see blue bars in Exhibit 11).

Exhibit 11: Scale of Pandemic-Driven Workforce Changes Argues for One-Time Productivity Gains of at Least 3%

11. Scale of Pandemic-Driven Workforce Changes Argues for One-Time Productivity Gains of at Least 3%. Data available on request.
Productivity gains from fewer in-person sales staff reflect the average crisis-to-date decline in occupation shares across retail and food service/accommodation. We also assume a more modest digitization benefit (one third of that for retail/leisure) for real estate, private education, hospitals/physicians offices, and professional services. Assumes 67% labor intensity in the aggregate production function. Commuting estimates reflect 28-minute one-way commuting times pre-pandemic, 20mn office workers becoming fully remote post-pandemic, and 27mn workers adopting flexible working arrangements (with 2 days remote per week on average). Household capital stock estimates reflect sector-wide stocks of $25tn of housing and $600bn of IT equipment. Assumes 1 room per housing unit becomes a home office for those working remotely (part-time-remote utilization assumed at 2 days per week). Assumes 46% of consumer IT equipment now available for business-sector usage, based on learnings from the lockdown period (46% work-from-home share in April 2020). Assumes 33% capital intensity in the aggregate production function.
Source: Goldman Sachs Global Investment Research
The red bars of the same exhibit estimate the medium-term implications for labor productivity, either through higher total factor productivity or increased capital per worker. Together, we estimate these innovations combine to produce a +3.2% boost to the level of private-sector productivity in the medium term. Coupled with efficiency gains from the creative destruction channel[4]—1.75mn abnormal job losses from business closures during the pandemic, or 1.3% of private employment—a private-sector productivity boost on the order of +4% cumulatively continues to be a reasonable baseline, in our view.
While some of these changes could partially reverse in future years, GDP has now exceeded its pre-crisis level for two quarters. And as we imagine the post-pandemic economy, we place considerable weight on the crisis-to-date evolution of the workforce and on business-sector expectations as they stand today.
We see multiple takeaways from this analysis. First pre-pandemic GDP levels need not be a cap on economic activity in the medium-term, and these productivity gains will help offset the decline in labor supply experienced during the pandemic, in turn implying a longer runway for expansion. As shown in Exhibit 12, our productivity and labor force assumptions are consistent with 1.3% of spare capacity at year end, assuming GDP growth is similar to our and consensus expectations. This 1.3% year-end output gap reflects the further recovery in labor supply and additional productivity gains in our baseline forecast. We caution that these estimates reflect the long-run concept of spare capacity and do not map directly into near-term inflation outcomes. Indeed, we believe the risks to core inflation in the spring and summer center around the microchip shortage and the virus—for which the economy-wide output gap is of little relevance.

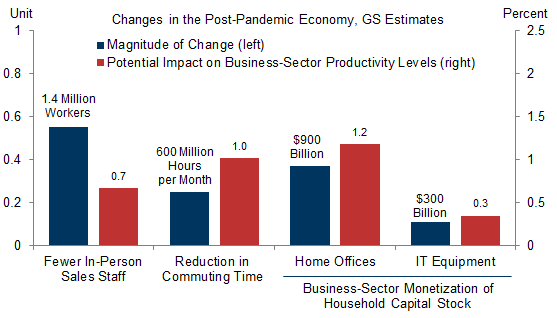
Exhibit 12: Pandemic-Driven Productivity Gains Imply a Longer Runway for Expansion—and Less Inflation Pressure Once the Pandemic Ends

12. Pandemic-Driven Productivity Gains Imply a Longer Runway for Expansion—and Less Inflation Pressure Once the Pandemic Ends. Data available on request.
Source: Bureau of Economic Analysis, Goldman Sachs Global Investment Research
But looking further ahead, these efficiency gains support our forecast of a more normal inflation environment once pandemic dislocations begin to recede. Coupled with improving labor supply, rising microchip production, and a mounting fiscal drag, we continue to expect downward pressure on inflation in the second half of 2022 and in 2023, barring additional shocks.

Spencer Hill

We thank Manuel Abecasis for his extensive contributions to this report.

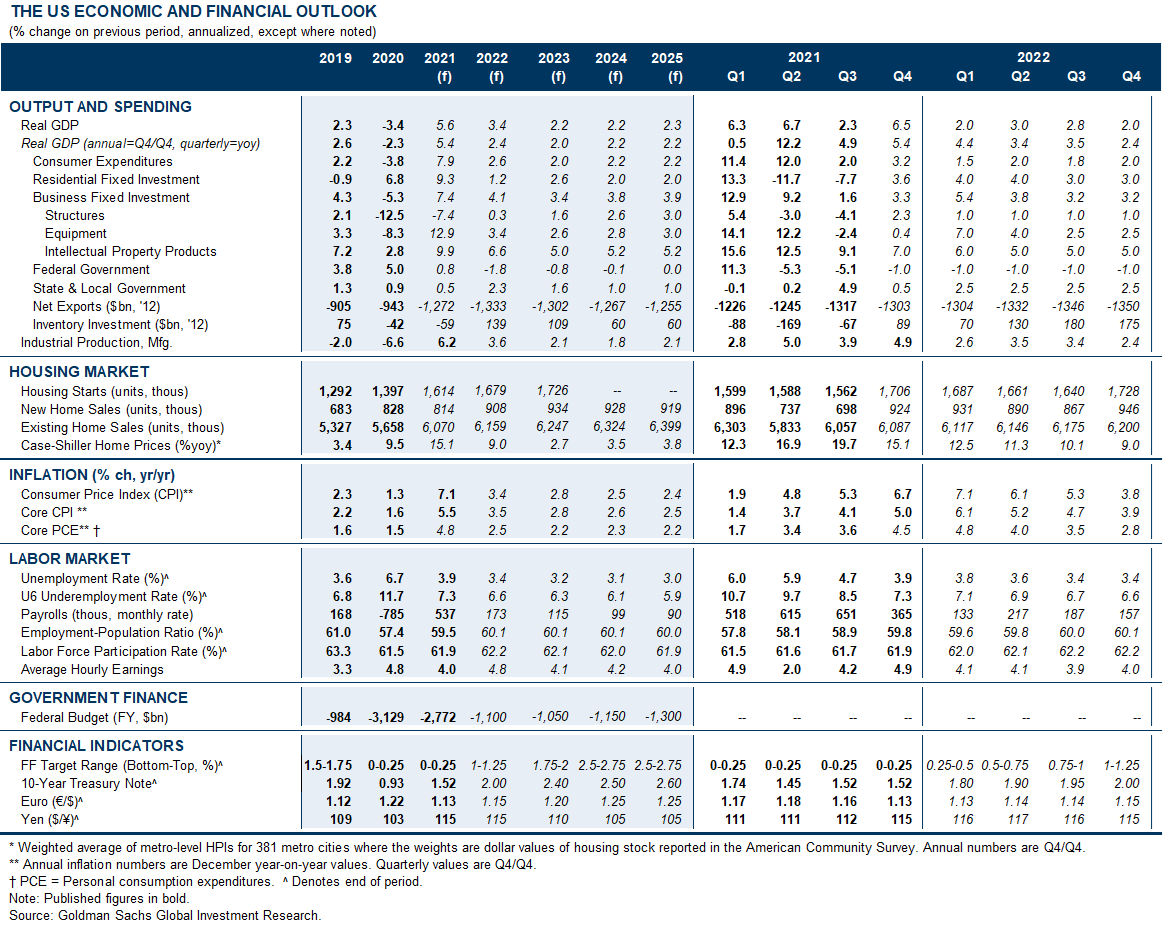
The US Economic and Financial Outlook
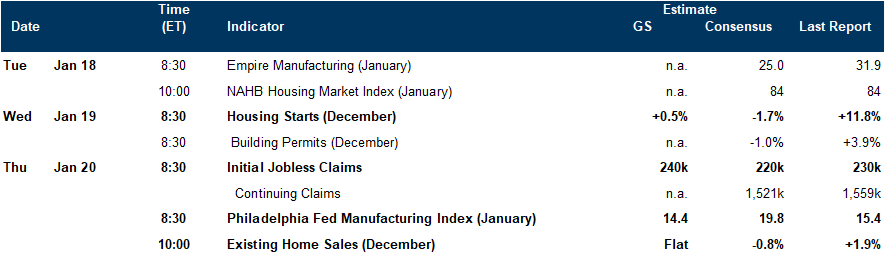
Data available on request.
Source: Goldman Sachs Global Investment Research

Economic Releases

Data available on request.
Source: Goldman Sachs Global Investment Research
  1. 1 ^ Commercial real estate is one key exception whose use as an intermediate input has not yet declined (as a share of GDP). To the extent that offices downsize or adopt shared workspaces after the pandemic, this offers a significant opportunity for additional productivity gains—specifically as the floor space is sold to other businesses or reallocated to residential or retail uses.
  2. 2 ^ Some of the transportation weakness may also be virus-related—reflecting weaker consumer demand or supply inefficiencies caused by the pandemic.
  3. 3 ^ Many of these workers and hours will be reallocated to more productive uses—especially at a time of labor shortages and near-record job vacancies.
  4. 4 ^ The net exit of unprofitable or inefficient businesses that occurs during and in the wake of recession.

Investors should consider this report as only a single factor in making their investment decision. For Reg AC certification and other important disclosures, see the Disclosure Appendix, or go to www.gs.com/research/hedge.html.