Our global financial conditions index (FCI) has tightened, in part because the Fed has turned more hawkish in the face of rising inflation but slowing growth. Where are risks to growth from FCI spillovers largest? We estimate rules of thumb for the impact of US monetary policy, growth, and inflation surprises on our FCIs via long rates, equities and the trade-weighted exchange rate index (TWI).
We find that a 100bp hawkish Fed surprise tightens our global FCI by much more (40bp) than a 1pp positive US growth or inflation surprise (both roughly flat). Our US FCI tightens in response to all three surprises, as do our EM FCIs (to varying degrees), while the effects on DM ex. US FCIs are more mixed.
Hawkish Fed surprises raise long rates, weigh on equities, and depreciate the TWI in nearly every country. We find that a 100bp hawkish Fed surprise tightens our FCI by 80bp in the US (100bp including corporate bond spreads), 70bp in China, 40bp in the UK and Latam, 30bp in CEEMEA, and 20bp in Asian EMs ex. China. In contrast, FCIs are unchanged in the Euro area, and ease in Canada and Australia following large TWI depreciations.
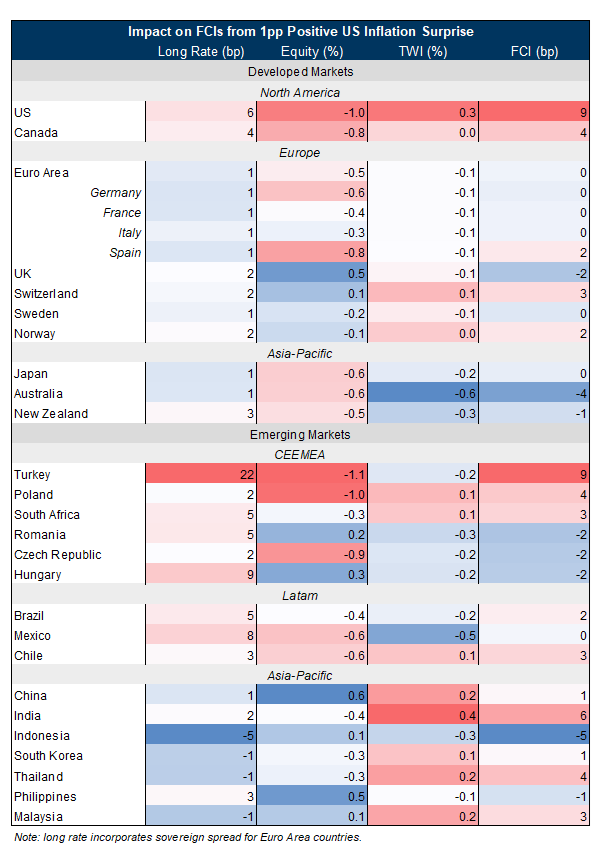
Positive US growth surprises raise long rates and equities, but weigh on TWIs in DMs. We estimate that a 1pp US growth surprise tightens FCIs by 5-10bp in the US, Australia, and Canada, but eases FCIs slightly in the Euro Area and Japan (by 5 & 10bp respectively). As a result of small moves following positive US inflation surprises, we find that a 1pp US inflation surprise tightens FCIs moderately in the US (+10bp), and slightly in Canada and CEEMEA (+5bp) but leaves FCIs in the Euro area and elsewhere roughly unchanged.
The relatively large impact of Fed surprises suggests that news about the Fed’s criteria for slowing down or speeding up from a 50bp hiking pace will be important for global FCIs. Further hawkish developments would weigh on global growth, mostly via the US, China, and EMs, but have limited spillovers to the Euro area, and actually possibly support growth in Canada.
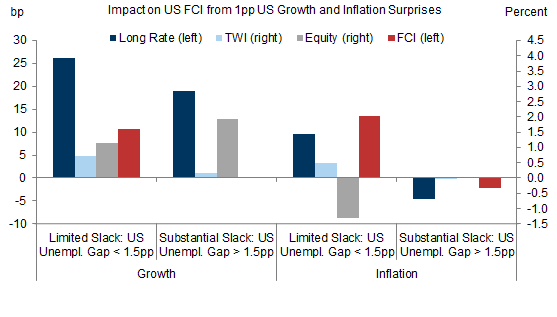
That said, FCIs may respond more to inflation and growth surprises than our statistical estimates suggest because they matter for Fed policy, especially when the economy is overheated.
Rules of Thumb for US Spillovers to Global Financial Conditions
US Rules of Thumb
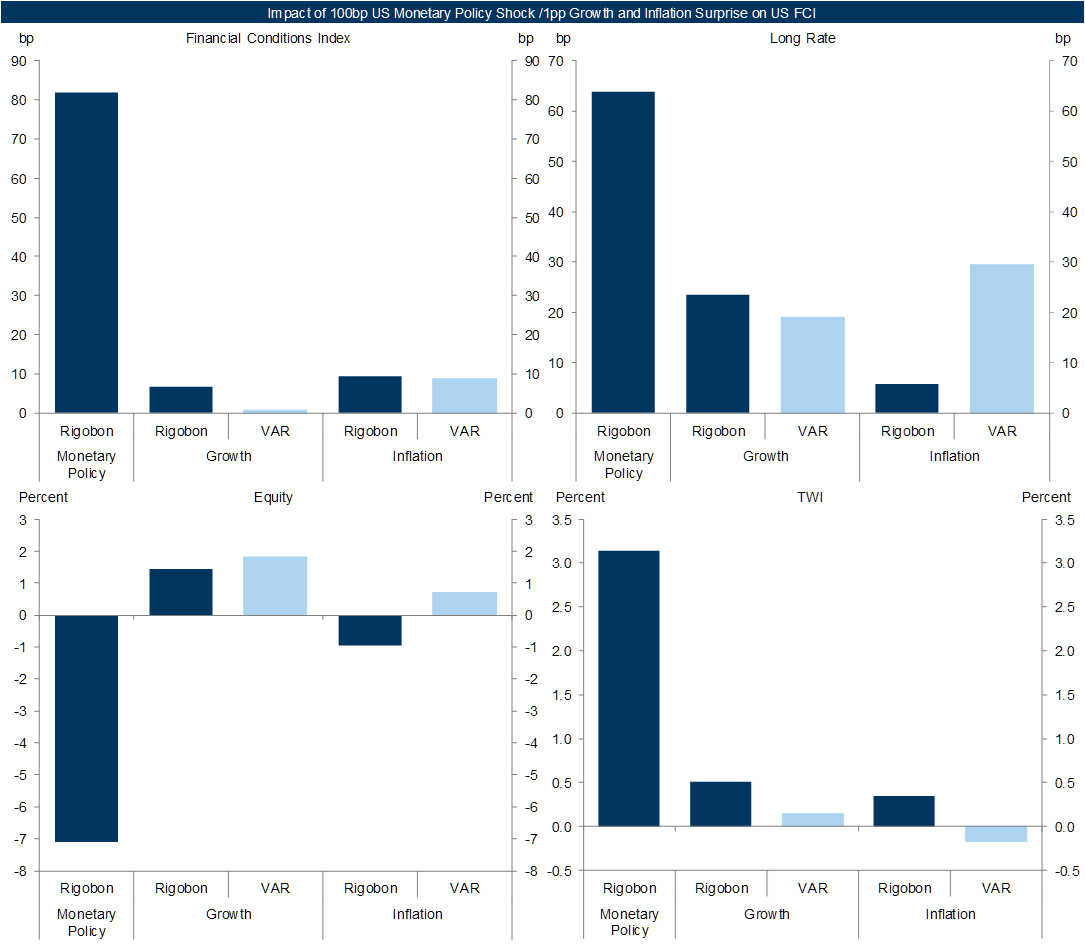
Exhibit 1: A 100bp Hawkish Fed/1pp Growth/1pp Inflation Surprise Tightens our US FCI by Roughly 80bp/5bp/10bp via Long Rates, Equities, and the Dollar
Global Rules of Thumb
Exhibit 2: Large FCI Tightening Effects From Hawkish Fed Shocks
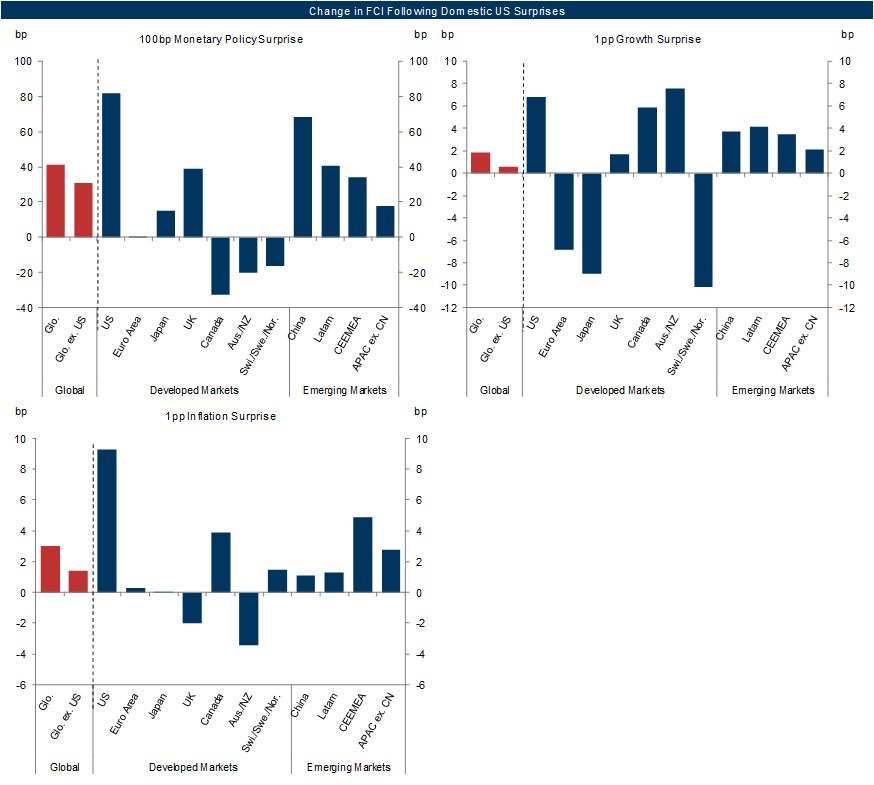
Exhibit 3: Equities and Rates Both Tighten FCIs After a Hawkish Fed Shock or a Positive US Inflation Shock but Rising Equities Buffer FCIs After a Positive US Growth Shock
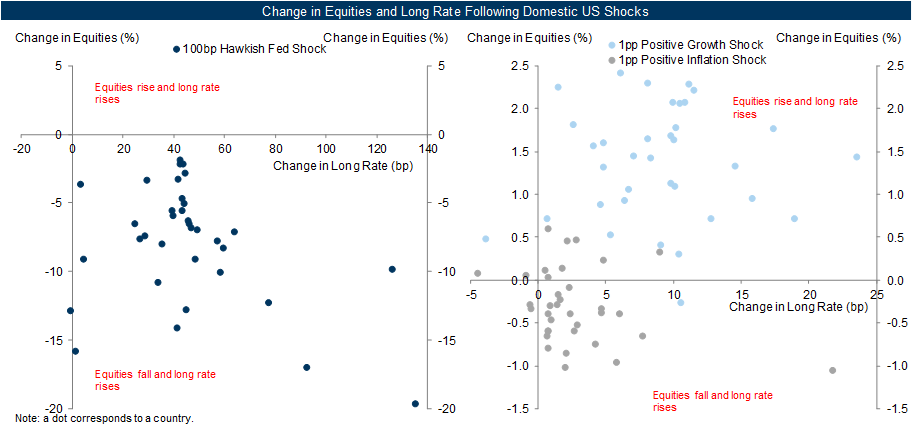
Exhibit 4: A 100bp Hawkish Fed Policy Surprise Tightens FCIs Most in the US, Brazil, China, and Turkey but Eases FCIs in New Zealand, Switzerland, Canada, and Australia
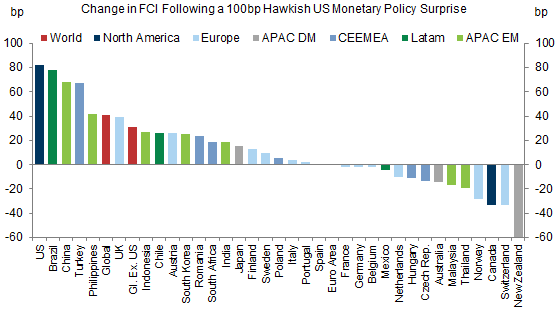
Exhibit 5: Long Rates Rise, Equities Fall, and Most Currencies Depreciate Following a Hawkish Fed Surprise
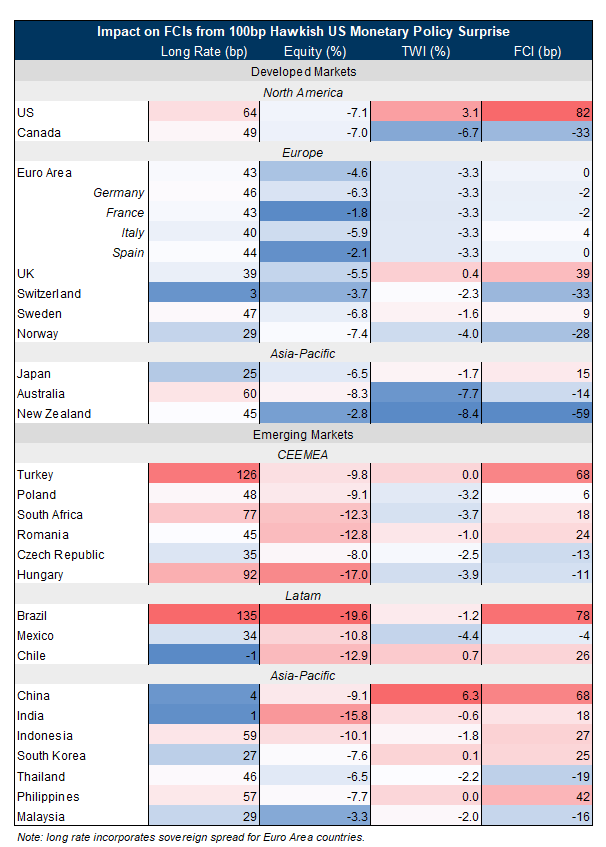
Exhibit 6: A 1pp Positive US Growth Surprise Very Moderately Tightens FCIs in Neighbouring Countries but Eases FCIs in Europe and Japan
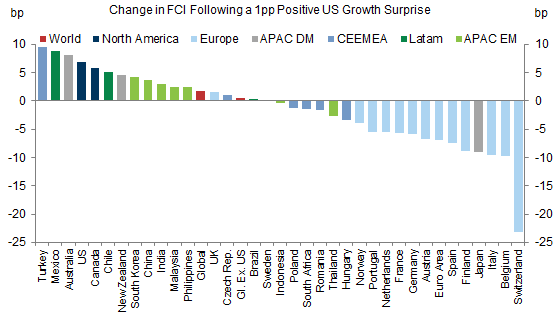
Exhibit 7: Long Rates Rise, Equities Rise, and DM Currencies Depreciate Following a Positive US Growth Surprise
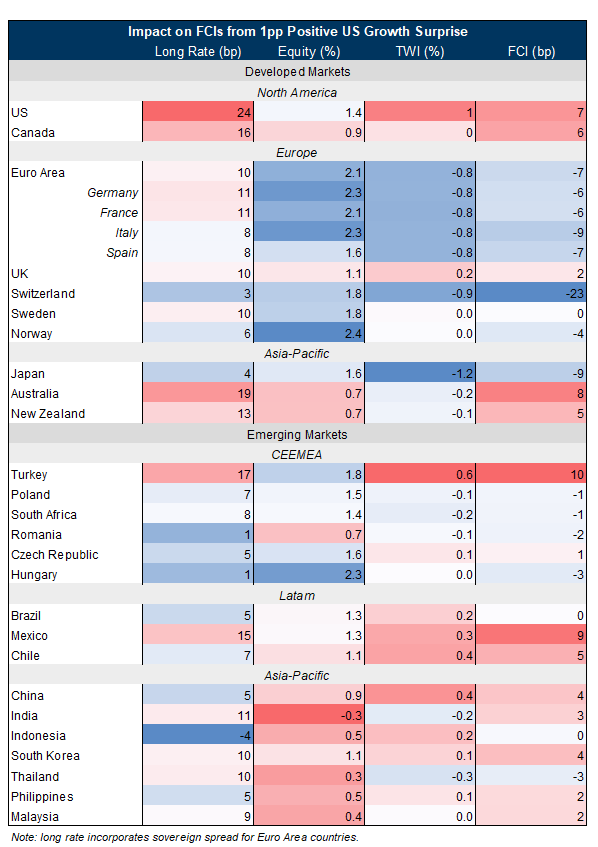
Exhibit 8: A 1pp Positive US Inflation Surprise Has Limited FCI Spillovers
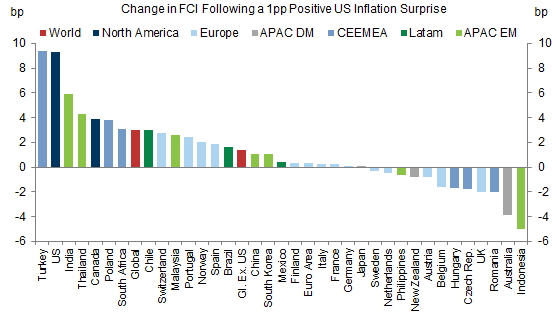
Exhibit 9: Long Rates Edge Up, Equities Edge Down, and DM Currencies Edge Down Following a Positive US Inflation Surprise
Figuring Out the Fed
Exhibit 10: US Growth and Inflation Surprises Tighten our US FCI When There Is Little Slack but Have Limited Effects Otherwise
Sid Bhushan
- 1 ^ Our daily MAP surprise indices summarize the importance and strength relative to consensus expectations of economic indicators.
- 2 ^ We have previously used this Rigobon method to estimate the impact of monetary policy surprises on our US FCI. In the case of growth and inflation, this method uses the difference between the relationship between our MAP indices and FCIs on days with/without large data surprises.
- 3 ^ See Daan Struyven and David Choi, “Fed Pricing: The Cost of Doing Nothing”, US Economics Analyst, 23rd June 2019.
- 4 ^ A 1pp growth shock roughly corresponds to a 500k beat in non-farm payrolls. The 1pp inflation shock is for core CPI.
- 5 ^ While these more likely reflect genuine news rather than one-off data surprises, they are only available at a monthly frequency. We also control for foreign surprises, oil prices, CAIs, and volatility as measured by the VIX.
- 6 ^ For each country, we use the sample over which our FCIs are constructed.
- 7 ^ For the greater DM currency sensitivity to rate differentials with the US, see Michael Cahill, “Updating our FX Cyclical Fair Value Models”, Global Markets Analyst, 18th June 2018.
- 8 ^ See Sid Bhushan and Daan Struyven, “Weaker Dollar Supports Global Growth”, Global Economics Analyst, 26th August 2020.
- 9 ^ We also estimate larger spillovers from US shocks to the Chinese TWI in the earlier part of our sample.
Investors should consider this report as only a single factor in making their investment decision. For Reg AC certification and other important disclosures, see the Disclosure Appendix, or go to www.gs.com/research/hedge.html.