Goldman Sachs Research
China Matters
Weakness in demand and constraints to stimulus
17 August 2022 | 8:50PM HKT | Research | Economics| By Hui Shan and others
More
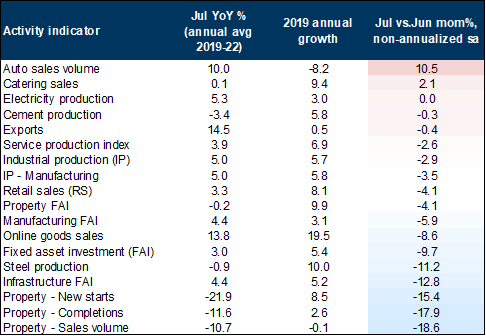
  • A clear picture of weak domestic demand: Combined with muted inflation and weak credit growth, July activity data confirmed the lack of domestic demand. With a few exceptions, most indicators showed sequential decline from June to July. For housing construction, infrastructure investment and steel production, the sequential declines were double-digit.

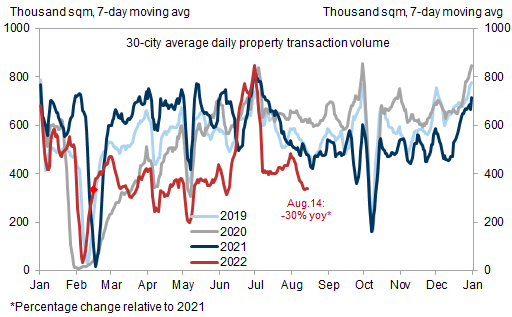
  • Negative impact of property slump permeating: Property investment contracted further in July, dragging down total investment. Retail sales of property-related items such as furniture and building materials significantly underperformed other items. And real estate services fell sharply, weighing on overall service output. High-frequency data suggest property sales dipped further in early August.

  • Covid and other near-term headwinds: Covid cases are on the rise and our China Effective Lockdown Index may need to stay elevated for the rest of 2022 under the zero-Covid regime. In addition, an unusually hot and dry summer has been stressing power supply and leading to production cuts in certain provinces and some energy-intensive sectors, although we are unlikely to see a repeat of last year’s power outages and severe production disruptions.

  • Major stimulus unlikely despite the PBOC rate cut: The PBOC surprised the market by cutting policy rates by 10bp. We do not think the rate cut signals the beginning of more aggressive easing. Policymakers face many constraints at present, some economic but others political. Their current focus is likely to be on stemming further downside risks and ensuring employment and social stability ahead of the 20th Party Congress.

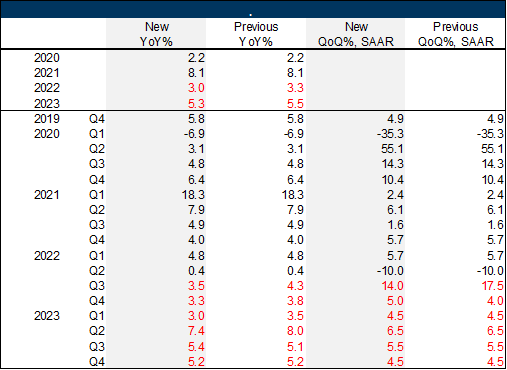
  • Lowering our Q3 GDP forecast: Taking into account the weaker-than-expected July data as well as near-term energy constraints, we cut our Q3 real GDP growth forecast from 17.5% (qoq annualized) to 14.0%, but lift our Q4 forecast from 4.0% (qoq annualized) to 5.0% on the assumption of easing energy constraints in Q4. These adjustments imply 3.5% yoy growth in Q3 and 3.3% yoy in Q4 (previously 4.3% and 3.8%, respectively). Our 2022 full-year forecast falls even further below consensus, to 3.0% (from 3.3% previously).

Weakness in demand and constraints to stimulus

A weak batch of data

The July batch of macro data showed an unequivocal picture of weak domestic demand in China. On inflation, despite sharply rising pork prices, headline CPI inflation missed consensus expectations and core inflation slid down to 0.8% yoy. On credit growth, total social financing (TSF) flows came in significantly lower than expected, with bank loans, government bonds, and corporate bonds all falling. On activity data, industrial production (IP), retail sales and fixed asset investment (FAI) declined both sequentially and in year-over-year terms (Exhibit 1).
Looking across a wider range of indicators, Exhibit 2 shows that, with a few exceptions, most major activity gauges softened from June to July. For example, other than auto (which has been benefiting from policy support such as local subsidies and purchase tax cut), restaurant service (which was 12% below its February level as of June and continued to recover in July), and electricity production (which was boosted by the summer heat wave), all other major indicators declined sequentially. In the case of property sales, completions, and starts, as well as infrastructure FAI and steel production, the sequential declines were double-digit.

Exhibit 1: A notable sequential decline in IP, retail sales and FAI in July

1. A notable sequential decline in IP, retail sales and FAI in July. Data available on request.
Source: NBS, CEIC, Goldman Sachs Global Investment Research

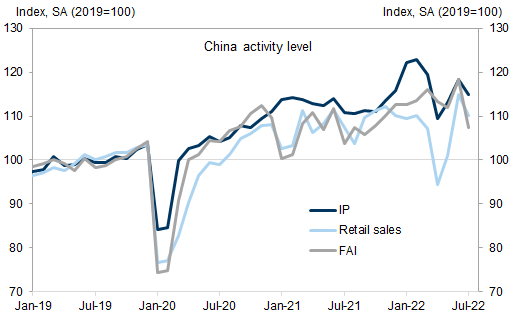
Exhibit 2: Most major activity indicators weakened sequentially

2. Most major activity indicators weakened sequentially. Data available on request.
Source: CEIC, Goldman Sachs Global Investment Research

Larger-than-expected drag from the property sector

Details of the July data suggest the weaker-than-expected activity data may be primarily driven by the worse-than-expected property slowdown. Exhibit 3 shows that property FAI fell 12.3% yoy despite the more favorable base effect in July, dragging down total investment. Retail sales data for large enterprises show that sales of furniture and building materials declined 6.3% and 7.8% yoy, respectively, underperforming sales of other items. During the post-release press conference, NBS officials commented that the service production index of the real estate sector dropped 10.8% yoy in July, weighing on overall service output. The combination of decreasing steel prices and steel production also points to weak demand in property construction: new starts and property completions fell 45% and 36% yoy, respectively, in July.
Despite the ongoing easing measures in the housing market, including the relaxation of purchase restrictions, lower mortgage rates and down payment requirements, and local property funds to ensure property completion and on-time delivery of presold homes, property sales declined again in early August (Exhibit 4). The number of reported mortgage boycotts tracked by our property team has stopped rising. However, the damage to sentiment among potential homebuyers may already be done. Sell-through rates of private developers remain considerably below those of SOE developers, causing the liquidity situation of these private developers to deteriorate further. Although the latest media reports of regulators potentially providing bond guarantees for a few private developers led to a market rally for property names, housing activity is unlikely to improve meaningfully in August.

Exhibit 3: Property FAI declined 12.3% yoy in July

3. Property FAI declined 12.3% yoy in July. Data available on request.
Source: CEIC, Goldman Sachs Global Investment Research

Exhibit 4: Property sales continued to slide in August

4. Property sales continued to slide in August. Data available on request.
Source: Wind, Goldman Sachs Global Investment Research

Covid and other growth headwinds

The recent Covid resurgence is another roadblock to China’s near-term recovery path. Daily new cases exceeded 2000 in the past few days, significantly higher than the average of 100 in June and 500 in July (Exhibit 5). Our China Effective Lockdown Index (ELI), a proprietary gauge of Covid restrictions based on policy and mobility measures, moved sideways in recent weeks after falling notably in May and June. During the July Politburo meeting (and again in an Qiushi article published on August 16), the leadership called for calculating the political cost when it comes to balancing Covid control and economic development, implying in our view that the dynamic zero-Covid policy is unlikely to be voluntarily given up anytime soon. Considering the high transmissibility of the current subvariants, ELI may need to stay elevated for as long as China sticks to its zero-Covid policy (Exhibit 6).

Exhibit 5: Daily Covid cases increased again in China

5. Daily Covid cases increased again in China. Data available on request.
Source: NHC, CEIC

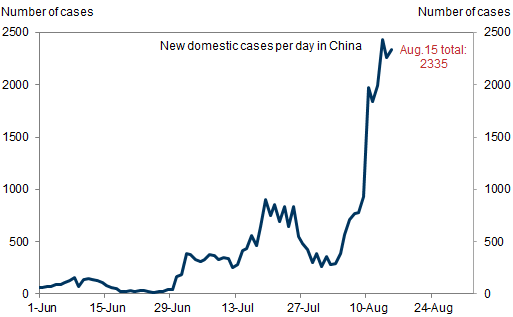
Exhibit 6: China ELI may need to stay elevated for the rest of 2022 under zero-Covid policy

6. China ELI may need to stay elevated for the rest of 2022 under zero-Covid policy. Data available on request.
Source: Goldman Sachs Global Investment Research, University of Oxford (covidtracker.bsg.ox.ac.uk), Wind
Besides property and Covid, three other near-term headwinds are worth mentioning. First, energy constraints have begun to impact industrial production. This July was the second hottest and driest July since the government started keeping records in 1961, and average temperature is expected to remain higher than normal in August, according to the China Meteorological Administration. In the July NBS manufacturing PMI, energy-intensive industries reported cutting production due to power shortages. Exhibit 7 shows that sectors with the highest energy intensity – ferrous smelting, non-ferrous smelting, and non-metal mineral – experienced weaker sequential IP growth in July. More recently, Sichuan province (4.7% of national GDP) announced the suspension of industrial production for six days to ensure residential electricity supply. Although we do not expect a repeat of the power outages and significant production halts seen last year as coal supply remains ample, energy constraints are likely to slow the pace of recovery in August relative to our previous expectations.
Second, the July IP data showed that Covid-related industries such as Pharmaceutical (for vaccine production) and Computer (for work-from-home demand) slowed more than other industries (Exhibit 7). Given the slowing vaccination rate in China and re-opening overseas, growth in these Covid-related industries may stay muted in the coming months.
Third, related to the various headwinds in the economy and heightened uncertainty about the future, private investment demand is weak. For example, according to the Cheung Kong Graduate School of Business (CKGSB) Business Conditions Index the share of surveyed companies planning to invest has remained depressed since the April Covid lockdown, which does not bode well for credit demand and manufacturing investment in H2 (Exhibit 8).

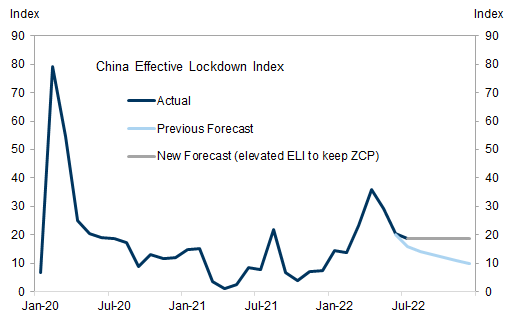
Exhibit 7: Weakening production in energy-intensive and Covid-related sectors

7. Weakening production in energy-intensive and Covid-related sectors. Data available on request.
Source: NBS, CEIC, Goldman Sachs Global Investment Research

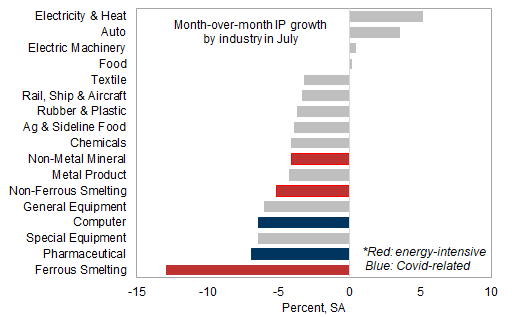
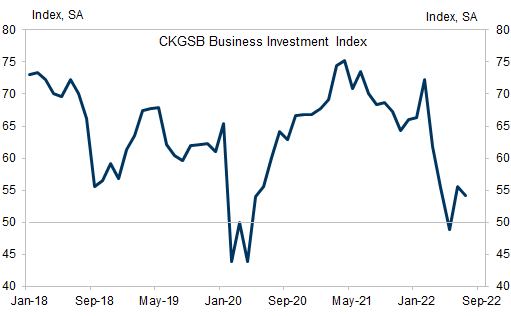
Exhibit 8: Surveyed companies’ investment demand remains weak

8. Surveyed companies’ investment demand remains weak. Data available on request.
Source: Haver Analytics

PBOC rate cut through the lens of risk control

Another major surprise on August 15 was the policy rate cut by the PBOC, reducing the 7-day OMO rate from 2.1% to 2.0% and the 1-year MLF rate from 2.85% to 2.75%. RMB weakened immediately after the rate cut (Exhibit 9). This move was unexpected by the market, especially considering the fact that the central bank did not cut the policy rate even when Q2 GDP contracted 10.0% qoq ann. due to the Shanghai lockdown and that the Q2 Monetary Policy Report released just days before expressed increased concern over inflation risks.
With the benefit of hindsight, the move could be related to rising bond market leverage amid very low interbank interest rates. As we discussed recently, the PBOC had resorted to low-profile easing measures such as keeping liquidity ample and allowing interbank interest rates to fall significantly below policy rates to provide the needed support domestically without generating capital outflows and FX volatility when ex-China rates are rising. However, one of the costs of flush liquidity is leverage buildup and financial risks in the bond market. Exhibit 10 shows that overnight repo volume, a proxy for bond market leverage, has indeed increased dramatically over the past few months when interbank interest rate declined sharply. With the July credit and activity data significantly missing expectations, more easing was clearly needed. As flush liquidity encouraged risking-taking but did not seem to be effective in boosting credit growth, the central bank might have decided to shift to a rate cut, especially during the August window between Fed rate hikes. The PBOC’s decision to roll over less MLF, thus withdrawing liquidity, while cutting the policy rate could be viewed through the lens of risk control.

Exhibit 9: RMB weakened against the USD on China rate cut and disappointing activity data

9. RMB weakened against the USD on China rate cut and disappointing activity data. Data available on request.
Source: Bloomberg

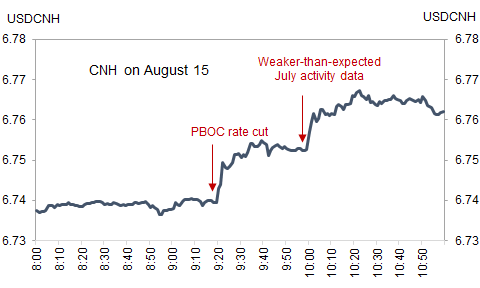
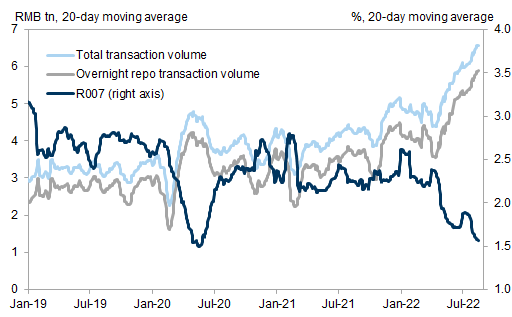
Exhibit 10: Bond market leverage increased significantly as interbank rate fell

10. Bond market leverage increased significantly as interbank rate fell. Data available on request.
Source: Wind , Goldman Sachs Global Investment Research

Constraints to major stimulus

Why hasn’t the Chinese government eased more aggressively given how much the economy has slowed this year? This is the question we receive the most from clients these days. After all, the Fed has raised interest rates by 225bps since March to combat inflation whereas the PBOC has only cut policy rates by 20bps year-to-date during the most severe property slowdown in decades. In our view, the reason may be the many constraints faced by policymakers, some economic but others political.
First, the property slowdown that started a year ago was initially driven by the policy choice of reducing developer leverage and achieving the long-term goal of “housing is for living in, not for speculation”. Even with the outsized contraction this year, banks, regulators and local governments still need to stick with this broad policy goal and a blanket bailout looks out of the question. In fact, Wang Menghui, the former head of the Ministry of Housing and Urban-Rural Development (MOHURD) who helped push through “the three lines”, became the party secretary of Hubei in March, effectively a promotion.
Second, given the lack of natural immunity in the population and the still low vaccination rate among the elderly, it is difficult for China to exit its zero-Covid policy anytime soon. Even with the frequent mass testing in major cities and fine-tuned Covid control guidelines, sporadic local lockdowns are hard to avoid. Traditional easing measures, including monetary and fiscal policies, could be less effective under this backdrop. For example, credit supply has remained ample, as shown in the faster growth of bill financing relative to medium to long term loan growth, but credit growth disappointed on anemic credit demand.
Third, with a risk-averse mindset ahead of the 20th Party Congress, the central bank is somewhat constrained by rising commodity prices and ex-China hiking cycle. The fact that the PBOC decided to cut policy rate during August when there is no FOMC meeting and Fed hike suggests this might indeed be an important consideration. On the fiscal front, the government has frontloaded this year’s local government special bond quota and part of next year’s fiscal budget. But additional frontloading may face resistance because it would imply a very negative fiscal impulse next year, all else equal.

Exhibit 11: Surveyed unemployment rate declined in July

11. Surveyed unemployment rate declined in July. Data available on request.
Source: Haver Analytics

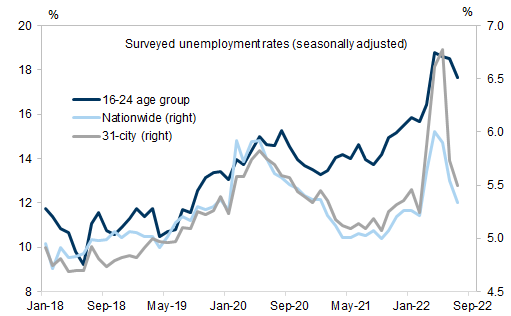
Exhibit 12: We have revised down our Q3 real GDP growth forecast

12. We have revised down our Q3 real GDP growth forecast. Data available on request.
Source: Goldman Sachs Global Investment Research

Lowering Q3 and full-year GDP forecast

All of these constraints point to a muddle-through picture where the government reactively eases policies to stem further downside risks, whether it is major Covid outbreaks, systemic financial risks, or energy shortages, but does not proactively ease to boost growth. Policymakers downplayed this year’s growth target at the July Politburo meeting and recent policy communications tended to emphasize employment stability and price stability, as opposed to growth stability. On our numbers, about one third of the provinces have followed suit and toned down their own growth targets. In the July data, the urban unemployment rate showed continued improvement, although youth unemployment rate remains uncomfortably high (Exhibit 11).
Onboarding the weaker-than-expected July data and incorporating headwinds such as Covid resurgence and energy constraints, we cut our Q3 real GDP growth forecast from 17.5% (qoq annualized) to 14.0%, but nudge up our Q4 forecast from 4.0% (qoq annualized) to 5.0% on the assumption of easing energy constraints in Q4 (Exhibit 12). These adjustments reduce our full-year GDP forecast to 3.0% (vs. 3.3% previously) for 2022 and to 5.3% (vs. 5.5% previously) for 2023, although next year’s growth outlook remains highly uncertain at this moment and depends crucially on the developments in the property sector and Covid policy in the coming quarters.

Investors should consider this report as only a single factor in making their investment decision. For Reg AC certification and other important disclosures, see the Disclosure Appendix, or go to www.gs.com/research/hedge.html.