Every new cycle has new winners
The recipe for multibaggers in Chinese equities
All stars are aligned: Growing with Chinese "Little Giants"
Introducing GS "Little Giants" Portfolio (GSSRCNLG)
Every new cycle has new winners
China's economic achievements have been impressive since Deng Xiaoping introduced "reform and openness/socialist market economy" in 1978 and made his famous "Southern Tour" in 1992: China has delivered a GDP CAGR of 14% since 1990, become the second largest economy in the world (also 2nd largest in terms of market value for equities and bonds globally), managed to grow its per capita income to US$12,588 as of 2021 (US$19,170 in PPP terms), and has the largest asset class in the world in its US$60tn residential housing market.
While the aggregate market cap of Chinese stocks (A shares and Offshore listed combined) has also increased 17x since 2000, the realized equity returns at the headline index level have significantly lagged the strong economic performance: MSCI China, HSCEI, SHCOMP have only gained 0%, -6%, and 3% CAGR in USD terms (-2% to 6% adding dividends) over the past 10 years during which GDP growth was averaging 9% per annum. The realized market returns have also trailed those from major equity markets globally, with SPX, SXXP, TOPIX, and Emerging Markets (MXEF) generating 14%, 6%, 6% and 2% total returns during the same period despite slower macro growth in their respective home markets.
In our recent Global Strategy Paper--The Asian Earnings Enigma--we discussed some potential explanations for the disparity between equity gains and economic growth in China, notably index composition shifts, shares dilution, and compressing profitability due to various macro and sector specific reasons. At a higher level, the issues around regulation tightening targeting the New Economy, the increasing policy/socioeconomic pivot towards socialism and "Common Prosperity" vs. pure market-driven capitalism, and other structural growth headwinds such as a slowing property market, high systemwide leverage, and aging population are also possible reasons for the lackluster equity returns.
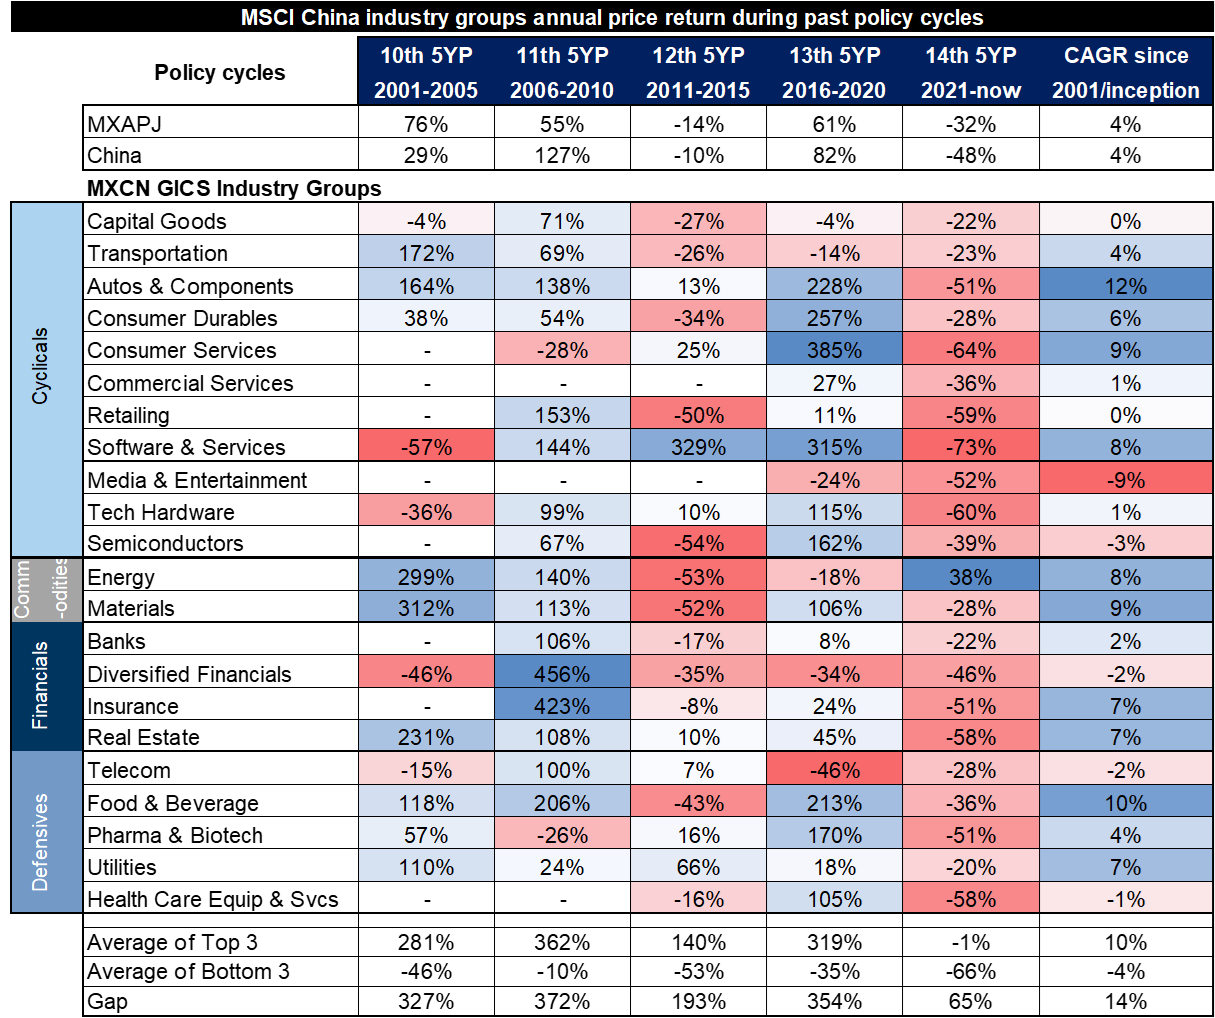
While a simple buy-and-hold, beta-oriented strategy in the stock market may not be the most efficient way to monetize the strong economic growth (potential) in China, picking the right themes and sectors in the right cycle has proven to be highly rewarding, as evidenced by the significant realized alpha from Commodity Cyclicals in the early 2000s, Financials in the late 2000s, and Consumer/TMT stocks over the past decade. Dividing the past 2 decades into 4 equal periods based on China's 5-Year Plans, we note that the best-3 performing Industry Groups (GICS level 2) on average gained 275% in each of the 4 cycles, outpacing the worst-3 performing sectors by 311pp and the benchmark by 218pp. In our view, this underscores the importance of embracing active investing (or dynamic tilt for passive investing) in China and proactively shifting investment focuses as the economic and political cycles evolve.
Exhibit 1: China equity indexes have significantly lagged their global peers in the past decade
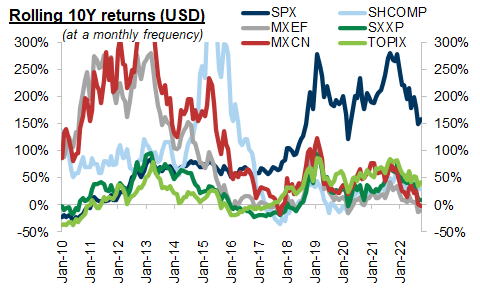
Exhibit 2: Strong fundamental growth hasn't translated into equity gains for Offshore-listed equities...
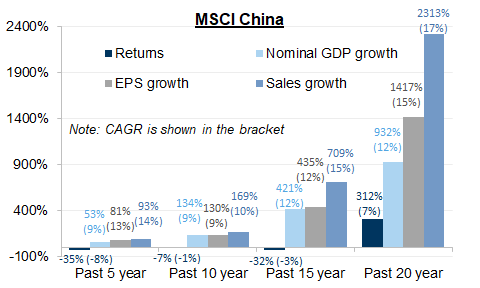
Exhibit 3: ...as well as for A shares
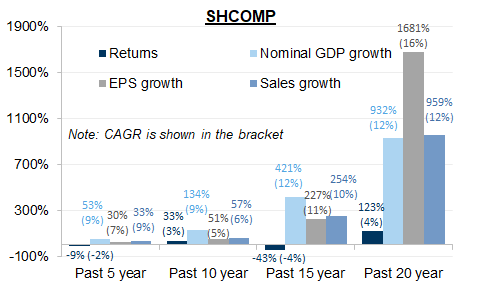
Exhibit 4: Significant sector composition shifts in the benchmark equity index over the past 2 decades
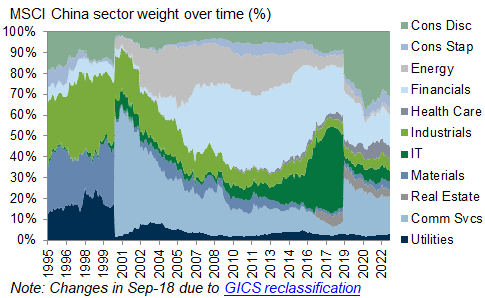
Exhibit 5: Significant rotation and return disparity across sectors over the past 20 years
The recipe for multibaggers in Chinese equities
High realized growth rates: 75% of the multibaggers managed to generate at least 40% revenue or profit growth during their outperformance periods. This reinforces the core investing principle that earnings growth is the fundamental driver of equity returns, and our belief that international investors have a structural preference for Growth over Value in China (and in other developing markets more broadly) when growth opportunities become increasingly scarce across the globe.
Strong small/mid-cap bias: Low base effect in most cases should be a favorable condition for stock returns as far as market cap size and profit pool is concerned as it simply implies larger headroom for growth, ceteris paribus. Additionally, the policy emphasis of supporting SMEs in the real economy and capital markets, and the regulatory restrictions regarding anti-trust and monopolistic behaviors should theoretically bode well for small/mid caps over time. However, Size is far from a sufficient condition for strong realized alpha empirically, with less than half of the stocks in the universe embarking on their uptrend with an initial market cap below US$500mn.
Favorable sector beta: As detailed in the 5th edition of our China A Primer, China is probably one of the best markets globally to trade/look for idiosyncratic alpha and inefficiency arbitrage opportunities, reflected by its high intra-market return disparity at both the sector and stock levels, a retail-dominated liquidity setup, and still-limited/developing sell-side research footprint. The potential excess returns from an active sector strategy approach could be significant as our previous analysis shows that picking the "average" stocks (i.e. stocks with median returns) in the "right" sectors (Industry Groups with top-quartile returns) would generate 25/34 pp annual alpha over "outperforming" stocks (stock with top-quartile returns) in the "underperforming" sectors (Industry Groups with bottom-quartile returns) in the offshore/A-share market. Our study reveals that 66% of the multibagger cases took place when their corresponding sectors outperformed in the rolling 5-year (or shorter) periods.
Inexpensive starting valuations: We note that 40% of the companies in our study universe traded below 10x PE or 1x P/B before they eventually became multibaggers. That said, the explanatory power of "low valuation" seems highly linked to the market valuation cycles as 43% of the multibaggers took off when the market was under significant stress, notably 2002-03, 2008-09, and 2015-16. It suggests to us that valuation level might not be a sufficient condition to call a market bottom nor a reason to derail a bull trend, but it does play an important role in framing risk and reward, and driving excess returns in the long run.
Policy tailwinds: It is widely accepted/embraced by investors that it is critical to align their portfolio with strategic policy goals and directions in China, especially considering the regulatory shocks since late 2020 which have been mainly responsible for the US$2tn erosion of market capitalization in the TMT sector since then. As such, we leverage our news-searching tools with a specific focus on articles from State-sponsored media outlets (e.g. Xinhua News, People's Daily, and China Daily, 2mn in total since 2005) to gauge the cyclical policy orientation at the sector level over time. By mapping the relative strength of policy support per our key-words analysis onto historical sector returns, we observe that the Policy factor has coincided with 75% of the occurrence of multibagger cases since 2005.
Exhibit 6: A very concentrated alpha distribution in Chinese euqities
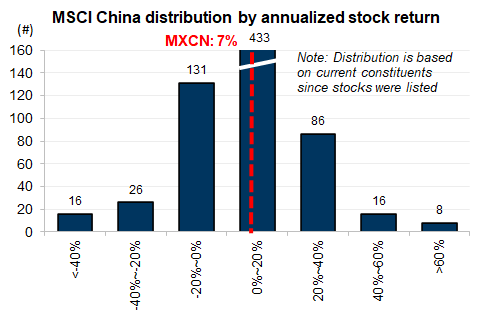
Exhibit 7: China is still the place to look for organic Growth opportunities
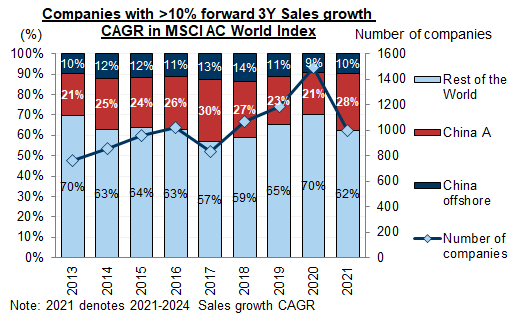
Exhibit 8: "High growth" is a common feature of multibaggers
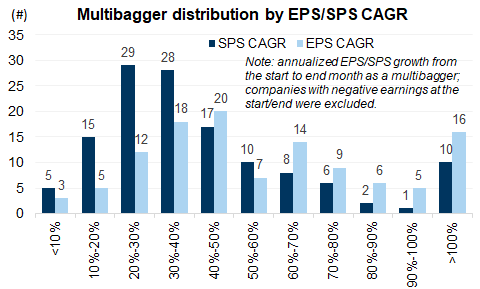
Exhibit 9: Favorable base effect matters for ensuing returns as far as Size is concerned
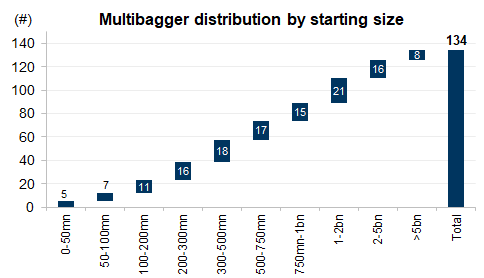
Exhibit 10: Small/mid caps have outperformed large caps in the past 15 years, but with significant ups and downs
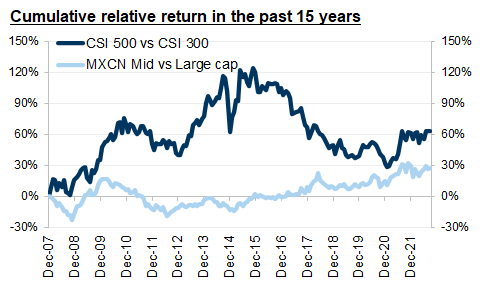
Exhibit 11: Historical multibaggers have been concentrated in Materials, Cap Goods, and F&B
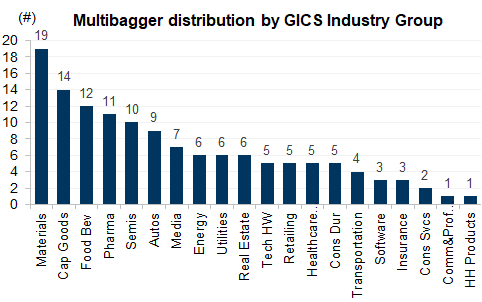
Exhibit 12: Median stocks in top-quartile Industry Groups have performed significantly better than top-quartile stocks in bottom-quartile Industry Groups
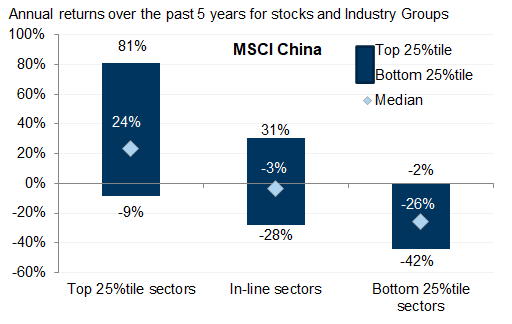
Exhibit 13: The occurence of multibaggers is negatively correlated with prevailing stock valuations
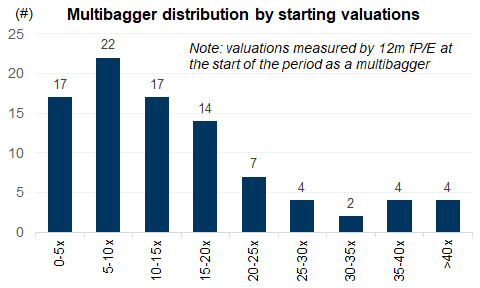
Exhibit 14: Low prevailing market valuations appear a necessary condition for multibaggers
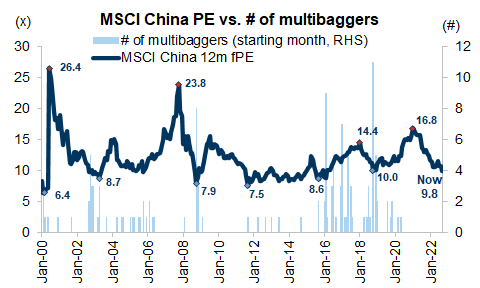
Exhibit 15: Industry groups with more positive policy mentions from official news tend to outperform those with fewer mentions
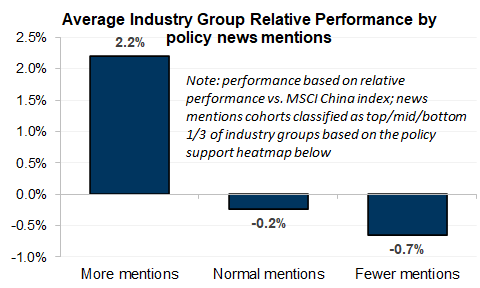
Exhibit 16: Our policy support heatmap based on news-searching technique
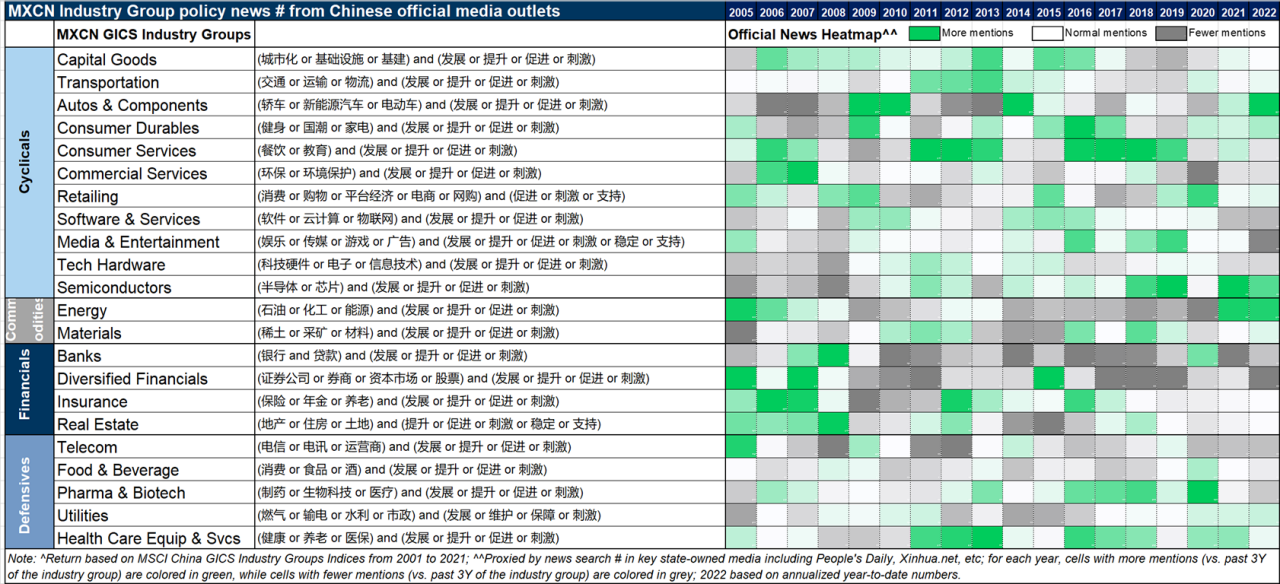
Exhibit 17: The five key common denominators of historical multibaggers in the Chinese equity universe
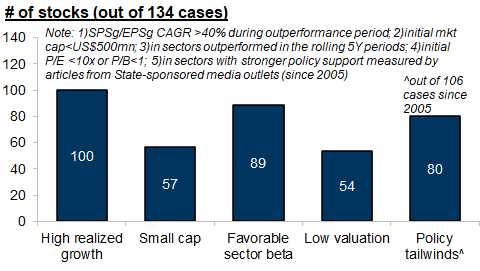
Exhibit 18: The 5 conditions have collectively explained the occurence of almost all 134 multibaggers in China in the past 20 years
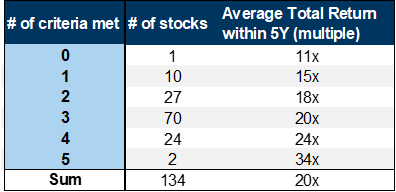
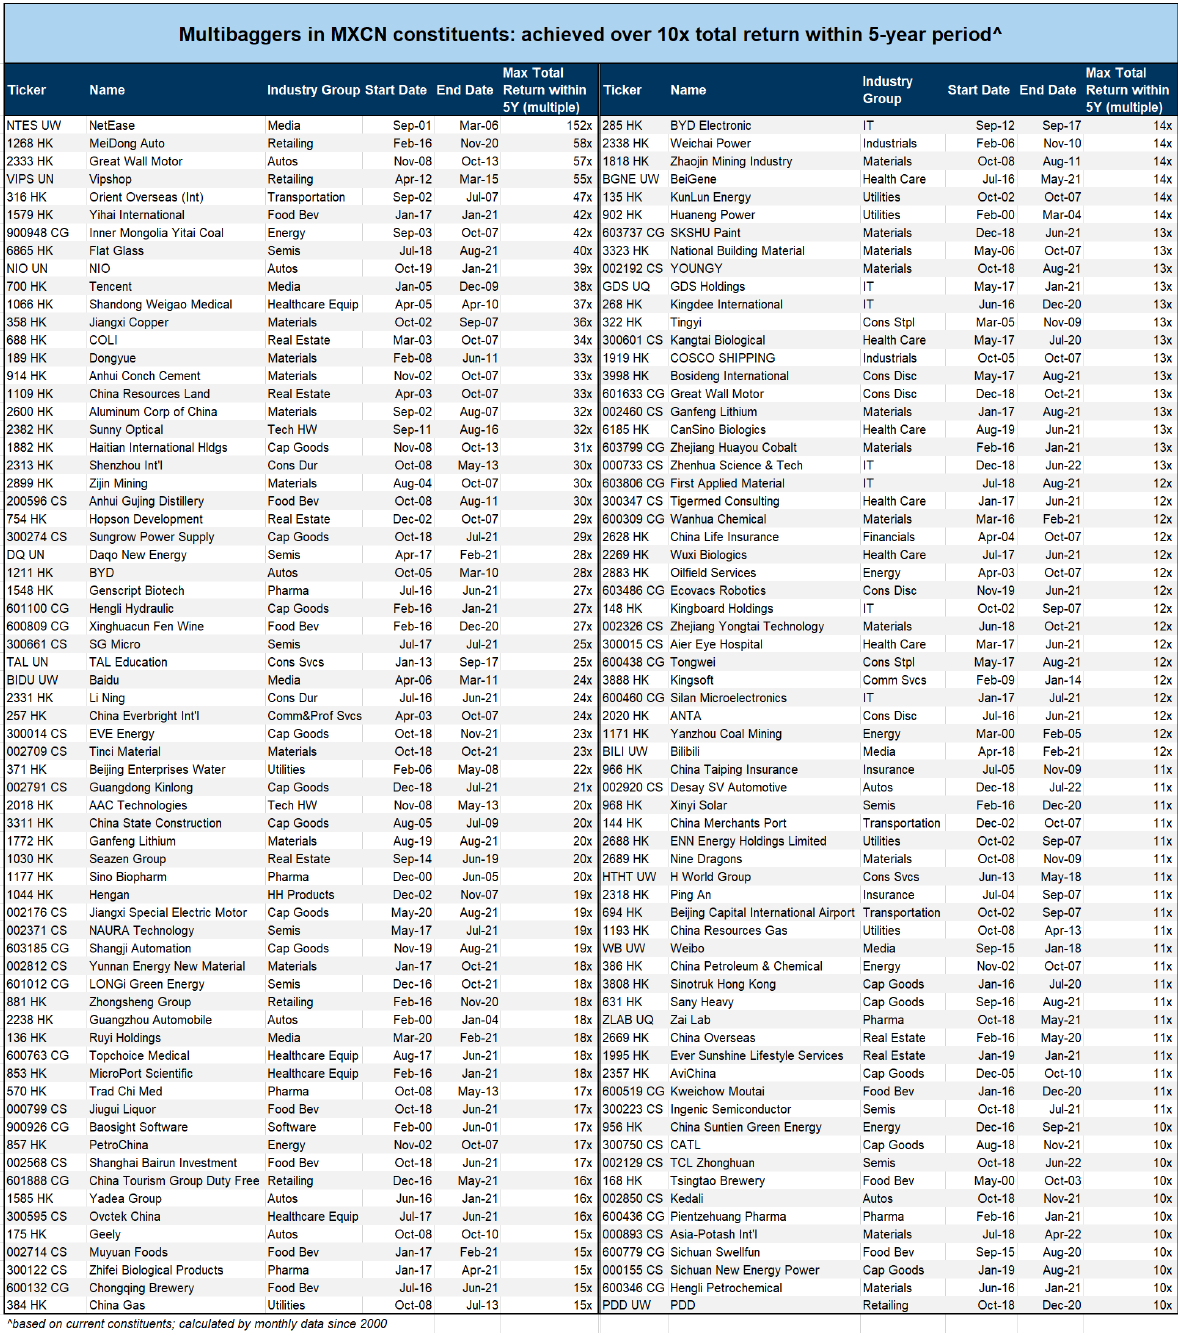
Exhibit 19: 134 names in the existing MSCI China universe had returned more than 10x within 5-year rolling periods over the past 20 years
All stars are aligned: Growing with Chinese "Little Giants"
From a policy alignment perspective, they are handpicked by the Chinese authorities for explicit and comprehensive policy support, spanning administrative measures, easier access to capital markets, to tax incentives and direct subsidies.
Sectorally, the listed "Little Giants" mainly reside in Cap Goods, (new) Materials, Tech Hardware, and Semi, all of which are critical to Chinese national security, growth sustainability, and supply chain stability, in our view.
Thematically, they are well synced with, and are essential building blocs to, the "Common Prosperity" vision considering their sector exposures/composition according to our "Common Prosperity" framework.
In terms of market attributes, the listed "Little Giants" carry a strong small/mid-cap flavor in the context of A shares, averaging Rmb7.6bn/US$1.1bn of listed market cap, but with a reasonably strong liquidity profile of US$16mn of ADT.
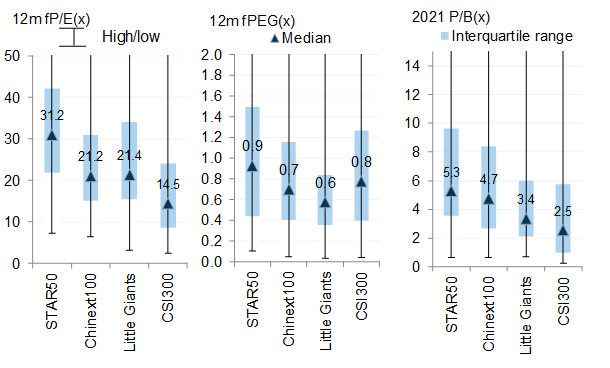
Fundamentally, they realized 22% top-line and 21% of bottom-line growth in the past 2 years on a median basis, and are expected by Wind consensus to generate 35% EPS CAGR in the next 2 (2022-2024E) years vs. 21% by CSI300. Their historical profit growth track record may not appear as strong as their STAR and ChiNext peers, but they have similar profitability, ROE, and R&D statistics. They on average trade over 21x fP/E on Wind consensus earnings (15x for CSI300), but look attractively priced when their growth potential is taken into consideration, boasting a PEG ratio of merely 0.6x.
Exhibit 20: "Little Giants" are handpicked by Chinese authorities for policy support, and appear strategically important to China in terms of its growth sustainability and national security
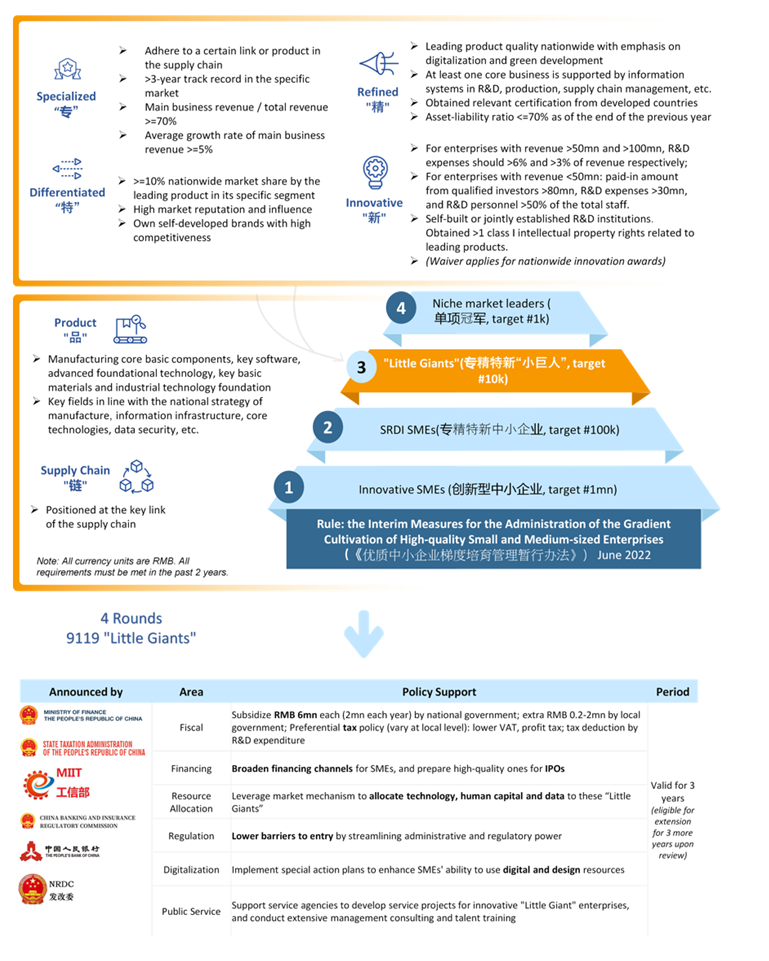
Exhibit 21: Case studies: Policy support to Little Giants in Zhejiang and Guangdong
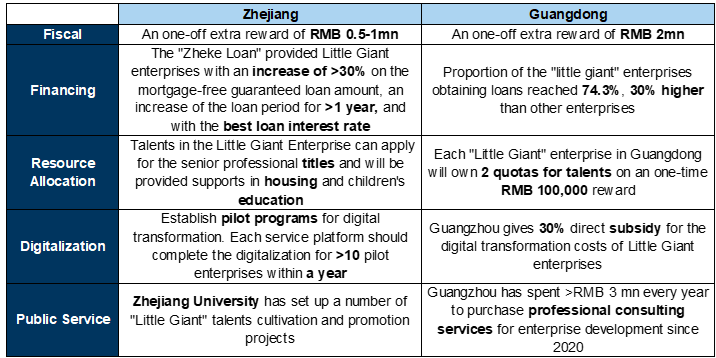
Exhibit 22: Media/policy emphasis on SRDI SMEs, notably "Little Giants", has been on a rise
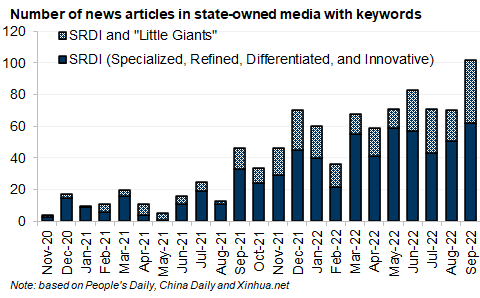
Exhibit 23: Many "Little Giants" are listed on ChiNext, followed by the STAR Board
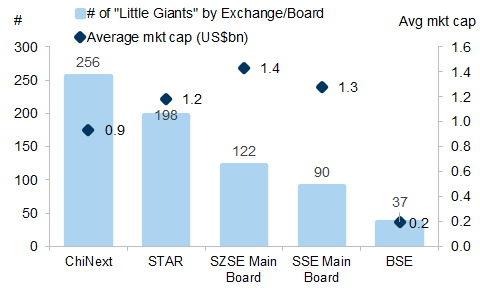
Exhibit 24: Sectorally, "Little Giants" are mainly concentrated in (New) Materials, Cap Goods, Hardware Tech, and Semi
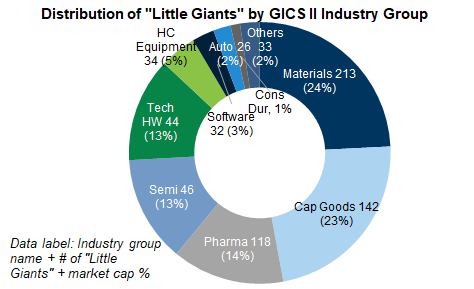
Exhibit 25: Many "Little Giants" are small/mid caps and have relativley thin liquidity at the tail end
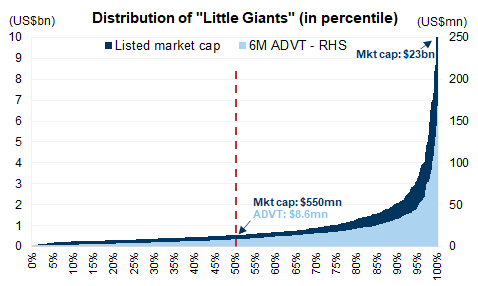
Exhibit 26: "Little Giants" are expected by WIND consensus to deliver similar profit growth as their ChiNext and STAR peers in the next 2 years
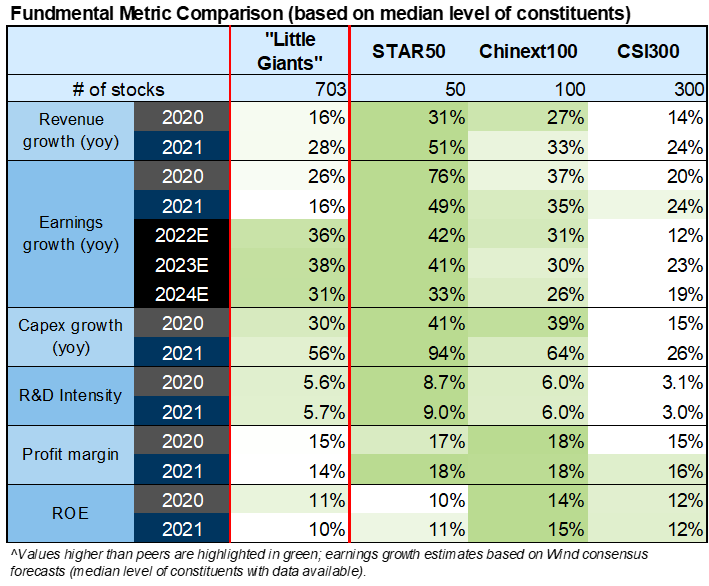
Exhibit 27: "Little Giants" are trading on lower PE and PB relative to ChiNext and STAR stocks
Introducing GS "Little Giants" Portfolio (GSSRCNLG)
While the “Little Giants” story seems compelling to us and could be a major source of potential alpha generation in the years to come, it might not be a practical theme for some investors given its broad universe (703 stocks, 57 sub-industries), small/mid cap bias, limited sell-side footprint, and other corporate governance concerns (e.g. accounting standards, ESG compliance).
As such, we leverage various top-down growth, valuation, and R&D parameters, corporate-governance related considerations such as the breadth of sell-side coverage and management incentive plans, and accessibility factors (ADT and Northbound eligibility) to distill the broad theme into a more confined universe.
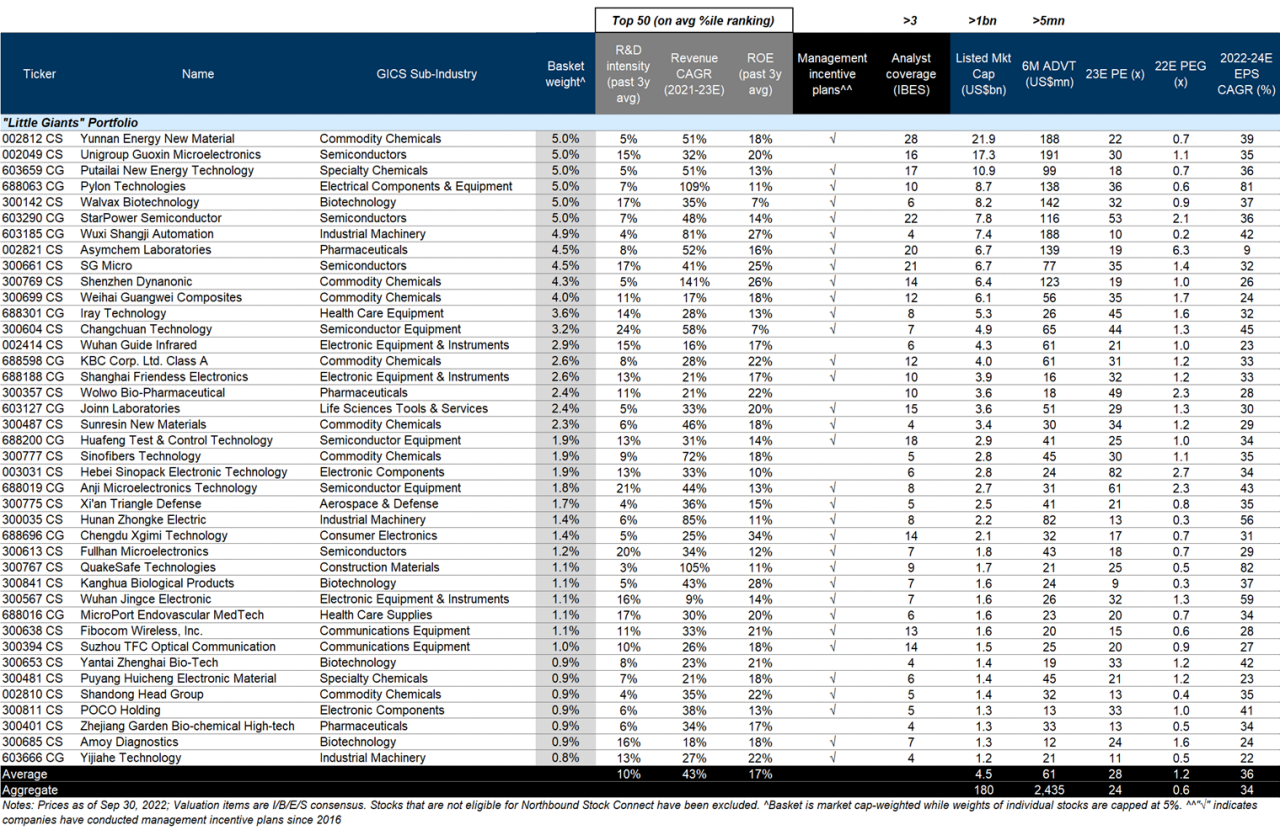
The above conditions allow us to screen for 40 names (all Northbound Connect eligible) from 17 sub-industries and form our GS "Little Giant" Portfolio (GSSRCNLG), of which 13 are covered by our equity analysts. Sectorally, 85% of the basket weights are concentrated in Tech (Hardware), Materials, and Health Care. It has an aggregate/average market cap of US$180bn/4.5bn and ADT of US$2bn/61mn, trades on 25x fP/E and 0.8x fPEG, and is expected by IBES consensus to grow earnings by 36% CAGR over the next 2 years. While its absolute valuations look high, the portfolio is trading on all-time lows in fP/E and fPEG terms, both at -2.1 s.d. to their respective historical means.
Our back-test shows that the basket has gained 115% since 2020, significantly outperforming CSI500, CSI300, and MSCI China by 109pp, 123pp, and 146pp respectively. It has demonstrated a beta of 1.1 to CSI500, but only 1.0 to CSI300/ChiNext and 0.8 to STAR, suggesting that it could be an effective vehicle to buy Growth in China without taking excessive beta risk.
Exhibit 28: The constituents spread across 17 sub-industries, with a strong "Hard Tech" flavor
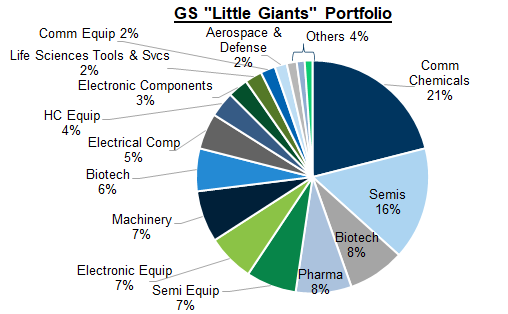
Exhibit 29: The basket has gained 115% since 2020, outperforming CSI500, CSI300 and MXCN by 109pp, 123pp and 146pp respectively
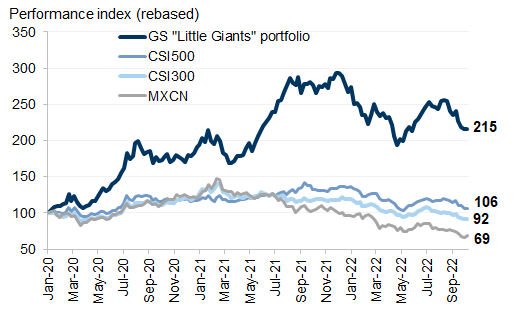
Exhibit 30: The basket is trading at historically low valuations in both PE and PEG terms
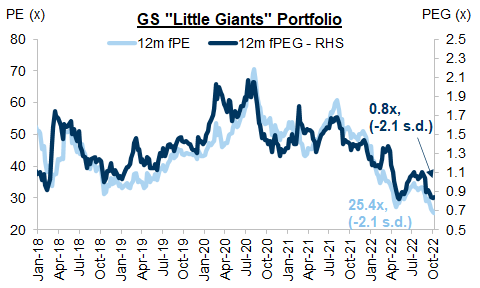
Exhibit 31: The basket has been less volatile compared with ChiNext and STAR
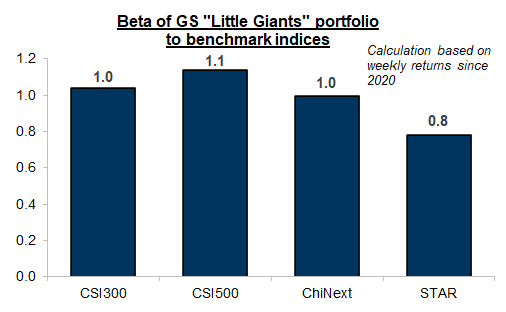
Exhibit 32: The constituents of our Little Giants Basket (GSSRCNLG)
Appendix
Exhibit 33: Policy focuses are evolving in China as the economy grows, as exemplified by the four 5-Year Plans in the past 2 decades
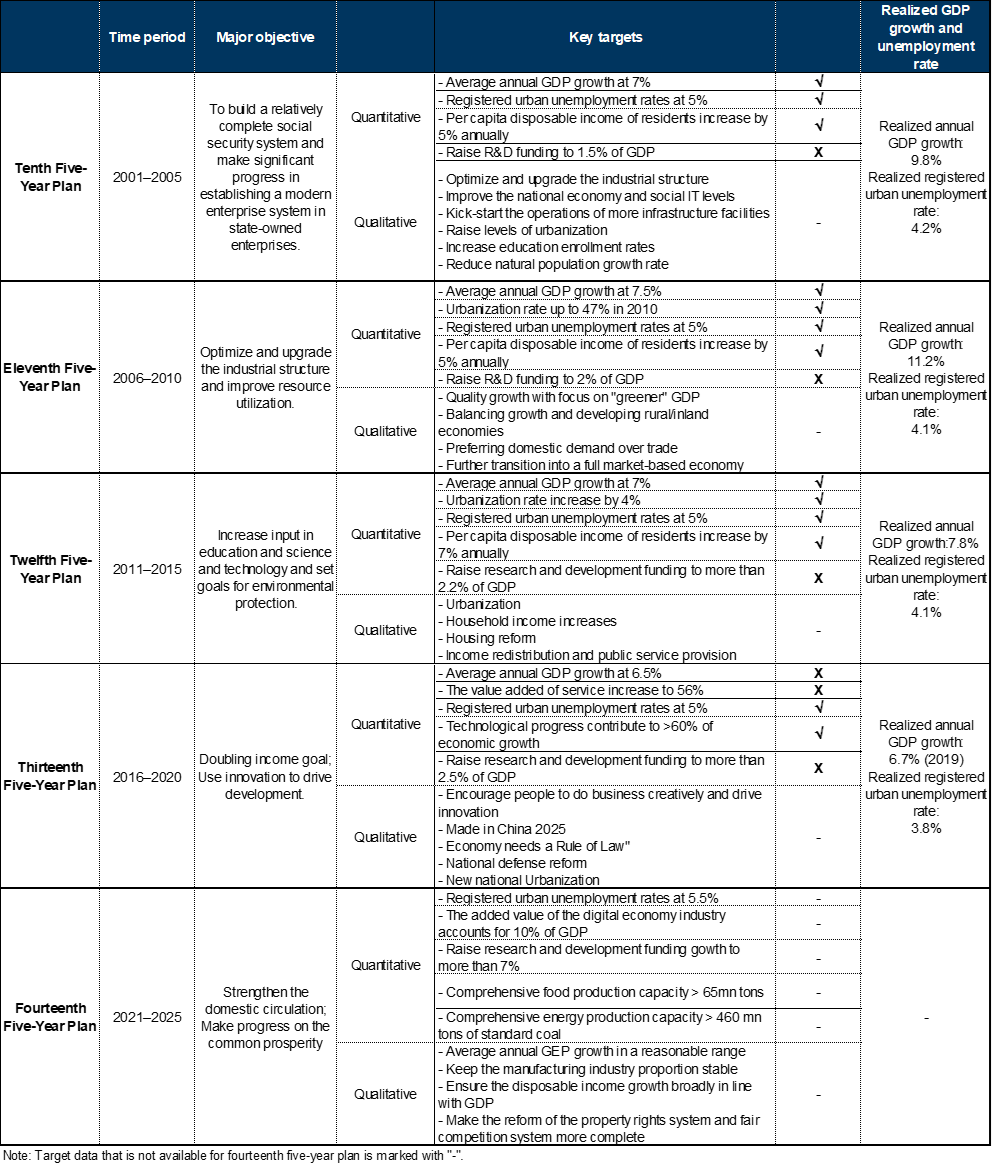
Exhibit 34: 134 names in the existing MSCI China universe had returned more than 10x within any 5-year periods over the past 20 years
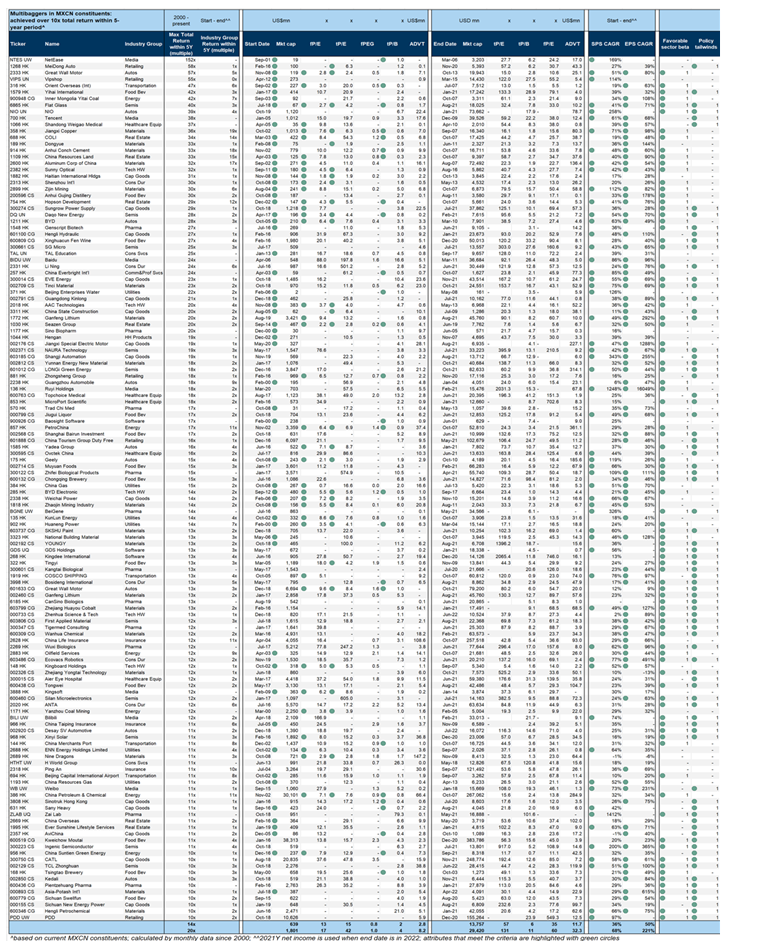
Exhibit 35: Distribution of multi-baggers by starting year & sector
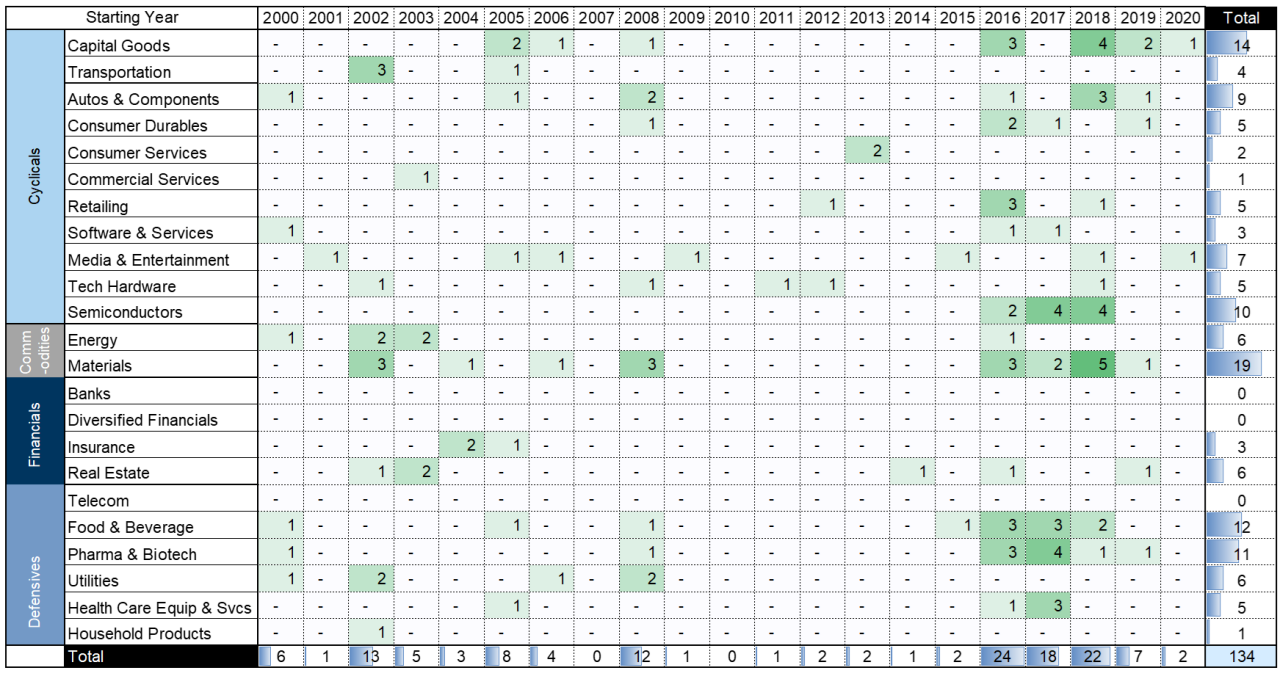
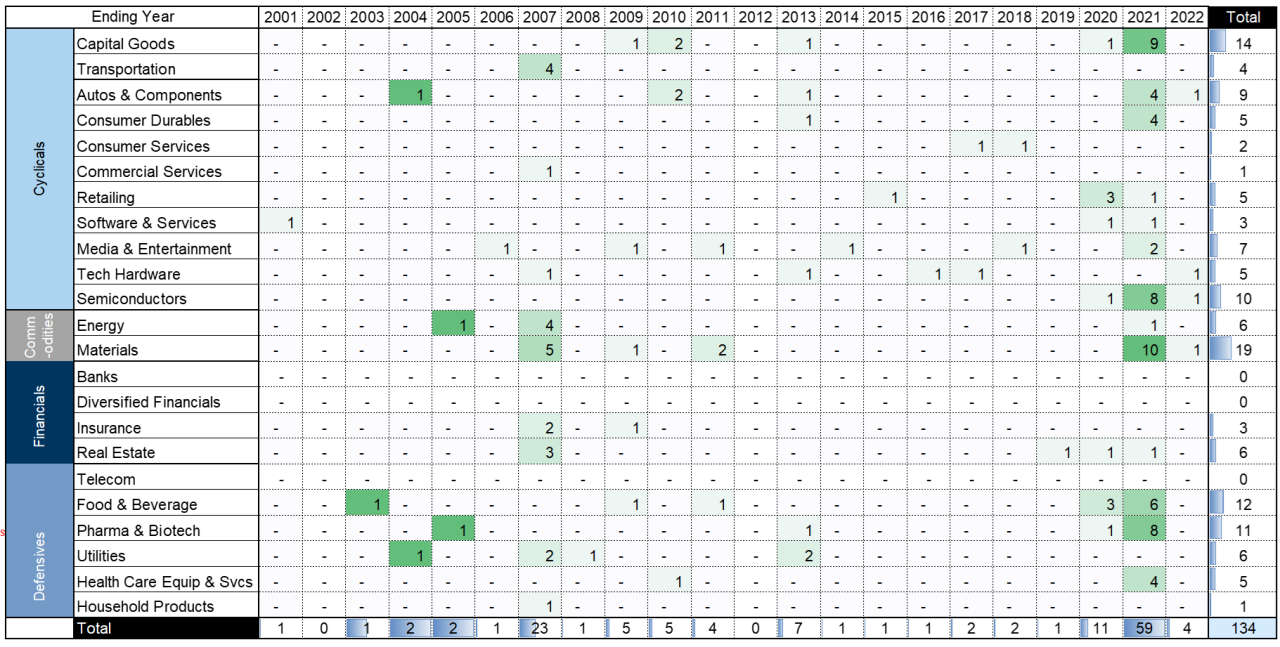
Exhibit 36: Distribution of multi-baggers by ending year & sector
Investors should consider this report as only a single factor in making their investment decision. For Reg AC certification and other important disclosures, see the Disclosure Appendix, or go to www.gs.com/research/hedge.html.