Policy rates have risen sharply this year, and investors are focusing on how much longer hiking cycles will continue and when central banks will start to cut. We document four stylized facts from 85 prior hiking and subsequent easing cycles from 1960 till 2019 across G10 economies.
First, G10 hiking cycles lasted just over 15 months on average, and 70% of historical cycles lasted longer than a year. Cycles tend to be longer in the US but shorter in the UK, Canada, and Australia. Surprisingly, the length of hiking cycles is similar across high and low inflation episodes.
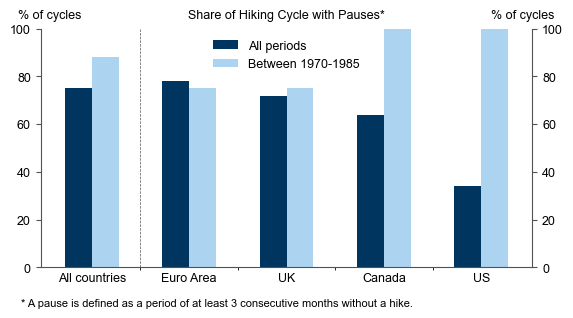
Second, longer historical cycles did not necessarily involve much larger increases in the policy rate. In fact, the policy rate increased by 200bp in the median G10 hiking cycle, and by only 400bp in the 1970s. This largely reflects central banks front-loading, and it also suggests that central banks may turn significantly more cautious and slow down the pace if they do hike for longer. In fact, 75% of G10 hiking cycles featured a pause.
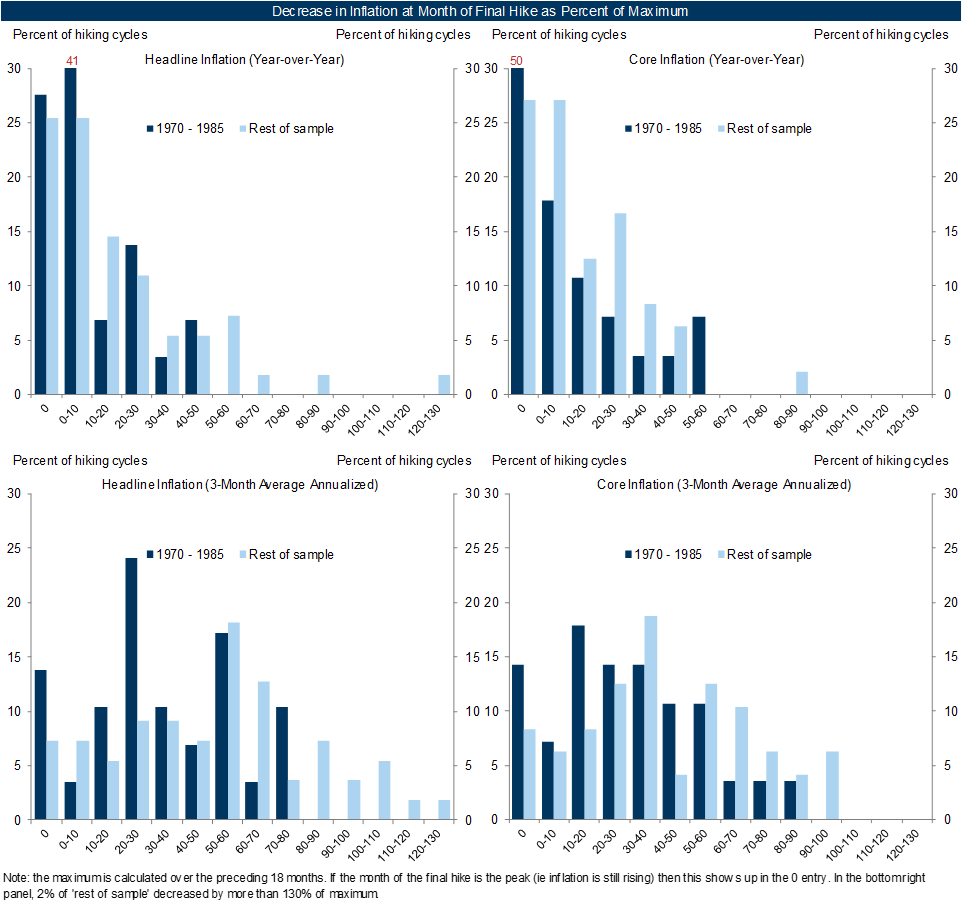
Third, central banks tend to stop hiking when year-over-year inflation is still relatively close to its peak without necessarily having fallen significantly. On average, hiking cycles ended when year-over-year inflation was within 10% of its peak (e.g. down from 5% to 4.5%).
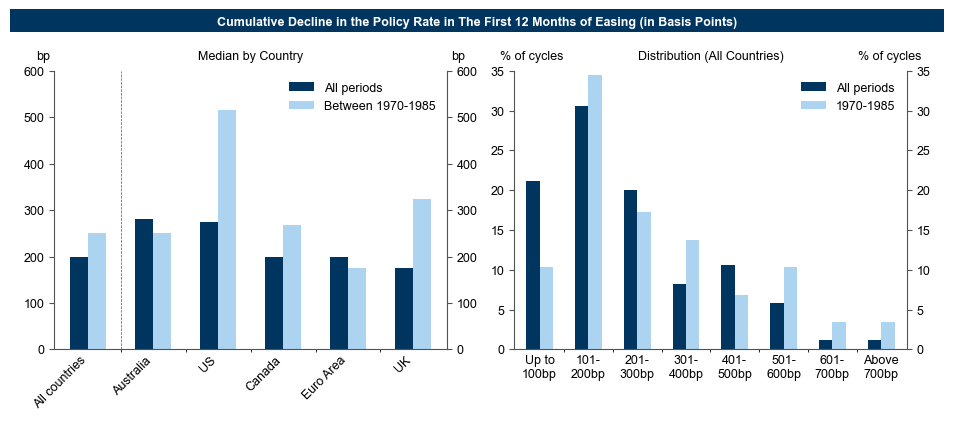
Fourth, relatively large rate cuts tend to come fairly soon after the hiking cycle ends. In the median cycle, the first cut came seven months after the last hike with a cumulative 200bp of easing within the first year. Across the G10, roughly 75% of the cycles involved a first cut within a year after the last hike.
This analysis supports our view that the hiking cycle may extend further into 2023. However, even if cycles extended deeper into next year, our findings also suggest that central banks are likely to slow the pace, such that the terminal rate does not increase too much. And there is a risk that central banks surprise markets when they turn more cautious as the bar for realized improvement in inflation could be lower than expected. Indeed, the BoC and RBA have already slowed down, and the ECB signaled a similar intent on Thursday. Finally, rate cuts could come relatively quickly after the last hike. An important caveat to these findings is that the current post-pandemic cycle remains very unique.
G10 Hiking and Cutting Cycles: Lessons from History
Historical Cycles Last Over a Year
Exhibit 1: Historically, Hiking Cycles Have Been Longer, Especially for the US
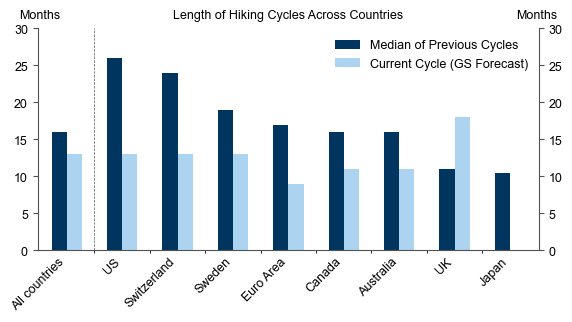
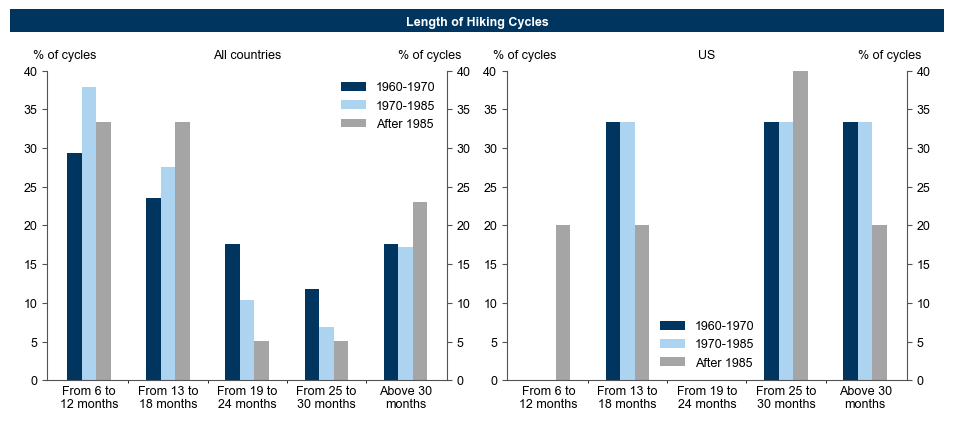
Exhibit 2: The Length of Hiking Cycles Has Not Changed Much Over Time
The Policy Rate Increases by 200bp in an Average Cycle
Exhibit 3: On Average, Policy Rates Increased Only 400bp Even in the 1970s
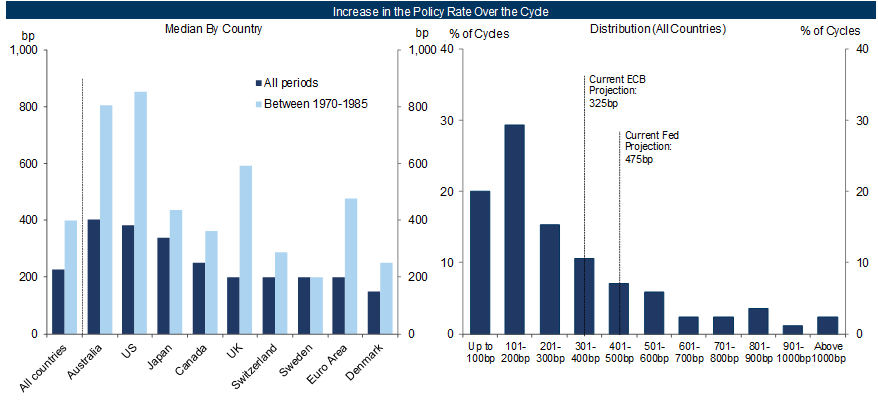
Exhibit 4: Financial Stability Concerns Are Re-Emerging Among Central Bankers
Exhibit 5: A Longer Cycle May Also Involve Pauses as Central Banks Become More Cautious
Central Banks Stop Hiking Before Year-Over-Year Inflation Falls Much
Exhibit 6: Historically, Central Banks Have Stopped Hiking When Inflation Is Peaking
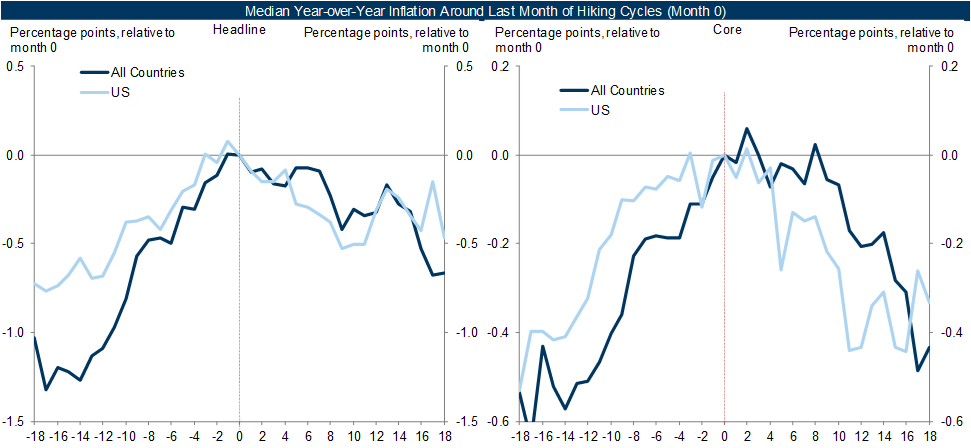
Exhibit 7: On Average, Hiking Cycles End When Year-Over-Year Inflation Is Within 10% Of Its Peak, Although Sequential Measures Tend to Have Fallen More
Large Cuts Follow Relatively Soon
Exhibit 8: On Average, Central Banks Cut 7 Months After the Last Hike…
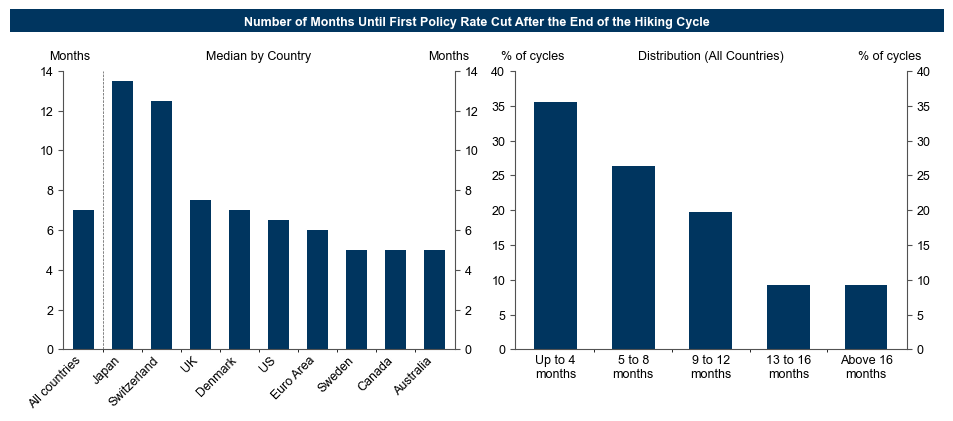
Exhibit 9: …And Then Cut by an Average of 200bp in the First Year of the Easing Cycle
Back to the Present
Sid Bhushan
Giovanni Pierdomenico*
Appendix
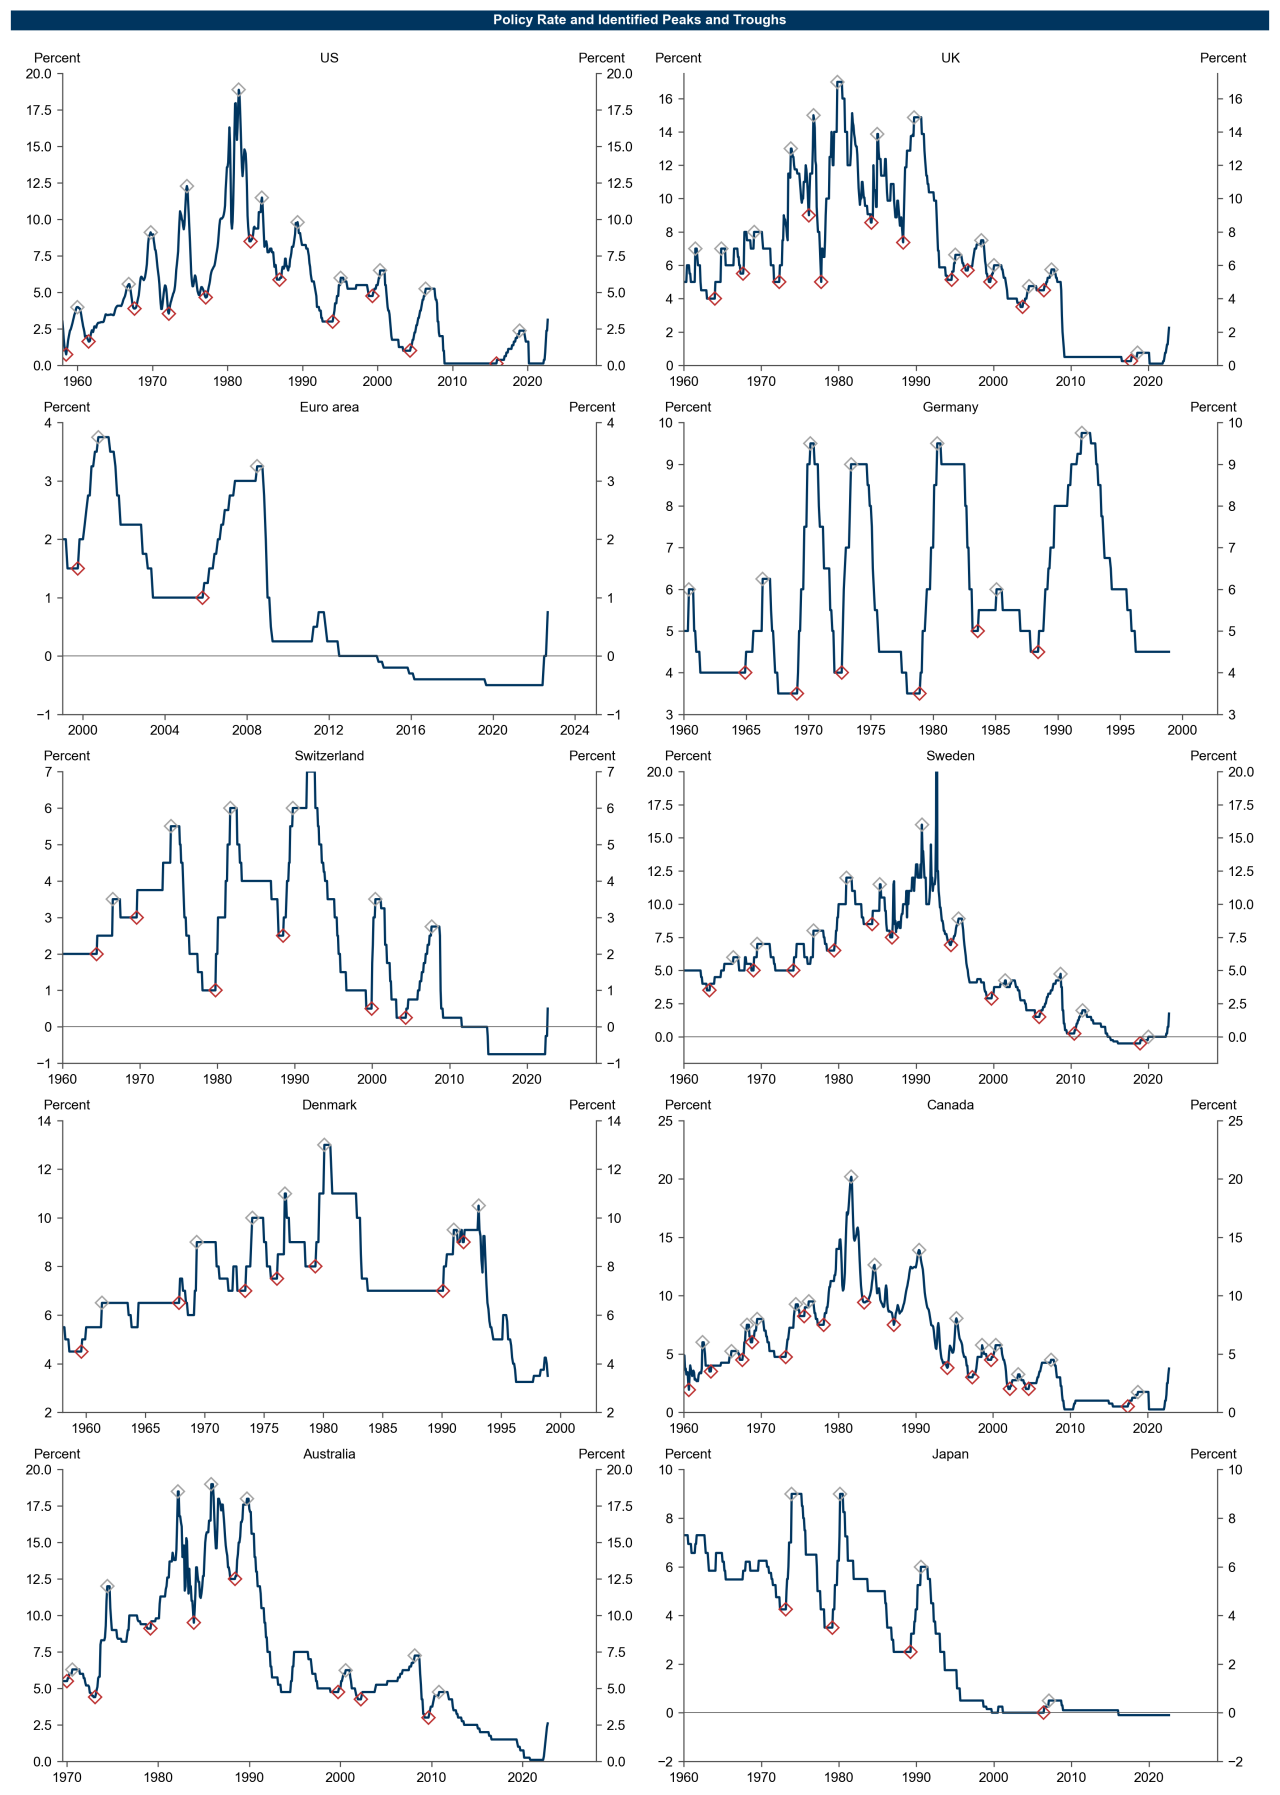
- 1 ^ Our sample includes the US, UK, Switzerland, Sweden, Denmark, Canada, Australia, Japan, and Euro area (Germany used before formation of Euro area). We define cycle peaks when the policy rate is not exceeded for at least 15 months and troughs as the minimum between two peaks. We only keep cycles that last at least six months. We also make some manual adjustments to the cycle dates. In the US, we consider the 3-month moving average of the effective federal funds rate between January 1960 and August 1982. In Canada, we consider the 3-month moving average of the bank rate/overnight rate between April 1980 and January 1996. Appendix 1 shows all hiking cycles.
- 2 ^ While the gap between the previous cycles and current cycle median bar for "All countries" in Exhibit 1 is only 3 months, the median of the gaps between bars for each country (excluding Denmark and Japan) is 6 months.
- 3 ^ This suggests that a meeting pause (for central banks that have 8 meetings per year) is more likely than a pause as we define it.
Investors should consider this report as only a single factor in making their investment decision. For Reg AC certification and other important disclosures, see the Disclosure Appendix, or go to www.gs.com/research/hedge.html.