- Intro
- 1. Four Major Themes for the Global Economy
- 2. Back to the Future — Lessons from the Past for What Lies Ahead
- 3. Our Long-Term Projections — The Rising Importance of Major EMs
- 4. Global Implications — Slower Global Growth, Reduced Global Inequality
- 5. Investment Implications — EM Unlikely to Continue to Underperform
- Appendix 1: Our Methodology in Detail
- Appendix 2: Forecast Summary
- Bibliography
Two decades since we first set out long-term growth projections for the BRICs economies, we are updating and expanding those projections to cover 104 countries out to 2075. We identify four major themes for the global economy:
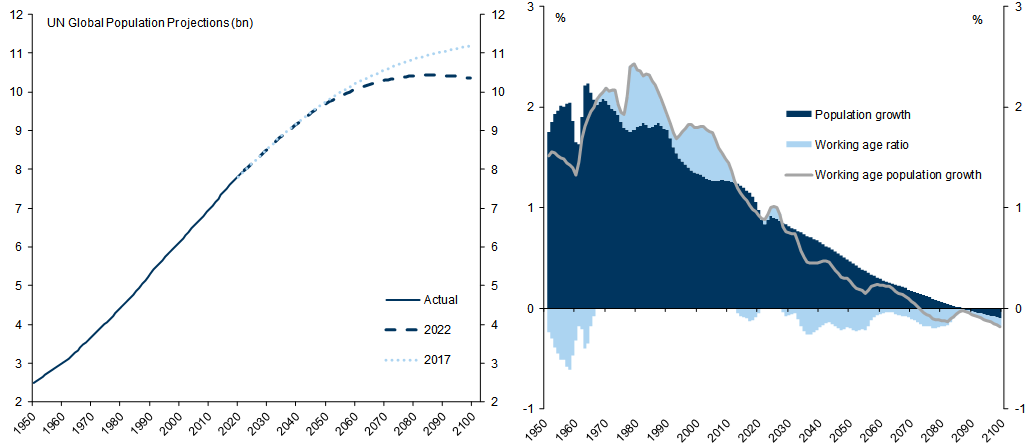
Theme #1: Slower global potential growth, led by weaker population growth. Our projections imply that global growth will average a little under 3% per year over the next ten years and will be on a gradually declining path, primarily reflecting slower labour force growth. Global population growth has halved over the past 50 years, from 2% per year to less than 1%, and is expected to fall to close to zero by 2075.
Theme #2: EM convergence remains intact, led by Asia’s powerhouses. Although real GDP growth has slowed in both developed and emerging economies, in relative terms EM growth continues to outstrip DM growth. Our projections imply that the world's five largest economies in 2050 (measured in real USD) will be China, the US, India, Indonesia, and Germany (with Indonesia displacing Brazil and Russia among the largest EMs). By 2075, with the appropriate policies and institutions, Nigeria, Pakistan and Egypt could be among the world's largest economies.
Theme #3: A decade of US exceptionalism that is unlikely to be repeated. The US's relative performance has been stronger than expected over the past decade. However, history suggests it is unlikely to repeat this over the next decade. US potential growth remains significantly lower than that of large EM economies, and we expect some of the US Dollar’s exceptional strength of recent years to be unwound over the next 10 years.
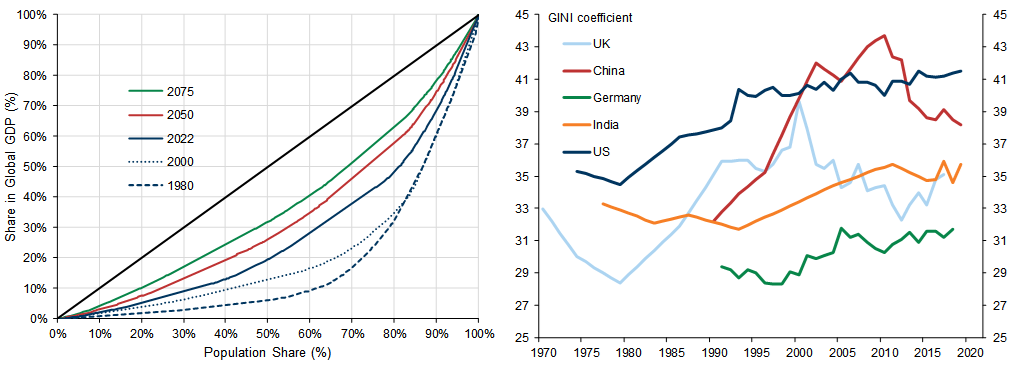
Theme #4: Less global inequality, more local inequality. Twenty years of EM convergence has resulted in a more equal distribution of global incomes. However, while income inequality between countries has fallen, income inequality within countries has risen. This poses a major challenge to the future of globalisation.
1. Four Major Themes for the Global Economy
We thank Jan Hatzius, Andrew Tilton, Kamakshya Trivedi, Hui Shan, Andrew Matheny, Goohoon Kwon and Santanu Sengupta for their helpful comments.
Exhibit 1: Global Potential Growth on a Gradually Declining Path
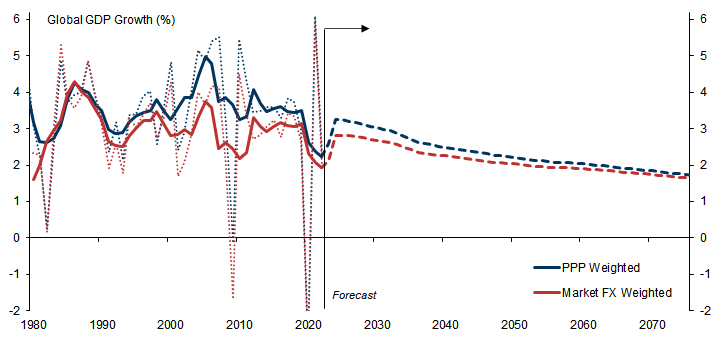
Exhibit 2: Global Population Growth Has Halved Since the 1960s/70s and The Projected Peak Population is Now Falling

Exhibit 3: Although Growth Has Slowed in Both DMs and EMs, EM Income Convergence Remains Intact
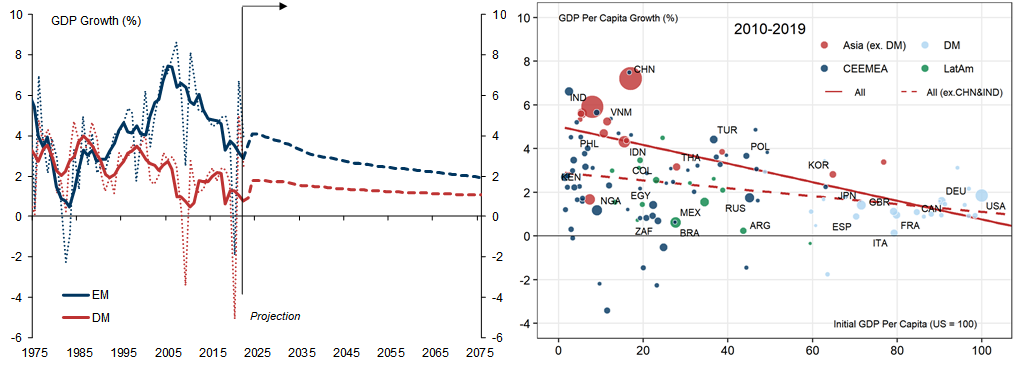
Exhibit 4: Our Projections Imply that China, the United States, India, Indonesia, and Germany Will be the World's Five Largest Economies in 2050
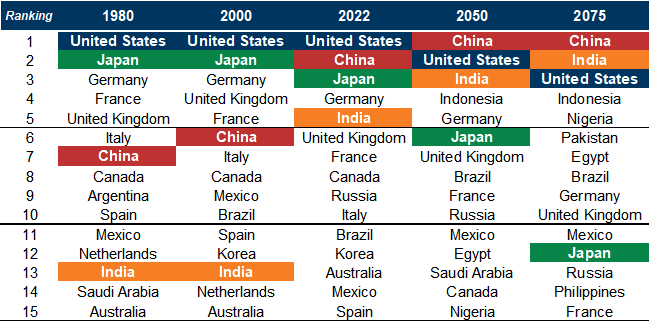
Exhibit 5: China to Overtake US in Around 2035, While India Should Catch up By 2075; EM Leaderboard to Change Significantly by 2075
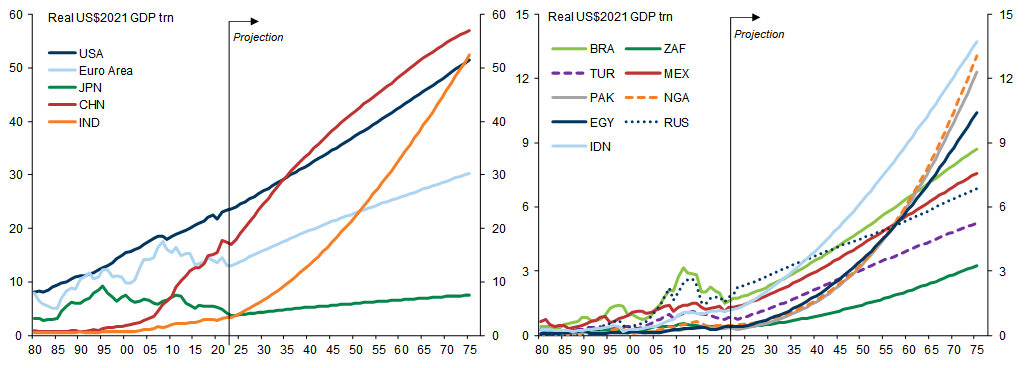
Exhibit 6: Cross-Country Inequality to Continue Declining, While Within-Country Inequality Remains High

First, the risk that populist nationalism leads to increased protectionism and a reversal of globalisation. Populist nationalists have gained power in several countries and the supply chain disruptions during the Covid pandemic have resulted in an increased focus on on-shoring and supply chain resilience. At least to date, this has led to a slowdown rather than a reversal of globalisation, in our assessment. However, the risk of a reversal is clear. Globalisation has been a powerful force in reducing income inequality across countries but, to ensure that it continues to do so, greater efforts need to be made to share its benefits more equally within countries.
Second, the risk of environmental catastrophe presented by climate change. We reject the view that economic growth and environmental sustainability are incompatible – many countries have been able to 'de-couple' economic growth from carbon emissions, so there is no practical reason why this should not be achievable for the global economy as a whole. But achieving sustainable growth requires economic sacrifices and a globally coordinated response, both of which will be politically difficult to achieve.
2. Back to the Future — Lessons from the Past for What Lies Ahead
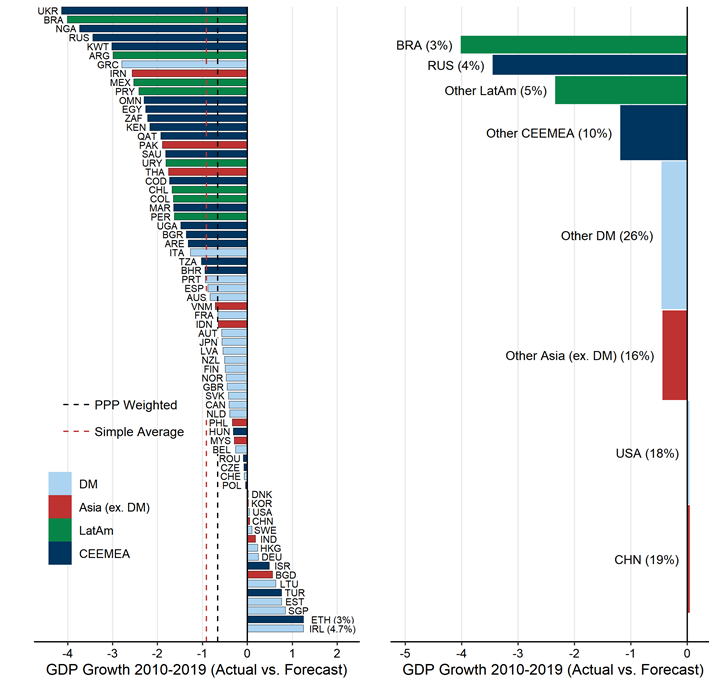
Exhibit 7: GDP Growth Has Averaged 0.6pp Weaker than We Expected in 2011
A Smaller Gap Between EM and DM Growth
Exhibit 8: EM Outperformance Only Became the Norm in the late 1990s; The Gap Between EM and DM Growth Has Narrowed in Recent Years But Remains Substantial
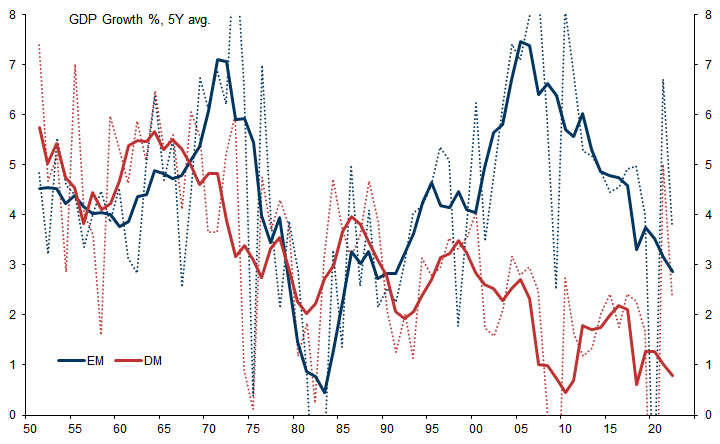
Exhibit 9: GDP Growth in China and EM Asia Has Consistently Outstripped DM Growth Since the 1980s, CEEMEA Has Outperformed Since 2000, While the Performance of LatAm Remains Mixed
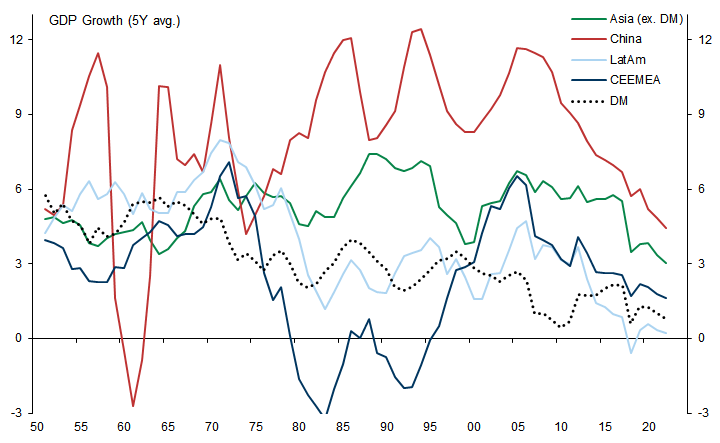
Asia Continues to Lead the Way, But EM Convergence Has Become More Generalised
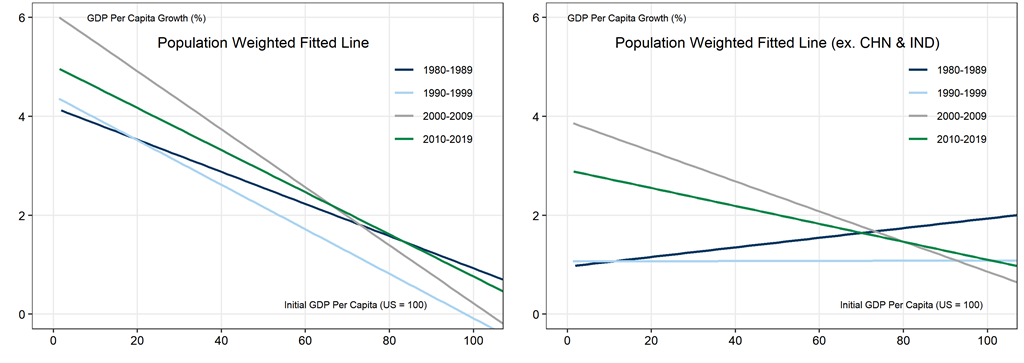
Exhibit 10: GDP Per Capita Growth Has Been Faster in Low-Income Economies than in High-Income Economies, Especially Since 2000; China and India Have Displayed Rapid Convergence
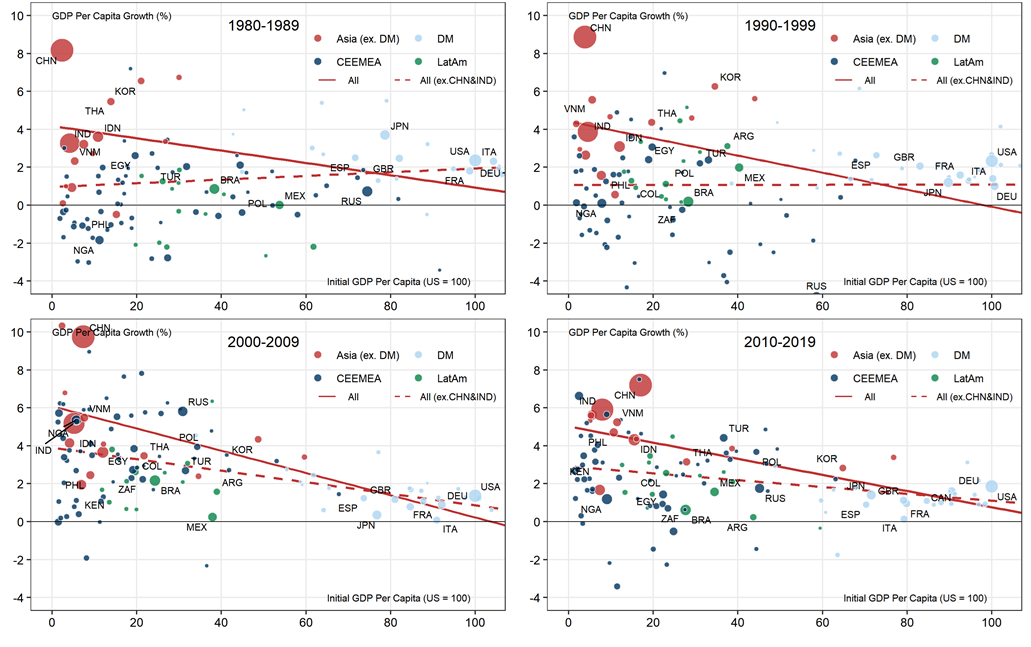
Exhibit 11: GDP Per Capita Has Converged Rapidly Since 2000; But Per Capita Growth has Slowed Everywhere Since 2010
Slower Global Growth Due to Weaker Labour Force Growth and ‘Slowbalisation’
A slowdown in the pace of technological progress, which is likely to be relatively permanent in nature and which policymakers can do little to alleviate.[9]
A slowdown in the pace of globalisation in the aftermath of the Global Financial Crisis.
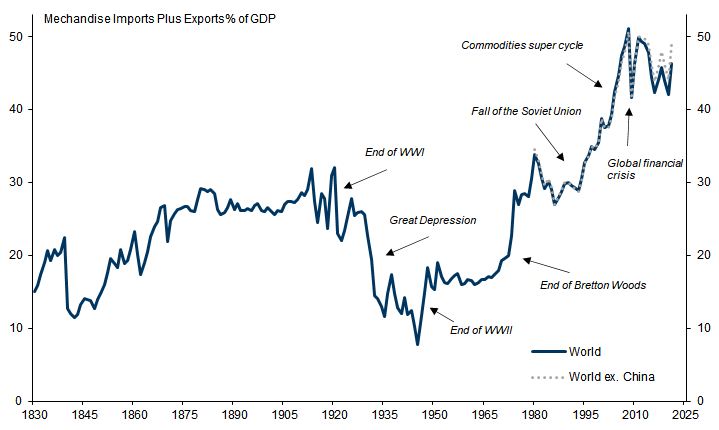
Exhibit 12: Global Goods Trade Peaked as a Share of GDP in 2008
Box 1: The Conditions for Growth
Institutional quality: ‘Institutions’ are broadly defined in this context to cover everything from well-defined property rights and fair tax systems to the consistent application of the rule of law. Simply put, there is little incentive to invest if property ownership and/or revenues are at risk of being arbitrarily expropriated.[14]
Openness to trade: Openness to trade and FDI provides access to larger markets and new technology, and is consistently found to be a necessary condition in driving long-term economic growth.
Education: As economies grow rapidly, they require a steady supply of skilled workers, meaning that more years of schooling are a prerequisite for sustaining economic development.
Macro stability: An unstable macro environment can hinder economic development by making future returns more uncertain and by distorting prices and incentives.
Infrastructure quality: Transport infrastructure, reliable electricity supply and, increasingly, internet access are important elements in ensuring ongoing development.
3. Our Long-Term Projections — The Rising Importance of Major EMs
Exhibit 13: A Gradual Slowdown in Global Economic Growth, With EM Growth Continuing to Outstrip DM
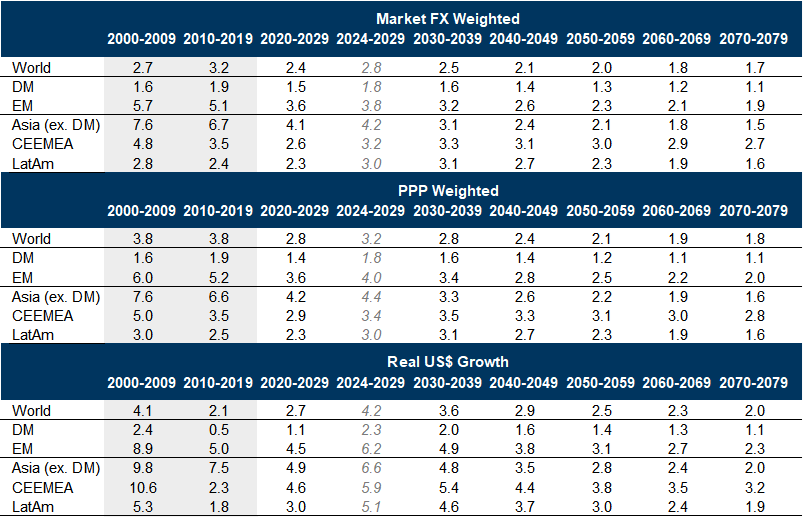
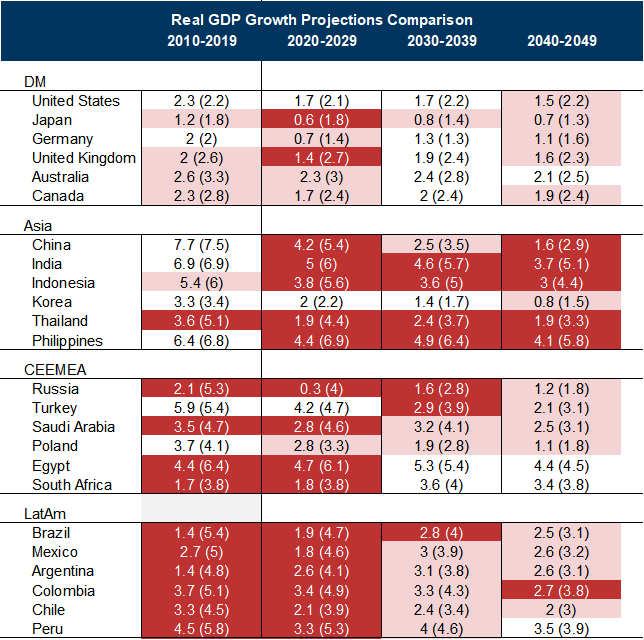
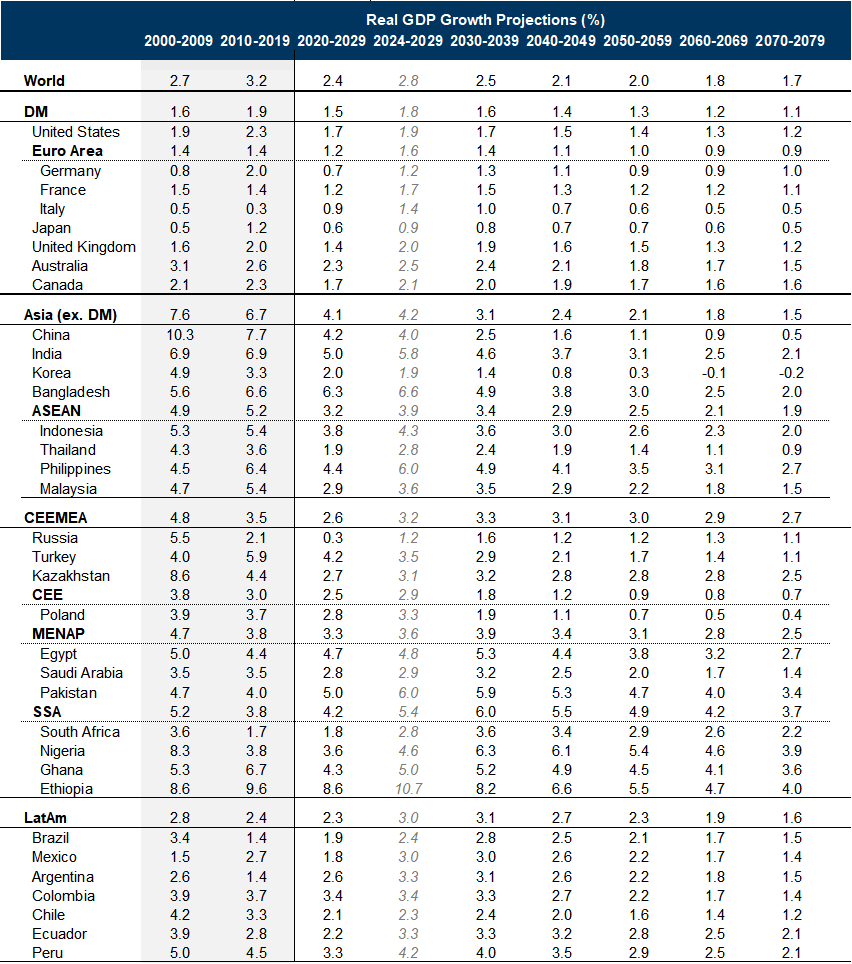
Exhibit 14: Real GDP Growth Projections for Major Economies by Decade
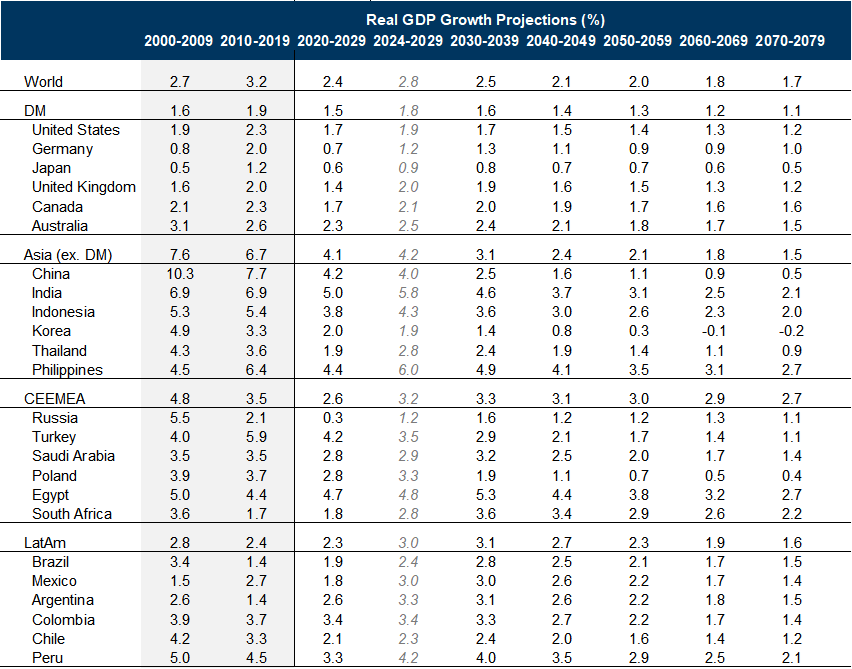
Exhibit 15: Our Projections Imply that China, the United States, India, Indonesia, and Germany Will be the World's Five Largest Economies in 2050

Exhibit 16: China to Overtake US Around 2035, While India Should Catch up By 2075; EM Leaderboard to Change Significantly by 2075

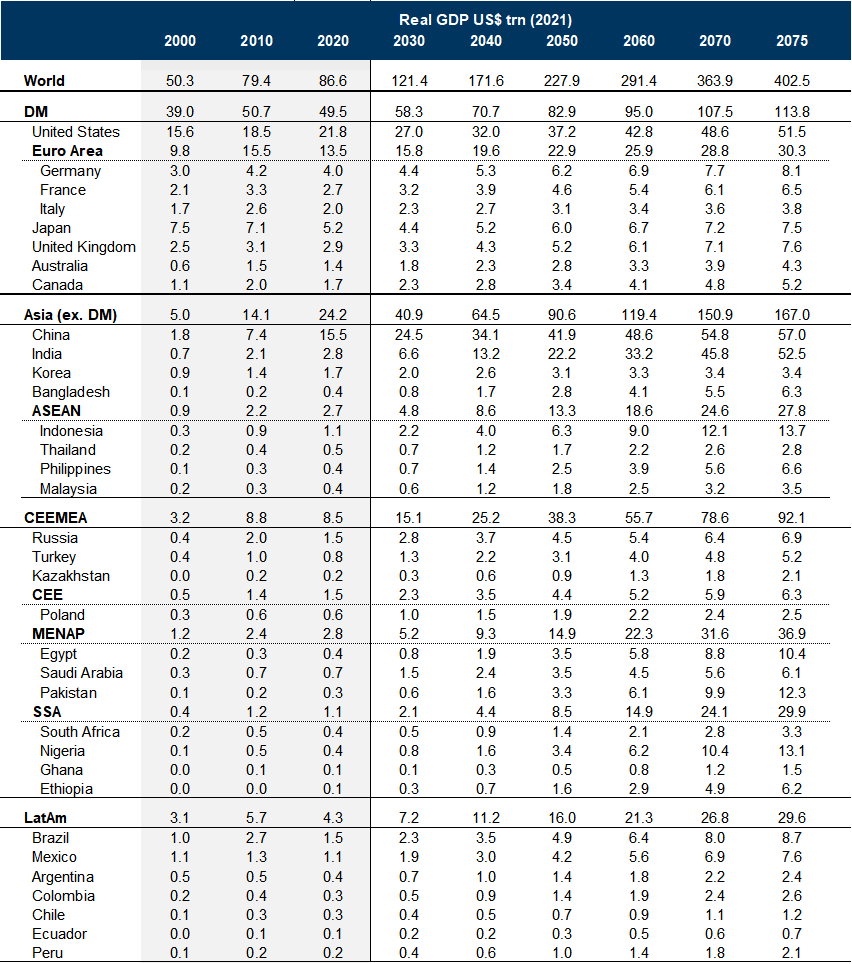
First, there is a large gap between the largest three economies (China, India and the US) and all other economies (although the Euro area represents a fourth economic superpower, if it is treated as a single economy). Thus, although Indonesia, Nigeria and Pakistan are projected to be fourth, fifth, and sixth in the 2075 GDP rankings, each of them are projected to be less that one-third of the size of China, India and the US.
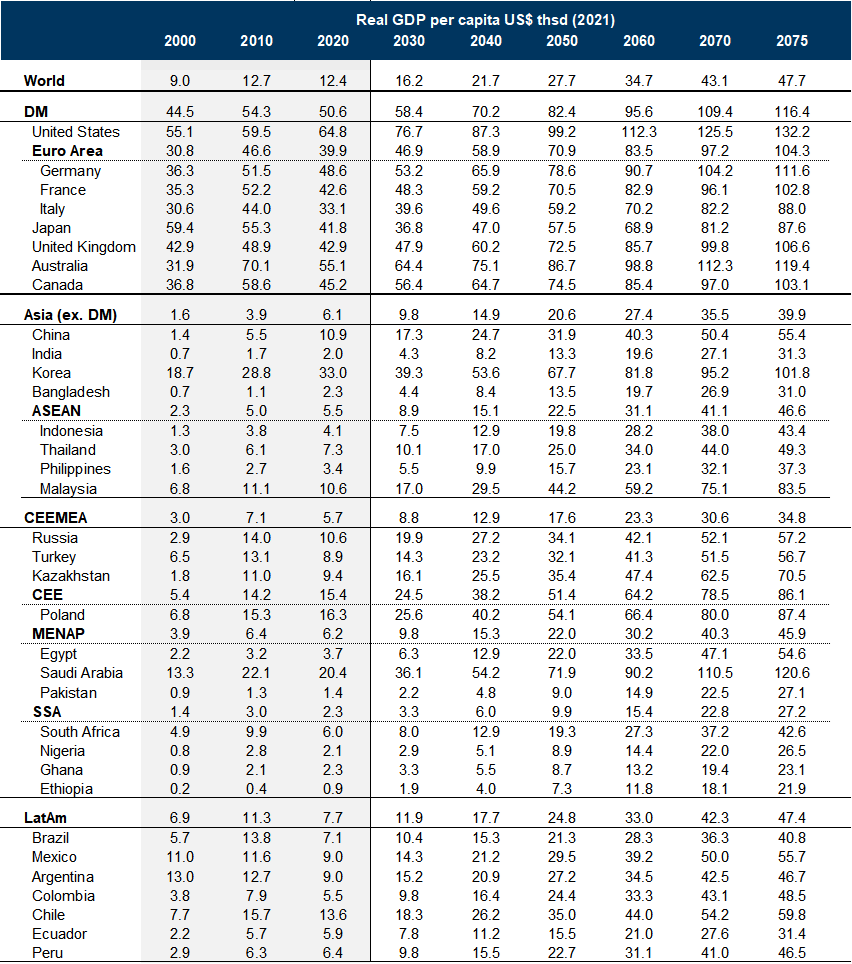
Second, while China and India are projected to be larger than the US by 2075, our projections imply that the US will remain more than twice as rich as both (and five times as rich as countries such as Nigeria and Pakistan).
Exhibit 17: China and India are Projected to be Larger than the US by 2075, But the US Will Remain More than Twice as Rich as Both
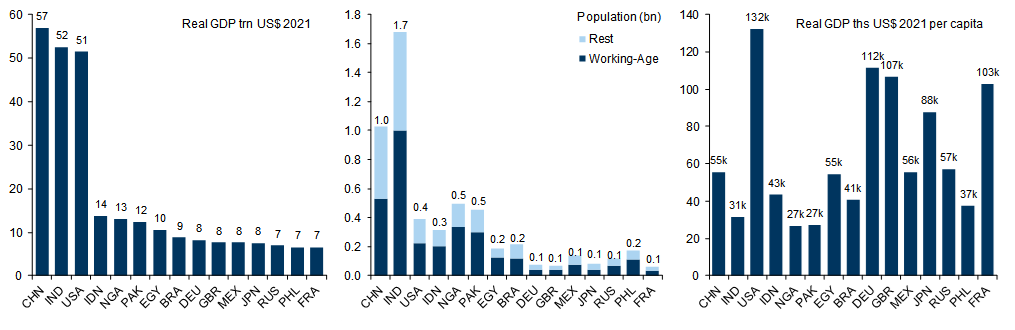
Exhibit 18: Gradual Growth Decline For Most Economies: Demographics a Large Drag for China, While Brazil and South Africa's Exceptionally Weak Performance is Expected to be Partially Reversed
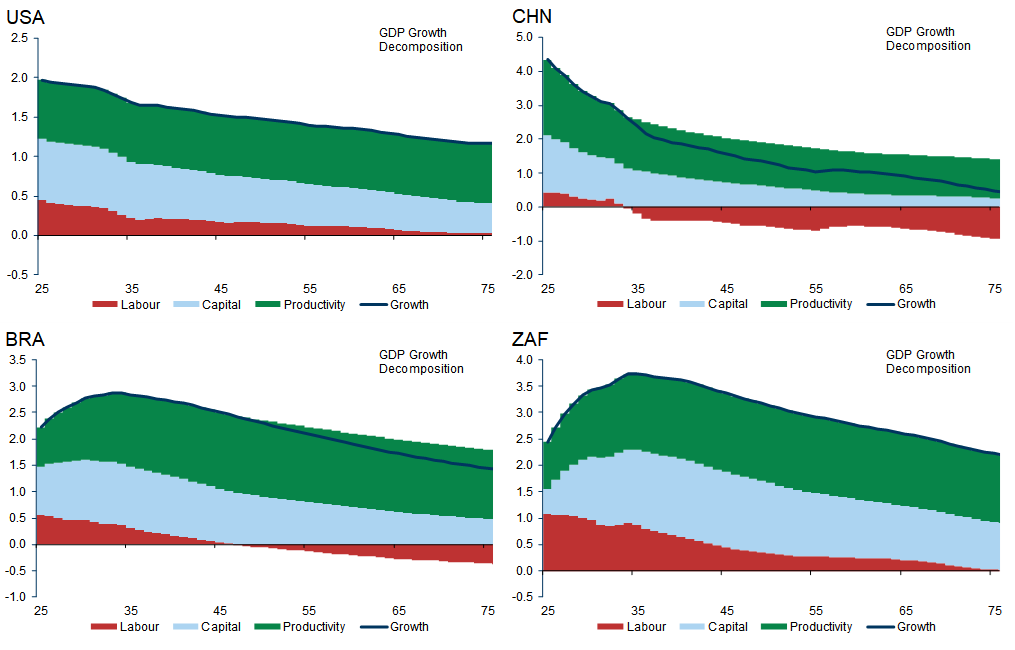
Exhibit 19: Less Optimistic on the Future: A Decadal Analysis of Updated vs 2011 Forecasts for Average GDP Growth Rates
Box 2: Our Modelling Framework
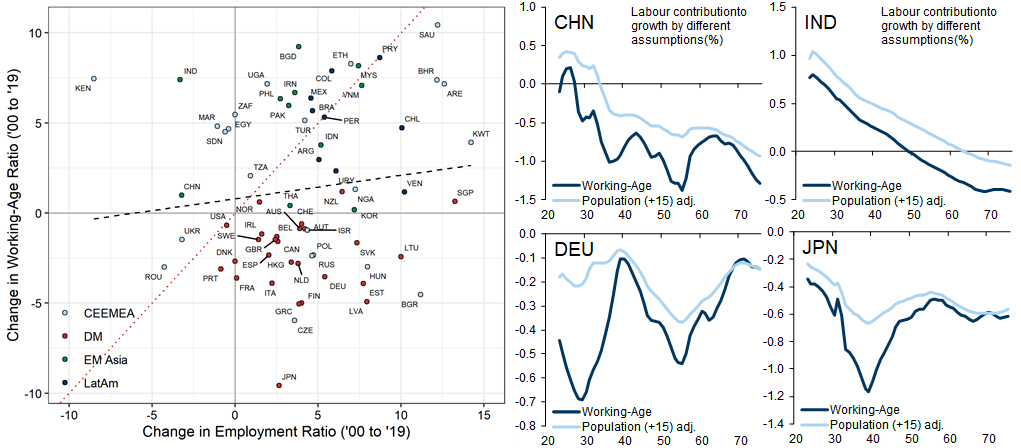
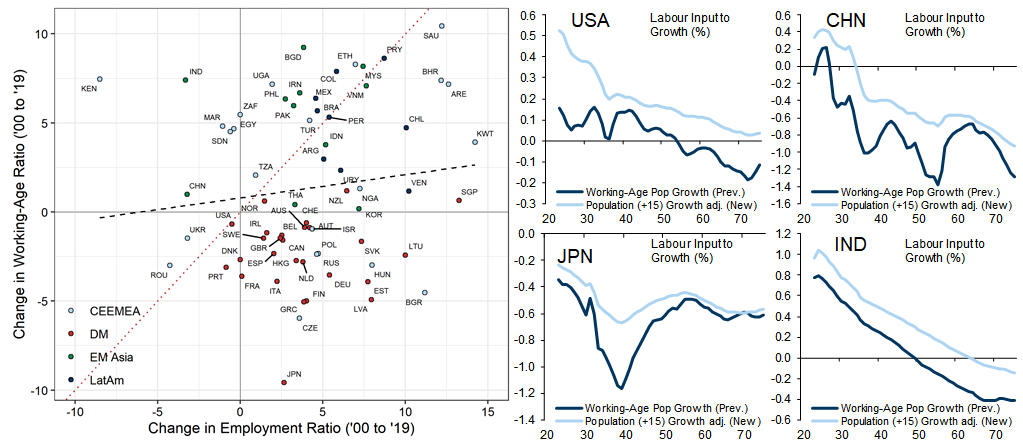
Labour Force Growth. Our labour force forecasts are based on United Nations’ population projections. However, where we previously took growth in the working age population (those aged 15-64) as an approximation for labour force growth, we now adjust for the fact that the link between working age population ratios and labour force participation ratios is far from one-to-one, because people tend to retire later as populations age. This adjustment is based on the historical relationship between changes in working age ratios and employment and, all else equal, it has the effect of boosting projected labour force growth in countries with ageing populations.
Exhibit 20: Labour Force Participation Is Weakly Related to Working-Age Population Rate, Which Implies Smaller Drag in Projections
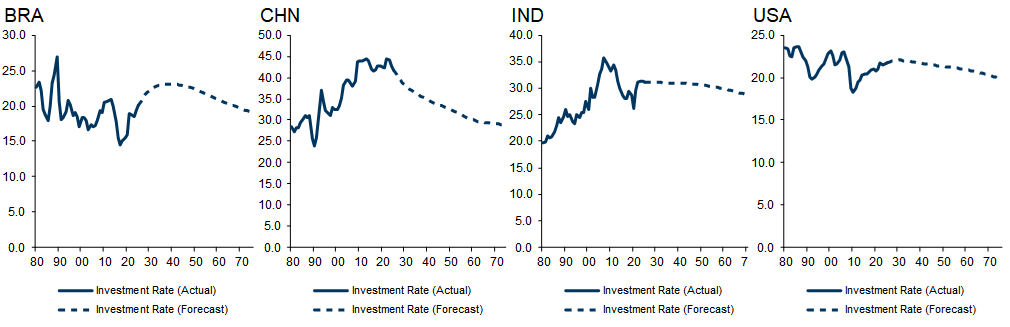
Capital Accumulation. We explicitly calculate country-specific initial capital stock levels and model each country’s investment rate as a function of demographics and its own history, which allows for investment rates to vary over time. As previously, we use the fact that investment rates appear to be linked to dependency ratios – the higher the share of working-age population relative to the young and the elderly, the higher the investment rates.
Exhibit 21: Investment Rates Modelled as a Function of Past Investment Rates and Changing Demographics
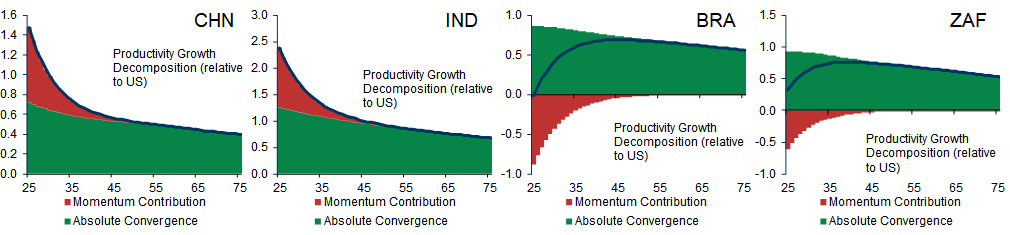
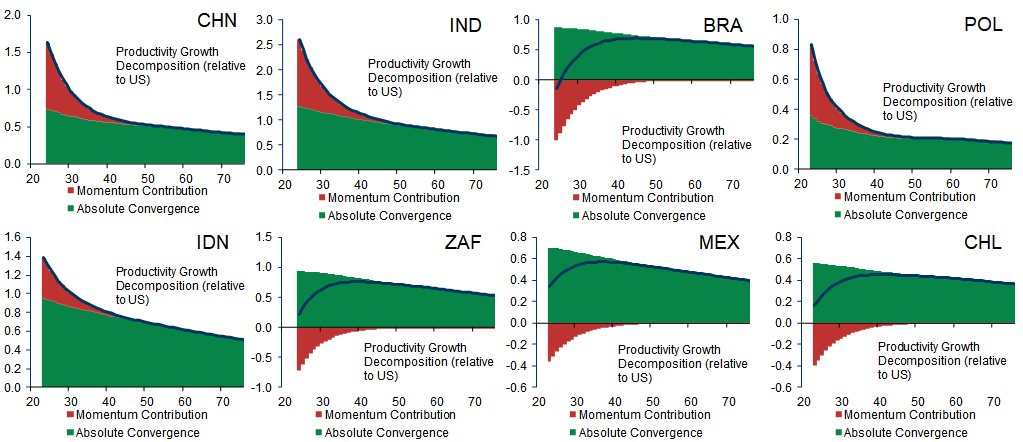
Technical Progress. We model technical progress (or total-factor productivity (TFP) growth) as a process of catch-up/convergence to the technological frontier, which we assume to be the US. For each country, the pace of convergence reflects a combination of both absolute and conditional convergence factors. Absolute convergence is modelled as a decreasing function of GDP per capita levels relative to the US. The absolute convergence term is fitted to the cross-country experience over the past 40 years and lower than in our previous projections. For conditional convergence, we previously modelled this explicitly as a function of economic, political and social factors in each country (as captured by our Growth Environment Scores (GES)). However, we found that the out-of-sample performance of these scores as predictors of future convergence was poor. We therefore take a more agnostic view of which conditions are necessary to drive convergence and instead draw inference from the performance of productivity itself: while it is difficult to identify in real time whether the 'right' factors are in place to drive future convergence, each country’s recent productivity performance reveals a lot about whether it has the 'right' factors in place today. Consistent with this observation, we find that convergence 'momentum' plays an important role in determining future convergence (i.e., if a country had the conditions in place to successfully converge over the previous decade, we find that it typically displays a higher pace of convergence over the subsequent decade, all else equal). This momentum factor is then modelled to ‘decay’ over time.
Exhibit 22: We Model Technical Growth as a Function of Absolute Convergence and Convergence Momentum
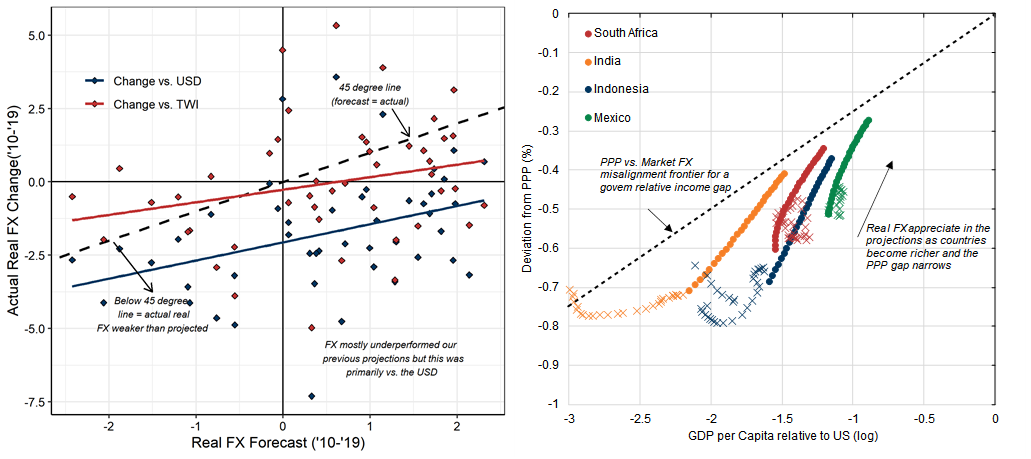
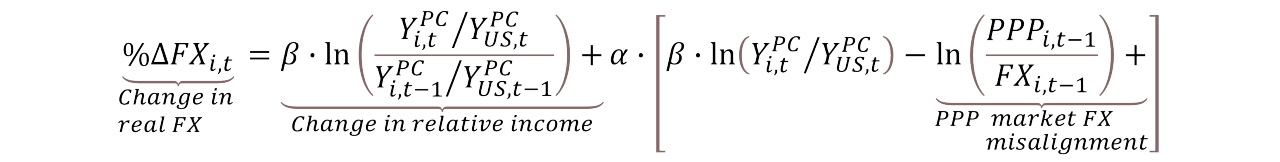
Exchange Rate Trends. We model real exchange rates as a function of relative productivity growth differentials (the Balassa-Samuelson effect), while also taking account of a country’s deviation from PPP at the starting point. In our model, a country’s real exchange rate path is determined by two processes: (1) convergence towards its PPP equilibrium rate as it grows richer; and (2) convergence towards the ‘normal’ deviation from PPP for a given relative income level (based on the historical and cross-sectional data). Over the past 10 years this model has worked relatively well, with one very prominent exception: the US Dollar itself. However, the fact that the Dollar has been stronger over the past 10 years than its PPP exchange rate would predict implies that it is more likely to depreciate over the coming 10 years.
Exhibit 23: Exchange Rates Have Converged Towards Their PPP Values, But Much Less so vs. the USD

4. Global Implications — Slower Global Growth, Reduced Global Inequality
Declining Global Population Growth — A ‘Good Problem’ to Have
Exhibit 24: Global Population Growth Has Halved Since the 1960s/70s and The Projected Peak Population is Now Falling
Reduced Global Inequality, Increased Local Inequality
Exhibit 25: Cross-Country Inequality to Continue Declining, While Within-Country Inequality Remains High
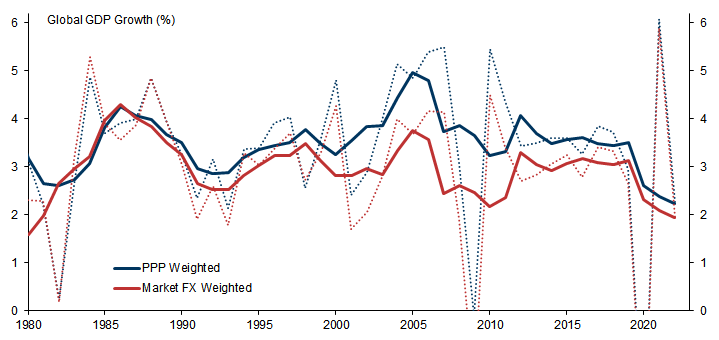
Box 3: How Fast Does the World Grow?
One approach is to use purchasing power parity (PPP) exchange rates, which calculate the rate at which the currency of one country would have to be converted into that of another country to buy the same amount of goods and services in each country. PPP-based weights adjust for the fact that goods and services are typically cheaper in relatively poor economies than in rich economies. For this reason, PPP-based weights are better designed to capture the welfare implications of global growth.
The second approach is to use market exchange rates to convert each country’s GDP into a common currency. This approach makes no adjustment for differences in spending power across economies but the weights accurately reflect the Dollar value of each economy’s GDP. For this reason, market FX weights are the more appropriate methodology from the perspective of financial markets and this is the weighting scheme that we now use in calculating global and regional aggregates.
Exhibit 26: PPP-Based Weights Typically Show Higher Global Growth than Market-Based Weights
Key Long-Term Risks: Protectionism and Climate Change
First, the risk that populist nationalism leads to increased protectionism and a reversal of globalisation. Populist nationalists have gained power in several countries and the supply chain disruptions during the Covid pandemic have resulted in an increased focus on on-shoring and supply chain resilience. At least to date, this has led to a slowdown rather than a reversal of globalisation, in our assessment. However, the risk of a reversal is clear. Globalisation has been a powerful force in reducing income inequality across countries but, to ensure that it continues to do so, greater efforts need to be made to share its benefits more equally within countries.
Second, the risk of environmental catastrophe presented by climate change. We reject the view that economic growth and environmental sustainability are incompatible – many countries have been able to 'de-couple' economic growth from carbon emissions, so there is no practical reason why this should not be achievable for the global economy as a whole. But achieving sustainable growth requires economic sacrifices and a globally coordinated response, both of which will be politically difficult to achieve. This risk is especially relevant to the long-term economic outlook of low-income economies with geographies that are especially exposed to climate change. With limited financial means to protect themselves against the costs of climate change, out-migration from these economies could dampen the demographic shifts that are projected to drive GDP growth.
5. Investment Implications — EM Unlikely to Continue to Underperform
Exhibit 27: EM Equity Returns Have Exceeded DM Returns Significantly Over Time, But There Have Also Been Two Extended Periods of Underperformance
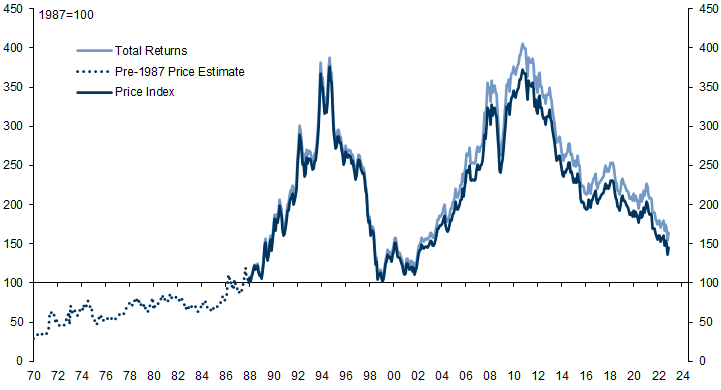
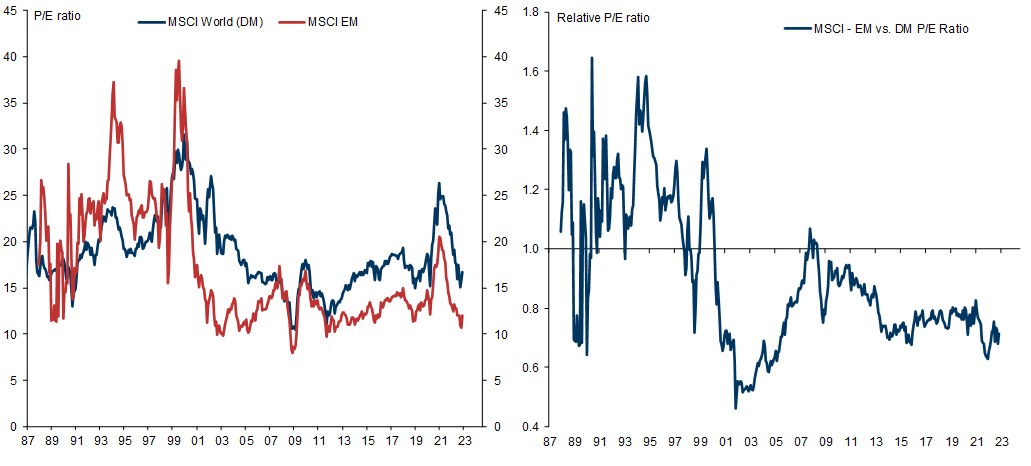
Financial markets reward and penalise unanticipated shifts in trends but are indifferent to the predictable continuation of trends. The significant outperformance of EM economies in the 2000s represented a marked shift relative to previous decades, surprising market participants in the process and resulting in significant EM asset price outperformance. Although EM economies have continued to outgrow DM economies over the past decade, they have done so by less than in the 2000s, undershooting expectations in the process and contributing to EM asset price underperformance. Now, however, following more than a decade of underperformance, EM equity valuations look unusually cheap, both in absolute terms and (especially) relative to their DM peers.[21] This suggests that the bar for positive surprises is lower than it was a decade ago (Exhibit 27).
Equity earnings growth is a function of both changes and levels of growth. Because margins are cyclical, earnings growth is as much a function of changes in GDP growth as it is a function of the level of GDP growth. One reason why EM equity earnings have underperformed DM equity earnings since 2010 is that, while EM GDP growth has outpaced DM, it has done so by less than was the case between 2000 and 2010. We expect EM GDP outperformance to stabilise in the coming years relative to DMs, contributing to a stronger EM EPS performance.
EM earnings outperform by less than GDP, even in the long run. In previous research we analysed the long-term relationship between GDP and earnings growth across EM and DM economies and found evidence that earnings growth for a given rate of GDP growth is lower in EMs than in DMs.[22] A key reason for this is that, while Foreign Direct Investment (FDI) from DM to EM economies is an important driver of EM GDP growth, the earnings from that investment are repatriated back to the DM investor companies (i.e., the output of the investment counts as EM GDP but the earnings from that investment are recorded as DM earnings). Nevertheless, although EM earnings growth has failed to keep pace with its GDP outperformance, over longer horizons EM earnings have still outperformed significantly. Over the 35-year history of the MSCI EM index, EM EPS growth (in real US Dollars) has averaged +5.0% per year vs. +2.7% in DM.
Exhibit 28: EM Equities Trade at a Discount to DM Equities, Despite Stronger Growth Prospects
Appendix 1: Our Methodology in Detail


Labour Force
Exhibit 29: Working-Age Population and Employment Weakly Related; Our New Assumptions Imply Smaller Drag on Growth From Demographics

Capital and Investment


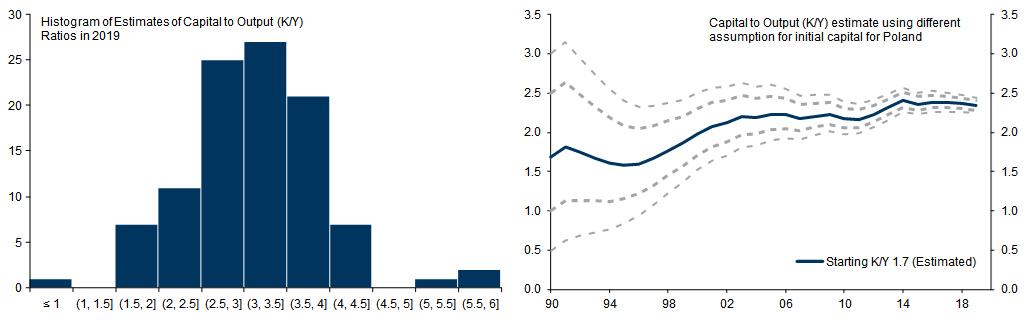
Exhibit 30: With More Observations, the Capital-to-Output Ratios Are Less Dependent on Initial Capital Stock Assumptions

Productivity and Convergence
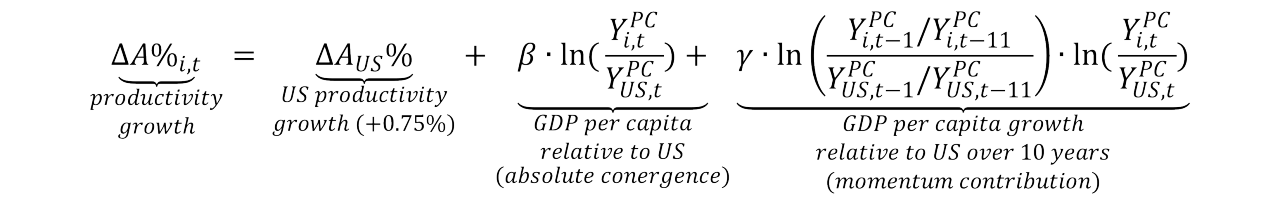
Exhibit 31: Our Convergence Framework 'Rewards' Countries That Have Outperformed in the Last 10 Years, and 'Penalises' Underperformers
Exchange rates
Exhibit 32: Previous Model Has Done Reasonably Well After Adjusting for Dollar Effects
Appendix 2: Forecast Summary
Bibliography
- 1 ^ The BRICs acronym was coined by Jim O’Neill, our former Chief Economist, in the 2001 publication (“Building Better Global Economic BRICs”, GS Global Economics Paper, 30 November 2001). However, the first set of long-term growth projections for the BRICs and other economies didn’t appear until 2003 (“Dreaming with BRICs: The Path to 2050”, GS Global Economics Paper, 1 October 2003). These projections were then updated and extended to include 70 economies in 2011 (“The BRICs 10 Years On: Halfway Through the Great Transformation”, GS Global Economics Paper, 7 December 2011).
- 2 ^ “Is the World Deglobalizing, Slowbalizing or Newbalizing?”, Global Economics Comment, 18 April 2022.
- 3 ^ The slowdown that we expect in global potential GDP growth would be larger were it not for the increasing share of global GDP accounted for by (relatively fast-growing) EMs.
- 4 ^ We run the comparison between 2010 and 2019 (rather than between 2010 to 2020) to avoid capturing the effects of the Covid pandemic on GDP, most of which we expect to be recouped over time.
- 5 ^ It is worth noting that there was no obvious pattern to our projection of ‘hits’ and ‘misses’ over the past 10 years. The cross-country growth performance was largely unrelated to income levels (i.e., it is not generally the case that DM countries did better on average than EM countries). Terms of trade developments were one partial differentiator: countries suffering from terms of trade deteriorations fared worse, on average. But, given the inherent uncertainty of commodity price developments, it is difficult to draw lessons from this for our forecasts of future economic growth.
- 6 ^ The collapse of the Communist regimes in Russia and CEE in 1989/1990 was the most important cause of CEEMEA’s poor economic performance during this period. In addition, growth was relatively weak in Africa and the Middle East during the 1980s and 1990s.
- 7 ^ Our sample for this comparison includes 122 DM and EM economies. We exclude GCC oil-exporting economies from our sample, due to distortions to productivity measures from commodity price cycles.
- 8 ^ The slope of the regression line for 2000-2020 is around 0.05.
- 9 ^ The leading proponent of the techno-pessimist view is the economic historian Robert Gordon. His argument is essentially that, for all the technological wizardry of recent innovations (such as smart phones and social media), their contribution to productivity growth is more limited than the generation of innovations that preceded them.
- 10 ^ We include a World ex-China series in this exhibit because developments in China’s trade have been sufficiently significant to materially affect the global aggregate. China’s trade/GDP share has fallen from 64% to 34% over the past 10/15 years, reflecting its ‘localisation’ strategy of onshoring a greater share of the inputs into production.
- 11 ^ One issue that we do not address in this piece is the increasing difficulty that statisticians face in measuring GDP as output shifts away from tangible goods and towards technology and tech-related services. As technology becomes more important, these measurement issues are rising over time. Consequently, official data are likely to overstate the slowdown in productivity growth.
- 12 ^ A key paper in this literature is Barro and Sala-i-Martin (1992), ‘Convergence’, Journal of Political Economy, 100, 2, 223-251.
- 13 ^ It is also important to highlight the factors that do not appear to play a role in driving long-term GDP growth. In particular, it is difficult to discern any straightforward relationship between average tax levels and either GDP per capita levels or growth: there are rich economies with high taxes, poor economies with low taxes, and vice versa.
- 14 ^ The importance of institutions in economic development has been championed by the economist Daron Acemoglu. See, in particular, his 2012 book (with James Robinson) “Why Nations Fail: The Origins of Power, Prosperity, and Poverty”.
- 15 ^ We use estimated data for 2022 and GS or IMF forecasts for 2023. The model forecast then ‘kicks in’ from 2024 and beyond.
- 16 ^ Note that this is true despite our projections factoring in a slower rate of absolute convergence than our 2003 or 2011 projections.
- 17 ^ The Lorenz curve is constructed by mapping out the share of global GDP accounted for by the share of population of countries as we move from poorest to richest. The more ‘bowed’ the curve is, the more unequal the distribution. The ‘Gini coefficient’ – the most used measure of income inequality – measures the area between the Lorenz curve and the 45-degree line of perfect equality.
- 18 ^ We first discussed this phenomenon in “The Expanding Middle: The Exploding World Middle Class and Falling Global Inequality”, Global Economics Paper, 7 July 2008.
- 19 ^ “How Fast Does the World Grow?”, GS Global Economics Analyst, 27 October 2021.
- 20 ^ A separate reason why the gap between global GDP growth calculated using PPP-based weights and market-based weights has shrunk is because PPP exchange rates are now closer to market rates (i.e., the weighting schemes are now more similar).
- 21 ^ Whether EM equities 'should' trade at a P/E premium or a discount to DM equities ultimately depends on the balance between the potential for superior earnings growth in EMs (which argues for a premium) vs. the additional risk/volatility associated with that growth (which argues for a discount). In practice, apart from a brief period during the Global Financial Crisis, EM equities have traded at a significant discount to DM equities since the turn of the century.
- 22 ^ “EM Long-Term Growth and Equity Earnings – Stronger Growth, (Somewhat) Better Earnings”, EM Macro Themes, 25 May 2019.
- 23 ^ 'Effective' retirement ages (i.e., the age at which workers actually exit the workforce on average) are typically much lower than statutory retirement ages. Much of the increase in 'effective' retirement rates observed in the past 20 years across countries has come from a reduction in the early retirement rate, rather than from an extension of working lives beyond the statutory retirement age.
Investors should consider this report as only a single factor in making their investment decision. For Reg AC certification and other important disclosures, see the Disclosure Appendix, or go to www.gs.com/research/hedge.html.