Commodity Views
Weather masks deeper positive shifts
The winter that wasn't. If there was ever a winter that macro markets were focused on it was this one as the tenuous gas balance in Europe and tight global oil markets left the entire commodity complex exposed to shifting weather. As this winter is shaping up to be one of the warmest on record for Europe, apparent in last week's 14-day ahead forecast showing the first three weeks of January as over 2 std warmer than normal. This unseasonable heat impacts not just Europe but also the US, where the January warmth is set to have twice the impact of the December cold (see Exhibit 2), driving down demand for all winter fuels significantly lower. In the past two weeks natural gas on both sides of the Atlantic collapsed by nearly 20%, with oil down 8.5%, and grains 3.8%. Oil demand is hit not only by the lost heating demand, but also by the lost gas-to-oil substitution in Europe with European gas price prices back to September 2021 levels at €70/MWh. Weaker energy prices then pulled down grains prices despite tightening Argentine supply. We estimate that the immediate spot demand hit to oil could be as much 1.5 million b/d[1] and should European gas prices remain weak for the rest of this year, the extended loss of gas-to-oil substitution would lower our oil price forecast by $4/bbl for 2023. However, this doesn't take into consideration a faster reopening of China, a stronger underlying European economic outlook as a result of relaxed energy constraints and a more benign inflationary backdrop. We estimate a faster reopening of China is alone worth +$5/bbl on the 2023 oil price forecast. Accordingly, we maintain our 2023 bullish outlook on oil and commodities with this latest warm weather posing downside risks to our gas price targets.
Exhibit 1: This winter period has been one of the warmest on record
Northwest Europe average heating degree days (HDD) for the Oct-Jan period since 1970 ranked from coldest to warmest, HDD
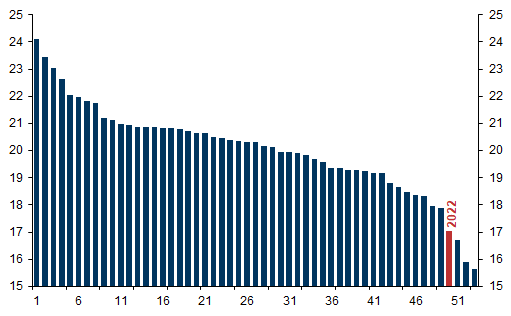
Source: Bloomberg, Goldman Sachs Global Investment Research
Exhibit 2: Weather swung from colder to much warmer than average over the holidays
Cumulative heating degree day deviation from 10-year average (lower is warmer), HDD
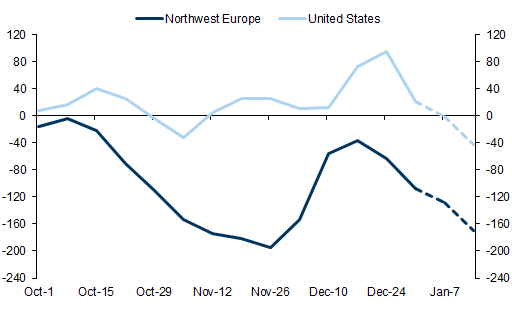
Source: Radiant Solutions, Bloomberg, Goldman Sachs Global Investment Research
Exhibit 3: Warmer weather impacts oil demand both directly via gasoil, but also indirectly via less natural gas to oil (G20) switching
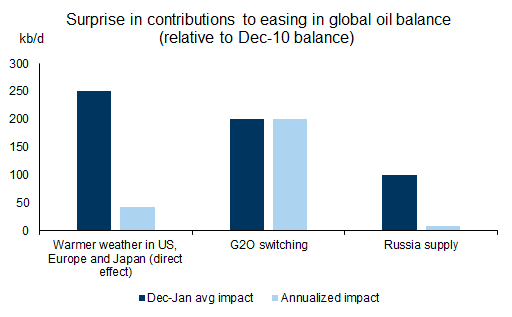
Source: Goldman Sachs Global Investment Research
2022: a tale of two halves. The key reason we are looking through this weather shock is that commodities' 2022 headwinds are now turning, particularly in China which further relaxed restrictions on international travel today. To understand the importance of these shifts it is worth looking back on 2022. Last year investors faced a confounding year in commodities, with 55% returns inside the first 6 months followed by a 29% slide in the second half of the year, leaving total returns up 26% in 2022. Despite the sell off, commodities were the best performing asset class for the second year in a row with energy equities returning 59%. At their peak in June last year, commodities - energy and non-energy alike - were pricing disrupted Russian supplies and stabilizing Chinese demand post Shanghai lockdowns in a supportive macro environment of Fed rates at 75bps and the DXY at 95. While fundamentals did soften with higher than expected Russian and OPEC production and a Chinese economy beset by rolling lockdowns, central bank generated deflation was the largest driver of price downside (see Exhibit 4). For scale, our macro pricing model indicates that across the year, were the dollar to remain the same, BCOM prices would have been 15% higher, while persistent growth in Chinese IP would have kept prices 7% higher.
With 425bps of Fed rate hikes raising capital costs, investors deleveraged, pushing down futures prices at the same time as inventory destocking pressured physical prices. The downward effect of these drivers acted in sequence to sustain pressure on commodities through 4Q22. Investors had to adjust first to a more aggressive Fed in June, then to persistently higher Russian exports in Jun-Aug and finally greater concerns over Chinese COVID lockdowns and physical destocking in November.
Exhibit 4: The impact of the dollar was substantially larger across 2022 than that of China
Simulated price paths under a constant dollar at Mar22 levels and a constant Chinese industrial activity level Mar22 - simulations made using four-factor pricing model
Source: Bloomberg, Goldman Sachs Global Investment Research
Exhibit 5: Chinese demand lagged our prior expectations as rolling lockdowns disrupted activity
High frequency China oil demand model (kb/d)
Source: Kpler, ICIS, QQ, Goldman Sachs Global Investment Research
Markets wait for a catalyst. Today, we see increasing evidence that the three drivers of the past six months of downside are beginning to turn with Russian production declining c. 0.3mb/d since the start of December while Chinese mobility indicators appear to have bottomed and softening revisions in US wage data raise the prospect of a soft-landing, keeping the dollar 7% off its peak. Despite an incrementally bullish forward outlook, the cumulative effect of last year's shock has been to create a patch of poor performance in commodities, shifting the burden of proof toward visibility on bullish fundamentals before investors are willing to deploy risk. As a result, markets are in search of a catalyst, with price action likely to lag positive news but react aggressively to indication of further downside in Chinese demand or upside in Russian production.
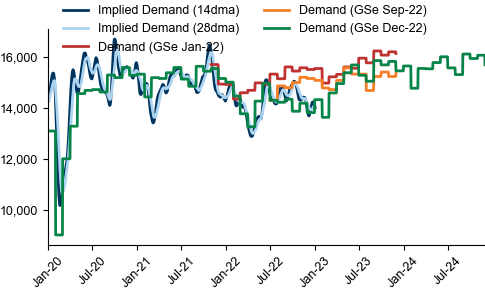
We expect metals prices to rally first as fundamentals face a tightening inflection in Chinese demand after LNY, further amplified by reopening acceleration and an extreme low starting point for inventory raising the risk of a restocking. Moreover, just as in summer 2021, policy restraints on China metals supply are increasingly likely as domestic energy balances tighten with reopening. The path lower in European energy prices bringing to a close the aggressive downstream destocking cycle which acted to lower effective metals demand in H2 last year. Yet just as demand constraints lift, we see limited risk of EU smelter restarts even in the current price environment. Spot and forward margins remain negative, particularly so for aluminium, where even if the cost deflation continues, pot lines take just under 6 months to restart at currently operating smelters and over a year if the smelter has been fully shutdown. We expect a shift back into metals deficits from Q2 onward which given extreme lows already in global stocks, points to an environment of significant price upside.
Exhibit 6: Copper prices are nearing a tipping point for further technical buying
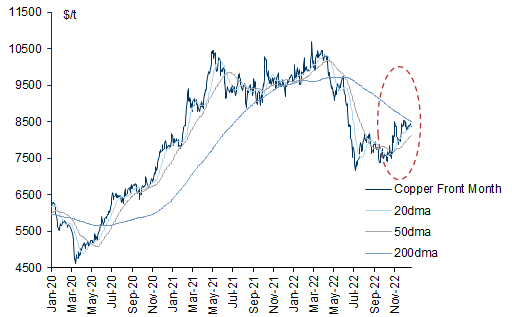
Source: Bloomberg, Goldman Sachs Global Investment Research
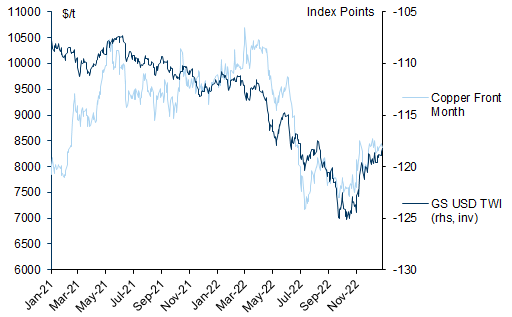
Exhibit 7: The dollar turned from headwind to tailwind toward the end of 2022 on the back of Chinese reopening and softening European gas balances
Source: Bloomberg, Goldman Sachs Global Investment Research
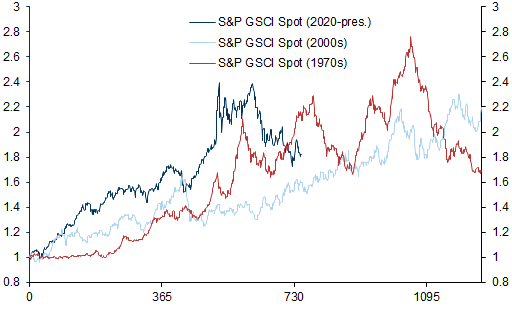
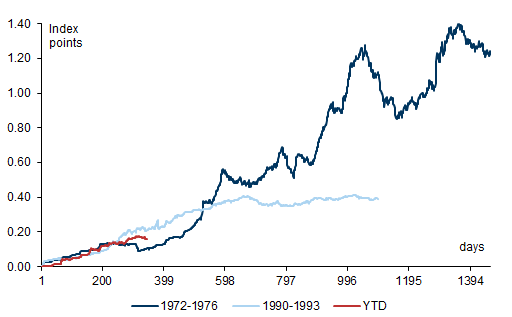
2023 will see price spikes not trending markets. As we often say, commodity supercycles are a sequence of price spikes, with each high and low higher than the previous spike. Unlike financial markets which average out the growth in forward earnings over time, commodity markets must balance supply and demand over a shorter horizon. When traditional buffers - inventories and short-cycle spare capacity - are depleted, prices spike to generate demand destruction. In this environment investor returns are generated through carry - via higher backwardation and interest rates - rather than through smooth trending spot prices. We believe that prices will most likely continue to follow this supercycle pricing dynamic in 2023. Today, markets are priced for a 2023 recession, positioned firmly risk off, and ill-prepared for a Chinese reopening, fewer gas constraints on European industry, and a more resilient than expected US economy.
Exhibit 8: Supercycles are a series of price spikes, not a smooth trend higher
Indexed performance of the S&P GSCI across supercycles
Source: Bloomberg, Goldman Sachs Global Investment Research
Exhibit 9: During periods of acute scarcity, backwardation allows investors to accumulate roll returns
Cumulative roll returns across each supercycle
Source: Bloomberg, Goldman Sachs Global Investment Research
A mild winter to relax the constraints on European growth. With Russian natural gas exports to Europe severely curtailed this past year, down 56% vs 2021, and with a boost in regional LNG imports only partially compensating for those losses, Europe has had to destroy industrial demand in order to balance the gas market. In NW Europe in particular, the region most affected by the Russian supply cuts, combined industrial and generation demand for natural gas was 10% down year-on-year and 14% down vs the five-year average. As we look into 2023, however, we note natural gas inventories have been lifted after a mild start to the winter and warmer-than-average year-end holidays, relaxing the gas-driven constraints on European economic growth. We expect this to be particularly visible once the generalized destocking process that has further slowed industrial activity ends this quarter. Importantly, while lower natural gas prices vs late-summer 2022 and the end of downstream destocking will likely boost energy-intensive industries, we note that some sectors are more flexible than others. While restarts in fertilizer production and zinc smelting in recent months have seemed to take place without difficulties, aluminium smelting is likely at the other end of the spectrum, with high restart costs making it slow to respond to these supportive signals to activity.
Exhibit 10: NW European forecasts see higher than average temperatures in January
Northwest Europe temperature and forecasts, degrees Celsius, Forecasts as of 3rd Jan 23
Source: GFS , Bloomberg, Goldman Sachs Global Investment Research
Exhibit 11: European storage is comfortably above the 5ya
Northwest Europe storage, Bcm
Source: Bloomberg, Goldman Sachs Global Investment Research
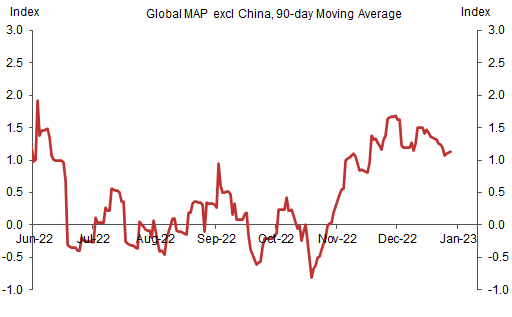
Global growth remains resilient. Outside of China, recent global activity data have generally been more resilient than feared and suggest the world is not in a recession. In fact, our global ex-China MAP measure of data surprises has now been in positive territory since November (Exhibit 12). Notably, the pattern of recent data beats has been most pronounced in Europe. Forward-looking Euro area activity measures have recently all turned the corner with rebounds (albeit from low levels) in the December releases of the S&P Manufacturing PMI future output measure, and the Sentix and ZEW forward-looking survey measures.
While US high frequency activity data have been mixed, they remain consistent with our economists view that a resilient consumer will keep the US economy out of a recession in 2023. While most US business surveys are soft (including the latest ISMs) and remain sluggish, consumer confidence measures have rebounded from their summer lows and job growth remains strong. Crucially, real consumer income and real consumer spending have been growing at a 2½%+ annualized pace over the past three months. The resilience in global-ex China activity data is not limited to DMs. Manufacturing PMIs have picked up in recent months in Central and Eastern Europe, but also in India where the overall and future output measures have risen further to lofty levels of 59.0 and 67.1, respectively (Exhibit 13).
Exhibit 12: Since Novemeber, economic growth has surprised to the upside
Source: Goldman Sachs Global Investment Research
Exhibit 13: Both European and EM PMI's are expanding into 2023
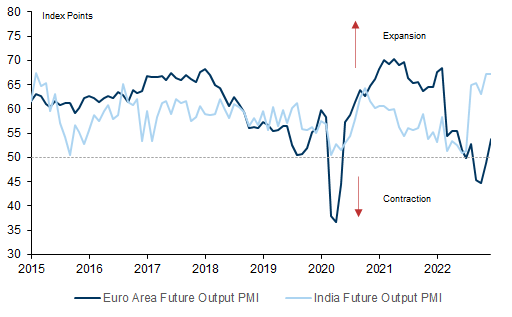
Source: Haver, Goldman Sachs Global Investment Research
Moving toward a post-lockdown China. The most bullish piece of news to emerge over the holiday period has, in our view, been China's rapid move toward reopening. Investors remaining relatively risk neutral as they asses the duration and impact from the ongoing surge in cases. Yet the earlier than usual CNY holiday and clear policy shift from the government suggest that a commodities reopening tailwind is likely to occur sooner rather than later. Indeed, our economists now point to rising congestion data in late December across major cities as evidence that the trough in onshore mobility may have now passed. Whilst the rapid COVID spread has undoubtedly negatively impacted recent activity levels in manufacturing (PMI 47.0 vs 47.8 cons.), our economists have recently upgraded their 2023 China growth forecast to reflect the markedly pro-growth tone from policymakers driving consumption-led acceleration from Q2 onward. This growing confidence on growth path is further underpinned by a clear and persistent pro-growth tone from policymakers. A rapid reopening could have a $5/bbl impact on our Brent forecasts based on our pricing models, accelerating our path by one quarter, with international travel potentially an additional tailwind. For metals in particular, the most recent PBOC meeting hinted at further demand-side property easing ahead, a sector which has been a key headwind to consumption trends over the past year. Alongside recent upgrades to expected renewables installations and auto sales over the next year, forward demand expectations have continued to increase. As we emphasized in our most recent copper note, we now expect a near doubling in China demand growth rate in 23’ (+4% y/y) versus 22’ (+2.6% y/y) which in turn will maintain a full year metal deficit (GSe 178kt deficit). With base metal inventory levels at their lowest since 2004 on a consumption adjusted basis, gathering momentum in China’s demand recovery risks generating scarcity phases and price spikes through the course of the year.
Mobility may have bottomed in mainland China
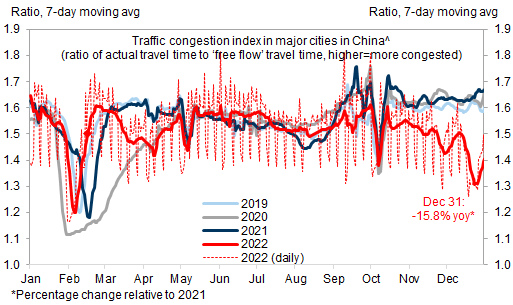
Source: Wind, Goldman Sachs Global Investment Research
Exhibit 14: The impact of Chinese reopening is particularly elevated today
Flat price impact of different fundamental shocks in different pricing regimes (USD/bbl)
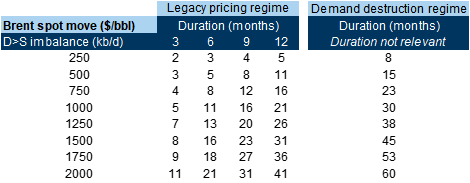
Historical pricing regime assumes $100/bbl base price, with back end prices moving with a 70% beta to timespreads. Duration not relevant in demand destructive regime as prices lift higher to balance supply with demand given depleted stocks, prices stay elevated as long as the disruption is in place. Duration's 'irrelevance' in the demand destruction regime is more theoretical than likely to be practically observed.
Source: Goldman Sachs Global Investment Research
Russia: From hoarding to destocking and back to scarcity in 2023. Throughout 2022, commodity price swings where exacerbated by the shifting physical and financial constraints created by the threat of Russian supply disruption across all commodities, not just oil and gas. With supply uncertain, downstream consumers underwent precautionary stock building, particularly in Europe and Asia ex-China. These fears and associated hoarding lasted until June 2022 as the Russian supply outlook continued to fall, particularly across oil, gas and wheat. However, through July and August Russian oil production surprised sharply to the upside, suggesting that Russia was maximizing oil revenue in anticipation of the sharp curtailment in gas exports that occurred in August. As the European natural gas market worked to balance post the total curtailment of Russian gas exports to NW Europe and the start to the European winter proved to be mild, the hoarded supplies returned to market as destocking occurred across all sectors - in particular European metals. With the system now broadly destocked over concerns of recession, it is paradoxically far more vulnerable to a Russian disruption just as Russian crude supplies have started to fall again as sanctions begin to bite. It is important to remember that the structure of the price cap creates a backward bending supply curve for Russia where higher prices incentivize lower exports which would only exacerbate the scarcity in inventories, shifting the market back into scarcity pricing. With sanctions raising legal risk around shipping, insurance and financing of oil trade flows, exports are increasingly struggling to find homes, with even China and India seeing sequential declines in imports recently. This is best seen in the large increase in oil on water (c.40mb) since November. In our view, the February products embargo is likely to be even more disruptive with the physical and logistical challenges of tight tanker markets likely to prove to be the binding constraint on products trade throughout 2Q23.
Exhibit 15: Russia oil on water soared by 40 mb since the announcement of the embargo.
Russia oil on water, kb
Source: Kpler, Goldman Sachs Global Investment Research
Exhibit 16: Russia exports to the West have fallen since the embargo announcement, with more room to fall further
Russia oil exports by destination, kb/d
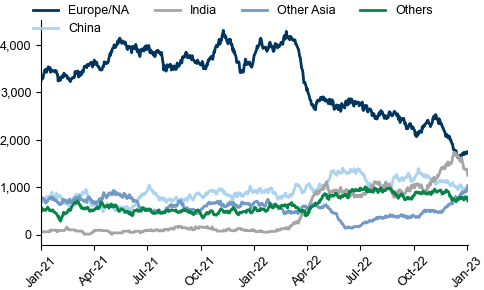
Source: Kpler, Goldman Sachs Global Investment Research
- 1 ^ 1.5mb/d is an estimated peak effect from a maxmium loss of HDD on any given day, with the expected average effect of the weather driving a 450kb/d demand loss over December and January in Europe, both from direct effects and indirect loss of substitution away from gas.
Investors should consider this report as only a single factor in making their investment decision. For Reg AC certification and other important disclosures, see the Disclosure Appendix, or go to www.gs.com/research/hedge.html.